Age and metallicity gradients in fossil ellipticals
Abstract
Context. Fossil galaxy groups are speculated to be old and highly evolved systems of galaxies that formed early in the universe and had enough time to deplete their galaxies through successive mergers of member galaxies, building up one massive central elliptical, but retaining the group X-ray halo.
Aims. Considering that fossils are the remnants of mergers in ordinary groups, the merger history of the progenitor group is expected to be imprinted in the fossil central galaxy (FCG). We present for the first time radial gradients of single-stellar population (SSP) ages and metallicites in a sample of FCGs to constrain their formation scenario. We also measure line-strength gradients for the strongest absorption features in these galaxies.
Methods. We took deep spectra with the long-slit spectrograph ISIS at the William Herschel Telescope (WHT) for six FCGs. The obtained spectra are fit with Pegase HR SSP models within the full-spectrum fitting package ULySS yielding SSP ages and metallicities of the stellar populations. We measure radial gradients of SSP ages and metallicities along the major axes. Lick indices are measured for the strongest absorption features to determine line-strength gradients and compare with the full-spectrum fitting results.
Results. Our sample comprises some of the most massive galaxies in the universe exhibiting an average central velocity dispersion of km s-1. Metallicity gradients are throughout negative with comparatively flat slopes of while age gradients are found to be insignificant (). All FCGs lie on the fundamental plane, suggesting that they are virialised systems. We find that gradient strengths and central metallicities are similar to those found in cluster ellipticals of similar mass.
Conclusions. The comparatively flat metallicity gradients with respect to those predicted by monolithic collapse () suggest that fossils are indeed the result of multiple major mergers. Hence we conclude that fossils are not ’failed groups’ that formed with a top heavy luminosity function. The low scatter of gradient slopes suggests a similar merging history for all galaxies in our sample.
Key Words.:
Galaxies: elliptical and lenticular, cD – Galaxies: stellar content – Galaxies: evolution – Techniques: spectroscopic1 Introduction
Fossil galaxy groups are observationally defined as extended X-ray sources with X-ray luminosities above erg s-1 and a single bright elliptical dominating the optical, all other galaxies within one-half virial radius being at least 2 magnitudes fainter in the band (Jones et al. 2003). Earlier numerical simulations of Barnes (1989) predicted such observational characteristics for old and evolved groups of galaxies that had enough time to deplete their galaxies through successive mergers of member galaxies, building up one massive central elliptical, but retaining the group-sized X-ray halo. Contrary to this hierarchical merging scenario it was also suggested that fossils could simply be ’failed groups’ that formed with a top-heavy luminosity function absent of galaxies (Mulchaey & Zabludoff 1999).
The first fossil group was identified by Ponman et al. (1994). Since then, several other objects have been assigned to this class in the last few years (Vikhlinin et al. 1999; Jones et al. 2003; Yoshioka et al. 2004; Sun et al. 2004; Khosroshahi et al. 2004; Ulmer et al. 2005; Schirmer et al. 2010; Pierini et al. 2011; Miller et al. 2012). Jones et al. (2003) estimated fossils to be quite frequent, constituting 8-20% of all systems with comparable X-ray luminosity ( erg s-1). The detection of these aggregates is challenging however, mainly because of their unremarkable appearance in the optical and the lack of high X-ray data. Recent studies have shown that fossils are much more massive than expected for remnants of group-sized haloes, comparable to poor clusters rather than groups (Mendes de Oliveira et al. 2006, 2009; Cypriano et al. 2006; Proctor et al. 2011; Eigenthaler & Zeilinger 2012). Because of these inconsistent findings, mainly due to the small number of fossils studied so far, various formation scenarios have been proposed for these systems. Based on scaling relations of ordinary groups and clusters, Khosroshahi et al. (2007) concluded that fossils had an early formation epoch, while Proctor et al. (2011) stated that fossils might simply be dark clusters, being comparable to ordinary clusters in mass and X-ray luminosity, but otherwise possessing the richness and optical luminosities of poor groups. Simulations by Dariush et al. (2007) using the Millennium and Millennium gas simulations (Springel et al. 2005) revealed that at any given redshift, fossils have assembled a higher fraction of their final halo mass compared to non-fossils with similar X-ray luminosity, suggesting that fossils indeed formed early with most of their halo mass in place at higher redshifts. A similar result was found by D’Onghia et al. (2005) using N-body/hydrodynamical simulations, concluding that fossils have already assembled half of their final dark matter mass at , leaving sufficient time for galaxies to merge, resulting in the exceptional magnitude gap at whilst in non-fossils the final dark matter halo mass is assembled quite recently. Although fossil systems are believed to have collapsed early and have assembled most of their virial masses at higher redshifts, the central galaxies in fossil groups may have merged later than non-fossil bright central galaxies (Díaz-Giménez et al. 2008).
Assuming that fossils originate from ordinary galaxy groups that evolved to compact groups which subsequently coalesced into one massive elliptical, the merger history of the progenitor group is expected to be imprinted in the fossil central galaxy (FCG) and any differences in the evolution compared to field or cluster ellipticals should be reflected in the overall characteristics of these galaxies. Since the space density of fossils is considered to be as large as that of poor and rich clusters combined, fossils could also provide suitable environments for the formation of luminous cD galaxies observed in clusters. Following this possible connection, Khosroshahi et al. (2006) investigated the morphology of seven FCGs with the conclusion that the isophotal shapes of FCGs are always discy in contrast to brightest group (BGG) and cluster (BCG) galaxies. La Barbera et al. (2009) found no differences in the structural parameters between a sample of 25 FCGS, selected from the SDSS, and field ellipticals. The examination of stellar populations revealed similar ages, metallicities, and -enhancement compared to bright field ellipticals. In addition, elliptical galaxies in compact groups were found to be older and more metal poor than field ellipticals and fossil groups, which had already been established in earlier works (Proctor et al. 2004; de la Rosa et al. 2007). It was thus noted that FCGs cannot be formed by dry mergers of ellipticals in compact groups. However, a wet merger with a gas-rich disk galaxy could also explain the observed relations. More recently, Méndez-Abreu et al. (2012) have studied the near-infrared photometric and structural properties of a sample of 20 FCGs. These fossils closely follow the observed tilted fundamental plane of normal ellipticals (Bernardi et al. 2003b), suggesting that they are dynamically relaxed systems that suffered dissipational mergers during their formation (Hopkins et al. 2008). However, a change in the slope of scaling relations involving stellar mass was interpreted by subsequent major dissipationless mergers, increasing size and mass of the galaxies but leaving velocity dispersion unaltered (Bernardi et al. 2011). Because of low S/N data these authors couldn’t determine whether fossils are systematically boxy or discy. Since most of these previous studies have focused on the photometric and structural properties of FCGs, detailed information on their spatially resolved stellar population parameters is still lacking.
This paper investigates age, metallicity and line-strength gradients of a sample of six FCGs to shed light on the formation and evolution of fossils. The galaxies were selected from the samples of Mendes de Oliveira et al. (2006), Santos et al. (2007), and Eigenthaler & Zeilinger (2009), according to their redshift and high apparent brightness. At redshifts between , the systems lie at luminosity distances between Mpc. These values correspond to an age of the universe of 13.1 back to 12.4 Gyr at the redshift of the observed galaxies. According to Dariush et al. (2007), the Millennium simulation predicts that fossils at these redshifts should have assembled at least 95% of their total dark matter mass.
The paper is organised as follows. In Sect. 2 observations and data analysis techniques are described whilst Sect. 3 presents all obtained results. Sect. 4 discusses and compares our findings with similar data from the literature. Conclusions are given in Sect. 5. Magnitudes presented in this work are SDSSIII DR9 model magnitudes. Throughout the paper, the standard CDM cosmology with , , and a Hubble constant of km s-1 is used.
2 Observations and data reduction
Long-slit spectroscopy of a sample of six FCGs was performed with the long-slit spectrograph ISIS at the William Herschel Telescope (WHT) in visitor mode. The observations were carried out in 2008 on December 20 and in 2009 on April 28. ISIS is suitable for long-slit spectroscopy up to 4 arcmin slit length. Through the use of dichroic filters, the instrument allows simultaneous observations in both a blue and a red arm. Both arms provide an array of 40962048 pixels with 13.5m and 15m pixel size, respectively. The CCDs are arranged so that the long axis is placed along the dispersion direction maximising spectral coverage. The spatial scale is 0.2 arcsec pixel-1 in the blue and 0.22 arcsec pixel-1 in the red yielding a maximum unvignetted slit-length of 3.7 arcmin. The spectrograph is designed such that a slit-width matching the typical seeing of the site (1 arcsec) corresponds to approximately 4 pixels FWHM on the CCD for all gratings. To cover the most prominent absorption features H, Mg2, Mg, Fe5270, Fe5335, Fe5406, the 6100 dichroic in combination with the R300B grating (0.86 Å pixel-1) in the blue and the R1200R grating (0.26 Å pixel-1) in the red was requested. If no emission lines were expected around H from SDSS spectra, the R316R grating (0.93 Å pixel-1) was used instead. A slit width of 1 arcsec was considered for all galaxies.
Table 1 lists all ellipticals observed at the WHT. The total integration time of the targets was split into 3 or 4 single exposures of minutes each to correct for cosmic rays. The spectrograph slit was aligned to the major axis of each galaxy except for RX J0752.7+4557 and RX J0844.9+4258 where the slit was aligned so that nearby bright galaxies were also covered. The slit position angles are given in Table 1.
| galaxy | exposure | PA | spectral range | FWHM | |||||
|---|---|---|---|---|---|---|---|---|---|
| [mag] | [seconds] | [∘] | blue arm | red arm | [arcsec] | ||||
| NGC 1132 | 02 52 51.8 | 01 16 28.8 | 0.023 | 12.19 | 4 2700 | 140 | 38006250 Å | 66007200 Å | 1.3 |
| RX J0752.7+4557a | 07 52 44.2 | +45 56 57.4 | 0.052 | 14.43 | 3 3000 | 76 | 38006250 Å | 66007200 Å | 1.3 |
| RX J0844.9+4258a | 08 44 56.6 | +42 58 35.7 | 0.054 | 13.93 | 3 3000 | 36 | 38006250 Å | 66007200 Å | 1.3 |
| RX J1152.6+0328b | 11 52 37.6 | +03 28 21.8 | 0.081 | 14.37 | 3 2700 | 23 | 38006250 Å | 63008500 Å | 0.7 |
| RX J1520.9+4840b | 15 20 52.3 | +48 39 38.6 | 0.074 | 13.68 | 3 2600 | 94 | 38006250 Å | 63008500 Å | 0.7 |
| RX J1548.9+0851a | 15 48 55.9 | +08 50 44.4 | 0.072 | 13.20 | 3 2600 | 33 | 38006250 Å | 63008500 Å | 0.7 |
Notes:
a from Santos et al. (2007)
b from Eigenthaler & Zeilinger (2009)
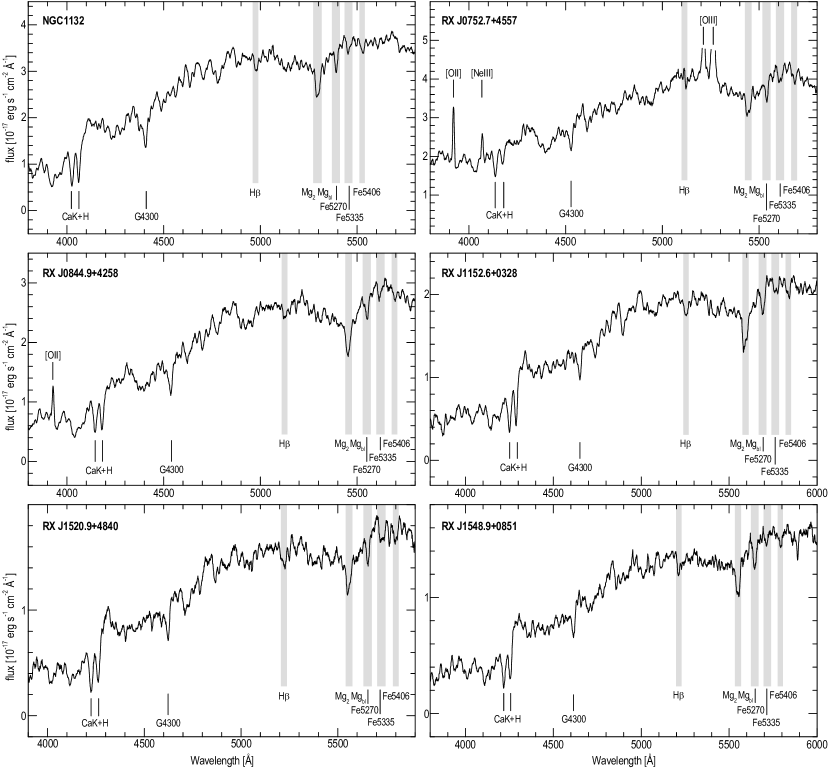
Basic data reduction and calibration was carried out in IRAF based on bias, flat, and arc frames taken in the afternoon and at dawn. Arcs were also taken during the night after each movement of the telescope to account for possible detector shifts. General CCD reduction steps such as bias subtraction, trimming, and flat-fielding were carried out within the IRAF ccdred package to remove the instrument signature. Bad pixels were removed by interpolating over nearby pixel regions. Subsequent spectral reduction was performed in the longslit package. Small geometric distortions introduced by the camera optics were removed by tracing the spectrum on the detector and transforming the tilted coordinates to the orthogonal image axes. Spectra were wavelength calibrated by identifying ISIS CuNe and CuAr lines in the arc lamp spectra. Line positions were fit by a 3rd order cubic spline to set the dispersion solution. Individual frames were average combined to improve the S/N and filter out cosmic rays. Sky subtraction was carried out with the IRAF background task by specifying two or three background windows on either side of the combined galaxy spectra. A order Chebyshev polynomial was then fit to these background regions in all columns along the dispersion direction and subtracted from the data. The fit to the sky was checked for all galaxies in steps of 100 pixels along the dispersion direction. We note that because of the small spatial extent of the investigated galaxies with respect to the CCD chip, the Chebyshev polynomial was always flat or showed only a very minor linear trend along the galaxy which was always much smaller than the noise of the sky background. The background windows were chosen so that a large area of the sky was covered along the slit. The comparatively high degree of the Chebyshev polynomial was chosen so that a good estimate for the sky was achieved along the whole slit. The polynomial was almost always found to be flat. The sky subtracted spectra were then checked individually for any remaining night sky emission lines. For the fainter emission lines, the subtraction yielded an excellent result. Only the strongest lines, [OI] at Å and the sodium doublet at Å showed minor residual patterns. ING spectrophotometric standard stars matching the airmass of the scientific targets were selected from the ING landscape tool111http://catserver.ing.iac.es/landscape/. Standard star spectra were extracted by means of the algorithm described in Horne (1986) to retrieve the maximum S/N without biasing the resulting fluxes. To minimise light loss due to differential atmospheric refraction, all stars were observed with the slit oriented along parallactic angle. Flux calibration was performed by comparing the observed spectrophotometric standard star count rates with the corresponding absolute flux tables in La Palma Technical Notes 65 and 100. To account for atmospheric extinction, the data from La Palma Technical Note 31 was applied. Due to the long exposure times, effective airmasses have been calculated for each individual galaxy via the formula from Stetson (1989). The resulting sensitivity functions were finally applied to the galaxy spectra, removing both atmospheric extinction and the sensitivity characteristics of the CCD. To transform observed absorption-line features into the Lick IDS system, Lick standard stars were selected from the homepage of Dr. Guy Worthey222http://astro.wsu.edu/worthey/html/system.html. To match the stellar populations of the observed galaxies, G and K giants were considered for that purpose. Figure 1 shows the final reduced spectra of the central pixel of each galaxy in the blue arm smoothed to the resolution of the Lick/IDS spectrograph.
3 Data analysis and results
A reliable determination of ages and metallicities in ellipticals is difficult, since both quantities alter spectra and colours of these galaxies in a similar way. An age change of % is cancelled by a simultaneous metallicity change of %. This is widely known as the age-metallicity degeneracy, or degeneracy (Worthey 1999). Individual spectral features sensitive to either age or metallicity can be used to break this degeneracy, however (Burstein et al. 1984; Worthey et al. 1994; Worthey & Ottaviani 1997). These well-calibrated features allow predictions for the absorption-line strengths of whole single stellar populations (SSPs) of a given age and metallicity (Worthey et al. 1994). When focusing only on specific features in the spectrum of an old stellar population, one obviously misses the wealth of information embedded in all the remaining pixels along the dispersion direction, however. To account for this additional information besides the strongest absorption features, full spectrum fitting techniques have been developed. Because of the very low S/N in absorption lines at larger radii of the observed ellipticals, ages and metallicities are solely based on full-spectrum fitting in this work.
3.1 Full spectrum fitting with ULySS
The open-source package ULySS333http://ulyss.univ-lyon1.fr/ (University of Lyon Spectroscopic Analysis Software; Koleva et al. 2009) was used to fit synthetic single stellar population (SSP) models directly to the observed galaxy spectra yielding SSP equivalent ages and metallicities of the stellar populations of the investigated galaxies. ULySS makes use of the Pegase HR models from Le Borgne et al. (2004) based on the Elodie 3.1 library of stellar spectra (Prugniel & Soubiran 2001). Since the synthesis of a stellar population requires a stellar spectrum at any point in the parameter space (, log and [Fe/H]), the library involves an interpolator for that purpose. All Pegase HR models are computed assuming a Salpeter IMF and Padova 1994 evolutionary tracks providing synthetic SSPs with ages between 120000 Myr and metallicities between and dex. A multiplicative polynomial is used to adjust the overall spectral shape to the SSP model. The order of the polynomial can be freely chosen but shouldn’t be taken too low resulting mostly in a severe mismatch of the investigated spectrum and the SSP model. Koleva et al. (2009) have shown that the model fits converge to stable values between for the spectra of F, G, K and O stars and for an M star and becoming unstable again above . Hence, in order to achieve reasonable, stable values an order of 40 was chosen except where otherwise stated.
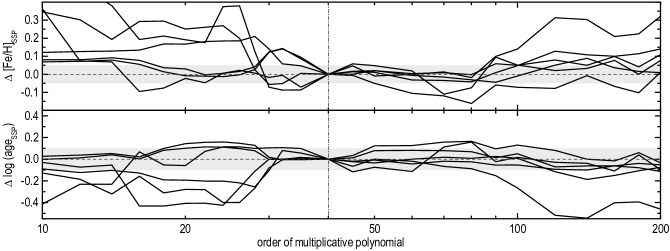
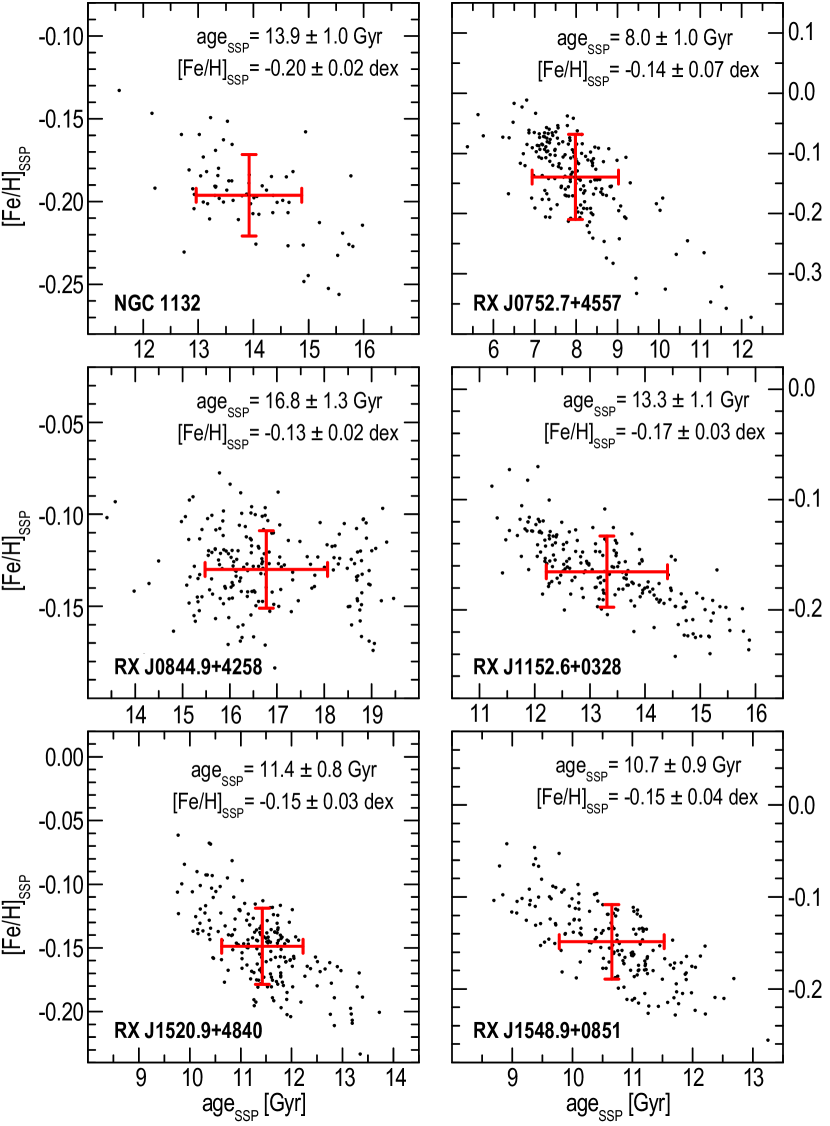
Figure 2 presents the variation of the fit results with increasing order of , specifically the deviations to values at . Shaded areas correspond to deviations of 0.05 dex in [Fe/H] and 0.1 dex in age. Except for RX J1548.9+0851, values stay within 0.05 dex in [Fe/H] from , matching the average error of the measured values. For orders above , values start to diverge again since the polynomial is trying to over-fit the spectra. Values of age show a larger spread compared to metallicity. The variations of age and metallicity with increasing are likely due to the limited S/N of the observed spectra. The ULySS parameter \CLEAN was considered for the fitting to exclude possible outliers in the galaxy spectrum, resulting from any remaining minor night sky emission. The clipping algorithm reduces the sensitivity of a fit to such undesirable features by reiterating the fit after outliers in the residuals have been identified and masked444 see http://ulyss.univ-lyon1.fr/uly.html#ULY_FIT for a detailed decription.. The reliability of the performed SSP fits was tested through the use of and convergence maps in the age-metallicity parameter space. To determine integrated SSP equivalent ages and metallicities of each galaxy, one-dimensional spectra were created by summing up all the signal along the spectrograph slit. 200 Monte-Carlo simulations were computed for every galaxy, repeating a fit successively with random Gaussian noise555The dimension of the added noise was based on a user-defined signal-to-noise ratio provided for each galaxy. The S/N ratios were measured with IRAF splot at a rest-frame wavelength of Å. applied to the spectrum in each step. The resulting point distributions were then used to calculate average SSP ages and metallicities and the associated standard deviations. Outliers clearly detached from the main point distributions were excluded for these measurements. Only blue arm spectra were considered because of the lack of prominent absorption features in the red channel. Convergence maps confirmed the independence of the obtained results from varying initial guesses for age and metallicity. Figure 5 shows the final point distributions of age and metallicity resulting from the applied Monte-Carlo simulations of the one-dimensional SSP fits. While the galaxies spread from 8 to 17 Gyr in SSP model age, SSP metallicities show consistent subsolar values around -0.15 dex. Almost all Monte-Carlo simulations follow a similar trend, revealing a much higher uncertainty in age than in metallicity.
3.2 Age- and metallicity gradients
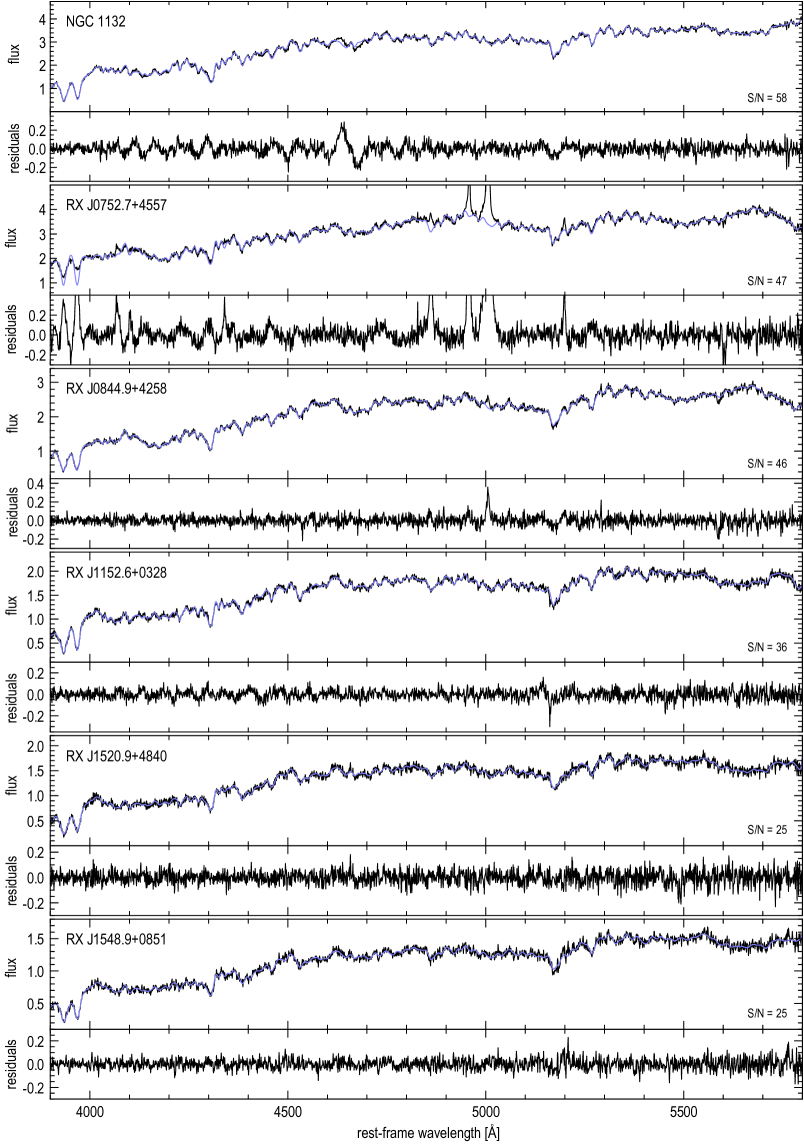
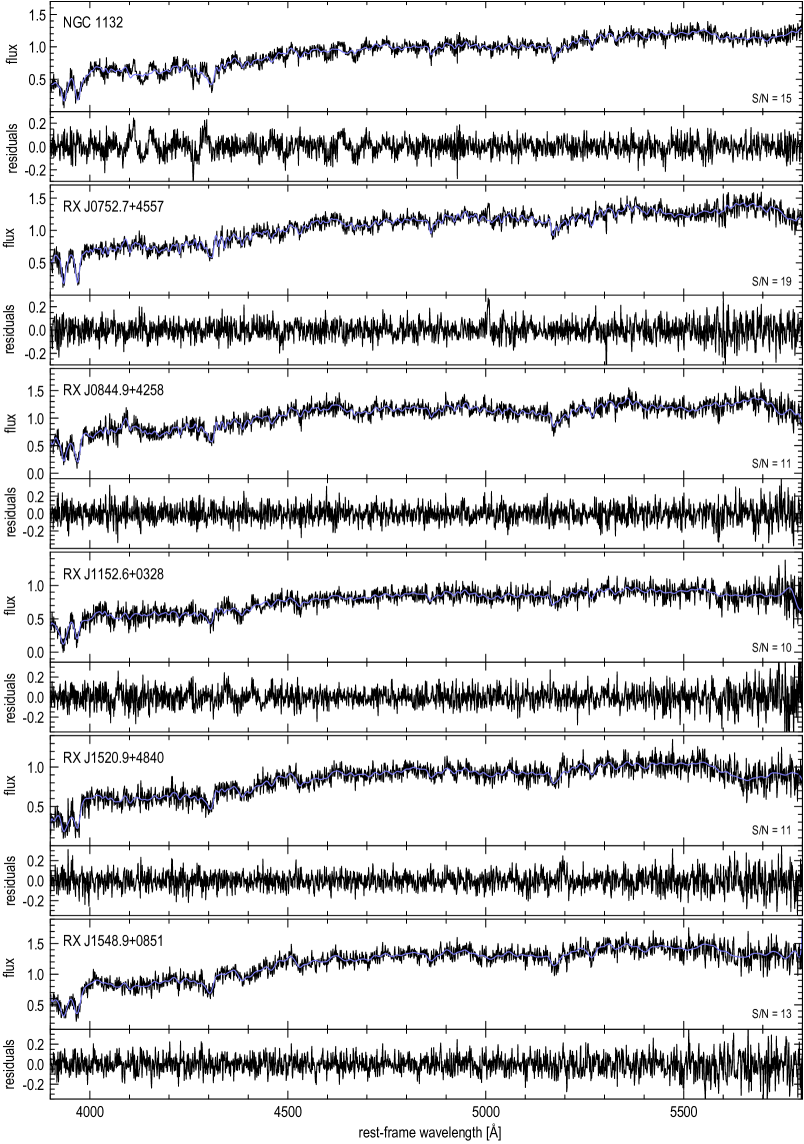
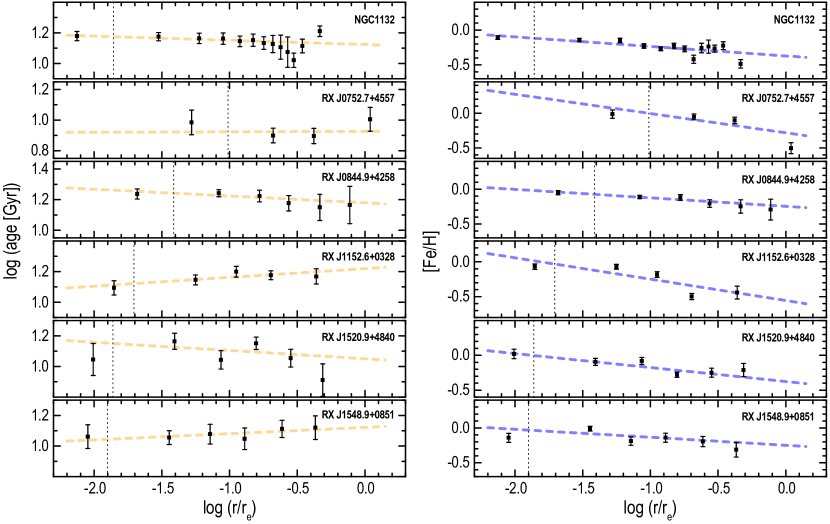
To investigate gradients of age and metallicity along the galaxy major axis, the observed long-slit spectra were chopped into bins along the spatial axis. The individual spectra were then fit separately with ULySS. Each spectrum was binned along the spatial direction to achieve a higher S/N. The seeing was estimated to 1.3 and 0.7 arcsec for the two nights corresponding to about 7 and 4 pixels, respectively. Central galaxy spectra were binned only by this small number of pixels, matching the present seeing while pixel rows were binned in the outermost spectra to achieve a reasonable S/N along the whole slit. Again, the S/N was estimated for each spectrum with splot at a rest-frame wavelength of Å. The S/N varies from for the central bins to for the outermost bins. Figures 3 and 4 show spectra of the central and outermost bins together with the corresponding SSP model fits and residuals. The estimated noise strongly affects the resulting Monte-Carlo simulations. While the central bins showed well-defined point distributions, the outer ones yielded much more diffuse results. In addition, there is a clear tendency that the fits in the outer bins tend to converge to the model limit at 19.99 Gyr. These data points were all neglected for the age and metallicity measurements. In each bin, the resulting ages and metallicities were then computed as the mean of the 200 Monte Carlo simulations. At a given radius, ages and metallicites were averaged from both sides of the galaxy centre. The corresponding error bars were estimated from the associated standard deviations. Assuming power-law gradients in age and metallicity, linear relations between , [Fe/H], and are expected. Hence, linear relations of the form
| (1) | ||||
| (2) |
have been fit to the SSP ages and metallicities obtained with ULySS, where and are the corresponding gradients in age and metallicity. The fits are presented in Fig. 6 while the corresponding numbers and input parameters for the fits are given in Table 2.
All metallicity gradients exhibit negative slopes between while gradients in age show both positive and negative slopes between . Gradient errors were determined directly from the linear least squares fits. To quantify the goodness of the fits, the coefficient of determination is listed in Table 2 for all fits. A value of corresponds to a perfect linear relation while indicates no linear relation at all. The observed metallicity profiles are much better fit by the utilized power-laws than the profiles in age.
| galaxy | MDa | LMINLMAXb | age[Gyr] | [Fe/H]0 | [km s-1]c | d | d | ||
|---|---|---|---|---|---|---|---|---|---|
| NGC 1132 | 50 | 38006100 Å | 15.11.0 | -0.110.03 | 227 3 | 0.68 | 0.13 | ||
| RX J0752.7+4557 | 40 | 38005800 Å | 9.71.8 | -0.010.06 | 29618 | 0.57 | 0.00 | ||
| RX J0844.9+4258 | 60 | 38005800 Å | 17.31.3 | -0.050.03 | 284 4 | 0.87 | 0.48 | ||
| RX J1152.6+0328 | 40 | 38005800 Å | 12.41.3 | -0.070.04 | 246 5 | 0.62 | 0.59 | ||
| RX J1520.9+4840 | 40 | 38005800 Å | 11.12.7 | 0.020.07 | 279 9 | 0.71 | 0.10 | ||
| RX J1548.9+0851 | 40 | 38005800 Å | 11.52.1 | -0.140.06 | 29210 | 0.30 | 0.55 |
Notes:
a Order of polynomial degree.
b Wavelength range used for the SSP fit.
c Aperture corrected central velocity dispersion.
e Coefficient of determination: perfect linear relation; no linear relation.
3.3 Line-strength gradients
Besides SSP ages and metallicities, the strongest absorption lines have been measured to investigate
line-strength gradients. For that purpose, Lick/IDS indices as defined in Worthey et al. (1994) and Worthey & Ottaviani (1997)
have been analysed. Due to the limited S/N at larger galactic radii, only the most prominent indices (H, Mg2,
Mg, Fe5270, Fe5335, Fe5406) have been considered. Figure 1 highlights the redshifted index bands in all six ellipticals. The
presented spectra have been smoothed to the Lick/IDS resolution. Other prominent lines are also marked. Since the spectral resolution of
the Lick/IDS system amounts to only Å, the observed spectra had to be degraded in resolution first. For that purpose, the FWHM of
emission lines was measured in the arc comparison spectra yielding an estimate of the actual spectral resolution. The spectra were then
convolved with a Gaussian kernel of dispersion to match the Lick/IDS system. The broadened spectra were subsequently
analysed with the open-source program indexf666version 3.0
24.08.2005
http://www.ucm.es/info/Astrof/software/indexf/indexf.html (Cardiel 2007). To estimate
errors of the measured indices, again a fixed S/N estimated at rest-frame wavelength of Å and 200
Monte Carlo simulations were considered. Final indices and errors were then computed as the mean of the 200 Monte
Carlo simulations. To transform the observed indices to the Lick/IDS system, Lick standards have been observed. Figure
7 shows the comparison between the measured indices and the original Lick data from
Worthey & Ottaviani (1997) for the observed standards. Indices show only small differences compared to the original Lick data, proving
the reliability of our measurements. To quantify the deviations to the Lick system, linear relations have been fit to the
data. To account for Doppler broadening, indices were measured consecutively in the Lick standard star spectra broadened to 50400
km s-1 in steps of 50 km s-1. Assuming that and are the absorption line-strengths of index and standard star measured at velocity dispersion and 0, then is the average correction factor
estimated from all observed standard stars for index . Thus, an index in a galaxy with velocity dispersion was
corrected by means of . Not
all indices show the same dependency with . While iron lines show a rather steep decline in index strengths,
H and Mg2 show comparatively small dependence. Correction functions were estimated by
averaging individual correction functions (excluding obvious outliers) and fitting
third order polynomials to the averaged data. Ultimately, all measured indices were corrected for velocity dispersion first and
subsequently transformed to the published lick data. Gradients of individual indices were measured by linear least squares
fits of the form
| (3) |

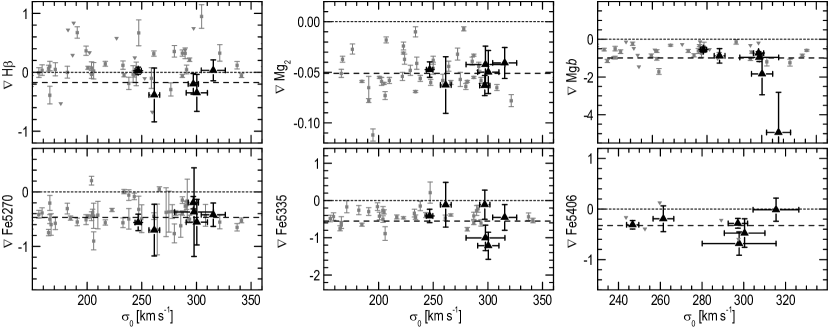
so that . As for ages and metallicites, indices at a certain radius were averaged from both sides of the galaxy centre. Obvious outliers at larger radii deviant from the overall gradient trend were excluded for the fit. Figure 8 shows the resulting gradient slopes with respect to the central velocity dispersions of each galaxy. Dashed lines show the avereage line-strength gradient for all galaxies while short-dashed lines highlight flat gradients for comparison. In the case of Mg, the very steep gradient for RX J1548.9+0851 has been excluded for the estimation of the average gradient slope. We compare our index gradients with those from Kobayashi & Arimoto (1999) and Rawle et al. (2010) and find similar gradient slopes. Only for Mg and Fe5335 we find gradients that are much steeper than in our comparison sample. Table 3 lists the line-strength gradients for each index and also gives the coefficient of determination for each fit. All metal sensitive lines (Fe and Mg) show negative gradients confirming the negative metallicity gradients derived from the SSP fits. Only Fe5406 in RX1548.9+0851 exhibits a flat gradient. The age sensitive H index exhibits both negative and slightly positive gradients. The steep positive gradient for H in RX J0752.7+4557 results from the line being observed in emission. Hence, this slope is not shown in Fig. 8. The observed line-strength gradients follow the trend derived from the SSP fits, clearly indicating negative metallicity gradients. To compare our index gradients with the metallicity gradients from ULySS, we consider index-metallicity relations from Worthey (1994) SSP models. In particular, we fit linear relations to the Worthey (1994) indices Mg2, Mg, Fe5270, Fe5335, Fe5406 for metallicities and galaxies with 12Gyr. These relations are of the form so that an index gradient corresponds to a metallicity gradient . We derive values of , , , , and . Applying these conversion factors to the average line-strength gradient slopes illustrated in Fig. 8, we find average metallicity gradients of (), (), (), (), () for the observed fossils. Except for the systematically lower value derived from Mg, all gradient slopes show very similar values resulting in an average metallicity gradient of . This result is consistent with the average gradient slope derived from full-spectrum fitting within the error bars. Individual gradient slopes are also consistent with the metallicity gradients derived from full-spectrum fitting within the corresponding error bars except for NGC1132, showing a systematically flatter gradient. We derive , , , , and from the averages of all line-strength gradients. However, we focus our results on the full- spectrum fitting technique since every pixel is considered for the determination of metallicity instead of only a few individual indices.
| galaxy | ||||||||||||
|---|---|---|---|---|---|---|---|---|---|---|---|---|
| NGC 1132 | 0.00.1 | 0.02 | -0.60.2 | 0.56 | -0.40.2 | 0.32 | -0.30.1 | 0.56 | -0.050.01 | 0.78 | -0.60.1 | 0.61 |
| RX J0752.7+4557 | 1.80.1 | 0.99 | -0.40.8 | 0.09 | -1.00.3 | 0.81 | -0.70.2 | 0.81 | -0.040.02 | 0.73 | -1.00.2 | 0.91 |
| RX J0844.9+4258 | -0.20.2 | 0.24 | -0.20.1 | 0.43 | -0.10.4 | 0.02 | -0.30.1 | 0.69 | -0.060.01 | 0.91 | -0.70.1 | 0.95 |
| RX J1152.6+0328 | -0.40.5 | 0.19 | -0.70.5 | 0.42 | -0.10.6 | 0.01 | -0.20.3 | 0.16 | -0.060.03 | 0.72 | -0.90.4 | 0.72 |
| RX J1520.9+4840 | -0.30.3 | 0.24 | -0.60.4 | 0.30 | -1.20.4 | 0.74 | -0.50.3 | 0.41 | -0.050.02 | 0.65 | -1.81.1 | 0.41 |
| RX J1548.9+0851 | 0.00.2 | 0.01 | -0.40.2 | 0.49 | -0.50.3 | 0.30 | 0.00.2 | 0.00 | -0.040.02 | 0.64 | -4.92.1 | 0.57 |
Notes:
a Coefficient of determination: perfect linear relation; no linear relation.
3.4 Velocity dispersions
To estimate the dynamical mass of the observed ellipticals, line of sight velocity dispersions (LOSVDs) have been derived with ULySS. By fitting SSP models to the observed spectra, the package also measures the broadening of each SSP model to match the observed spectrum, allowing for a proper determination of LOSVDs. ULySS determines the broadening relative to the SSP model dispersion , amounting to 13 km s-1 for the Pegase HR models. In addition, the instrumental dispersion of the spectrograph was taken into account by measuring FWHMs of emission lines in the arc lamp comparison spectra taken during the night in the same setup as the galaxies. Based on the average of several lines a final value of km s-1 was considered777. Final LOSVDs were ultimately computed via the relation: . The observed central velocity dispersions have been measured in the inner seeing-limited bin of each galaxy. This central aperture corresponds to different physical radii based on the distance of each galaxy. To account for this inconsistency, we applied an aperture correction, transforming the observed dispersions to a system that is independent of distance. For that purpose, the prescription has been applied, were is the central aperture and the effective radius (Jørgensen et al. 1995; Wegner et al. 1999). Table 2 shows the resulting, aperture corrected central velocity dispersions . The integrated velocity dispersions were used to correct the measured absorption indices for Doppler broadening. The studied FCGs exhibit an average central velocity dispersion of km s-1. Comparing this value with the LOSVDs of ellipticals from Bernardi et al. (2003c) shows that the investigated galaxies are among the most-massive ellipticals in the universe.
3.5 The fundamental plane
Elliptical galaxies show a tight relation between their effective radius , the mean effective surface brightness , and the central velocity dispersion known as the fundamental plane (FP) (Djorgovski & Davis 1987; Dressler et al. 1987): , with varying values of and by different authors (see Magoulas et al. 2012; Bernardi et al. 2003b). Since this fundamental plane spans about three orders of magnitude in luminosity, exhibiting very low residual scatter and little variation with environment, it suggests a uniform formation process of ellipticals. The FP can be reconstructed by means of the virial theorem which implies values of and and a constant mass-to-light ratio along the plane. However, observed values of and from a sample of 9000 SDSS early-type galaxies by Bernardi et al. (2003b) indicate a tilted plane that deviates from the virial prediction.
To study the location of the observed FCGs on the FP we modeled the SDSSIII DR9 surface brightness profiles with GALFIT888http://users.obs.carnegiescience.edu/peng/work/galfit/galfit.html by fitting a de Vaucouleurs (1948) law to the galaxy surface brightness distribution. Nearby stars were used to estimate the PSF and correct for seeing. By applying a de Vaucouleurs (1948) law, the mean effective surface brightness can be computed as (see Graham & Driver 2005). The measured surface brightness was corrected for cosmological dimming, extinction and correction, taken from the SDSS. Effective radii were corrected for ellipticity so that , where and are the semiminor and semimajor axes, respectively. As mentioned in Sect. 3.4 we applied an aperture correction to our central velocity dispersions. The same procedure was applied in Bernardi et al. (2003a) allowing us to directly compare our measurements with their work.
Figure 9 shows the observed FCGs on the fundamental plane from Bernardi et al. (2003b), obtained from early-type galaxies in the SDSS in the redshift range (solid line). The dotted lines present 3 deviations from the fit. All FCGs are located within these thresholds, following the SDSS fundamental plane. This result supports the idea that these objects are relaxed systems that had enough time to virialise. However, all galaxies are found below the FP, indicating that they are either more massive or more compact compared to the majority of ellipticals. Given that these galaxies are expected to have accumulated enough mass from galaxies of the progenitor group, it is plausible that the observed fossils show systematically higher masses compared to average ellipticals.

4 Discussion
Radial gradients of age, metallicity, and individual absorption line-strengths have been extensively studied in the past for several elliptical galaxies (Davies et al. 1993; Fisher et al. 1995; Sánchez-Blázquez et al. 2006; Reda et al. 2007; Annibali et al. 2007; Baes et al. 2007; Rawle et al. 2010; Loubser & Sánchez-Blázquez 2012, and references therein). These gradients are in general well fit by power-laws and their slopes provide useful constraints on the formation scenario of ellipticals. Following this approach, we have observed six fossil central ellipticals (FCGs) spectroscopically to study their stellar populations and measure age, metallicity, and line-strength gradients of the strongest absorption features to shed light on the formation and evolution of fossil systems. For that purpose we obtained medium-resolution long-slit spectra at the WHT and made use of the full-spectrum fitting package ULySS to fit SSP models to our data.
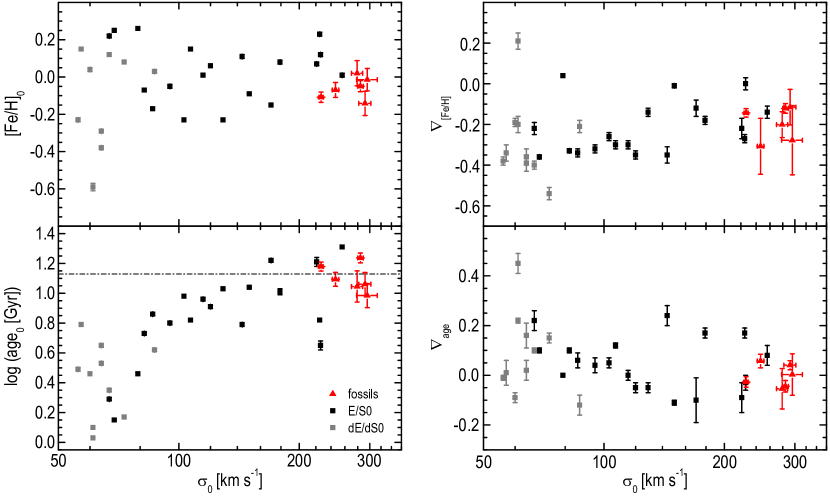
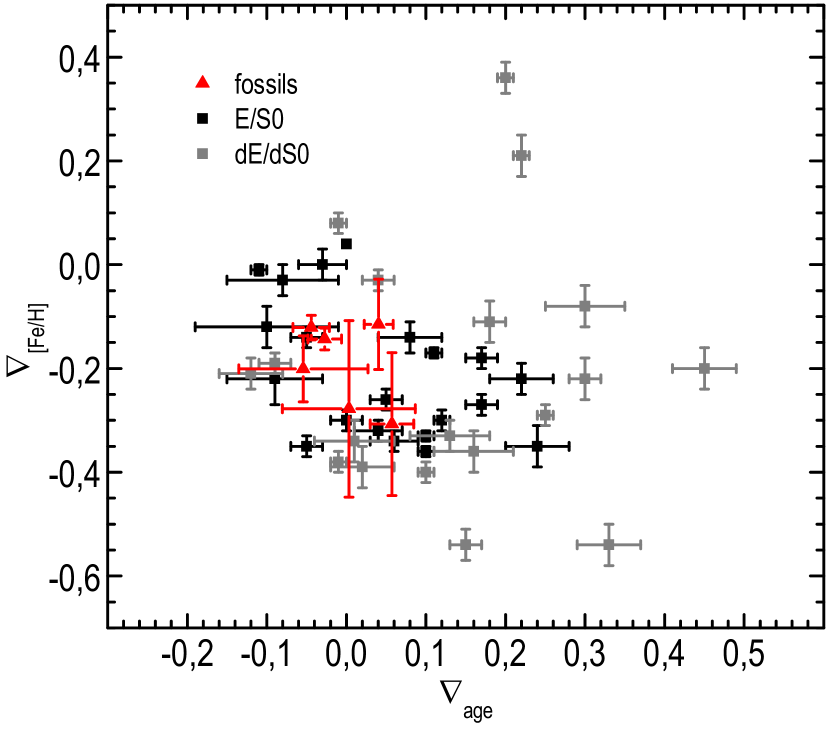
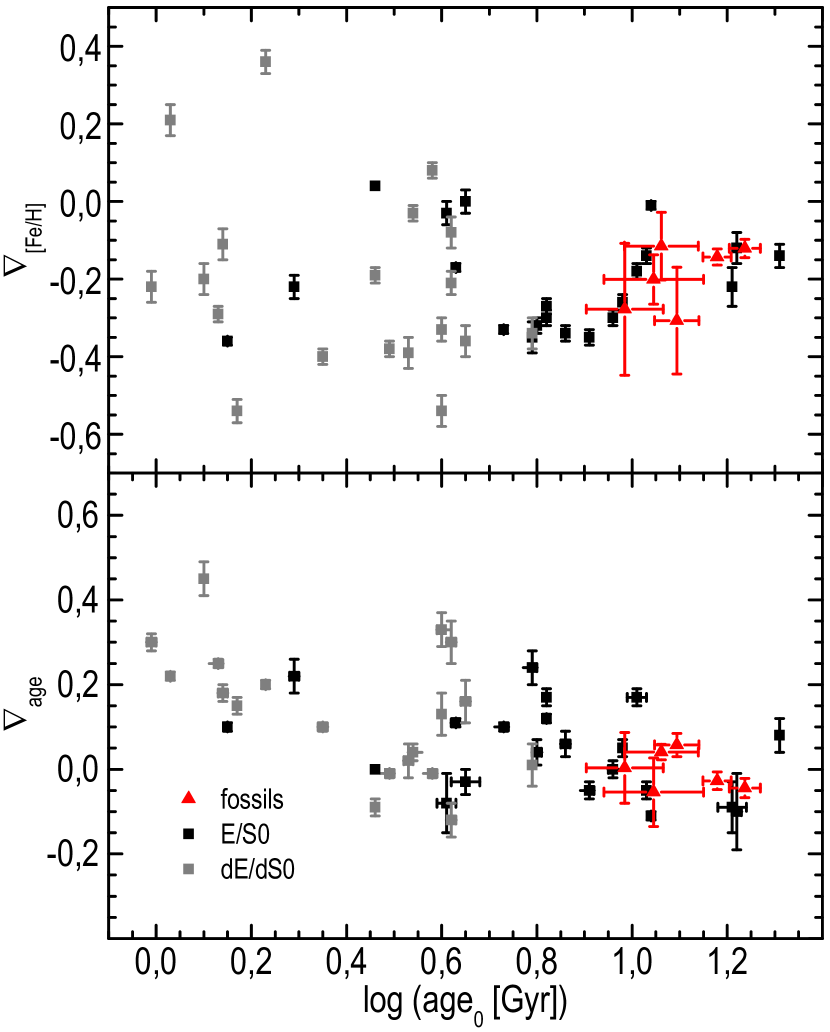
Figure 10 shows central velocity dispersions, ages, and metallicities of our FCGs (red triangles) in comparison with the sample of early-type galaxies presented in Koleva et al. (2011). Black squares are E and S0 galaxies in the Virgo and Fornax Clusters (see also Spolaor et al. 2009; Bedregal et al. 2006; Vazdekis et al. 2001) while grey symbols show early-type dwarfs from De Rijcke et al. (2005). The sample of Koleva et al. (2011) provides an ideal comparison for our measurements since it covers a broad range in galaxy mass and stellar populations are analysed as highlighted in this work, i.e. all galaxies are fit with Pegase HR models within ULySS. Exhibiting an average central velocity dispersion of km s-1, our sample comprises some of the most-massive ellipticals in the universe, populating the high end mass-regime of early-type galaxies. This is not surprising given the fact that all observed ellipticals are expected to be the remnants of the merger of multiple galaxies. The mass-metallicity relation is evident in Fig. 10, more massive galaxies retaining their metals much easier than less-massive ones. We find similar central metallicities around [Fe/H] for our fossils compared to the cluster ellipticals in Virgo and Fornax of similar mass. Central ages are old and exhibit an average value of Gyr. Except for one galaxy, all observed ellipticals exhibit SSP ages older than 10 Gyr indicating formation epochs at . RX J0752.7+4557 shows an intermediate age of Gyr suggesting a more extended star formation history to . This galaxy is also the only one in our sample with prominent nebular emission lines (see Fig. 1) and it was classified as AGN by multiple authors (Hess et al. 2012; Véron-Cetty & Véron 2010). Metallicity gradients in our sample are found to be throughout negative with an average slope of while age gradients are flat, scattering around . Figures 10 and 11 show that the observed gradients are similar to those of our control sample, suggesting that the physical processes involved in the formation of fossils do not differ systematically from those forming cluster ellipticals. The full-spectrum fitting technique applied here is a powerful tool in breaking the age-metallicity degeneracy of old stellar populations. However, to confirm our SSP fitting results, we also measured radial gradients for individual line-strengths. Metal-sensitive aborption features such as Mg2, Mg, Fe5270, Fe5335 all show negative radial gradients while the age-sensitive H index shows both positive and negative gradient slopes, scattering around a flat gradient. We compare our index gradients with those from Kobayashi & Arimoto (1999) and Rawle et al. (2010) and find similar gradient slopes. Only for Mg and Fe5335 we find gradients that are much steeper than in our comparison sample. From our index measurements we derive an average metallicity gradient of . This result is lower but consistent with the average gradient slope derived from full-spectrum fitting within the error bars. Individual gradient slopes are also consistent with the metallicity gradients derived from full-spectrum fitting within the corresponding error bars except for NGC1132, showing a systematically flatter gradient.
Two competing formation scenarios have been proposed for the formation of elliptical galaxies. Either ellipticals are formed monolithically by dissipational collapse of a pristine gas cloud (Larson 1974; Carlberg 1984) or hierarchically through successive mergers of disk galaxies or many dwarf galaxies (Kauffmann & White 1993). In the dissipative collapse model, gas gets continuosly enriched in the course of star-formation as it flows towards the galaxy centre, resulting in steep metallicity gradients. In this scenario gradient slopes have been predicted to be as steep as (Larson 1974), (Larson 1975), and (Carlberg 1984). Indeed, negative metallicity gradients, observed as radial gradients of absorption line-strengths, are a common feature in ellipticals, however exhibiting typically shallower slopes around . Monolithic collapse also predicts a strong correlation between galaxy mass and metallicity gradients since deeper potential wells retain more metals.
In the framework of hierarchical mass assembly, ellipticals are the results of galaxy mergers. White (1980) has shown that mergers flatten and erase the metallicity gradients of the progenitor galaxies due to orbital mixing of stars. Mihos & Hernquist (1994) modelled the merger of disk galaxies and concluded that pure stellar disks do not reproduce the power-law gradients observed in ellipticals unless a metal-rich starburst is involved. Kobayashi (2004) studied the evolution of metallicity gradients in the framework of CDM cosmology, in which the formation and evolution of ellipticals is expected to be driven by mergers. Allowing for various merging histories for ellipticals, ranging from quasi-monolithical collapse to multiple major mergers, Kobayashi (2004) found no correlation between gradient slopes and galaxy mass and stated that the variety of gradients originates in the different merging histories of ellipticals in the sense that galaxies that form monolithically have steeper gradients than galaxies resulting from major mergers. The change in gradient slope depends strongly on the mass ratio of the merging galaxies and the induced star formation during the merger. Typical gradients were found to be , for major mergers and , for non-major mergers. Simulating gas-rich disk galaxy mergers, Hopkins et al. (2009) also found that the amount of dissipation, characterizing the merger-induced starbursts involved during the merger, is the essential factor in determining the final gradient slopes. Di Matteo et al. (2009) investigated the shape of metallicity gradients resulting from dissipationless, (gas-free) dry mergers with the conclusion that the gradients strongly depend on the gradient shapes of the progenitor galaxies. Two galaxies with similar gradients will result in a flatter gradient in the final galaxy. However, the initial gradient can also be preserved or even increased by the merger if the slope of the companion galaxy is sufficiently steep.
The comparatively shallow metallicity gradients of our sample () with respect to the predicted gradients from monolithic collapse for the most-massive galaxies (; Carlberg 1984) suggest that major mergers have been involved in the formation of fossils, continuosly flattening initial gradients to the present day values. Especially when comparing our results with the simulated gradients in Kobayashi (2004), our gradients derived from both ULySS and lick indices match the distribution from major mergers whereas non-major mergers show much steeper gradients. Kobayashi (2004) argued that the spread in metallicity gradients and hence the formation of ellipticals cannot be explained by major mergers or monolithical collapse alone but both processes might be involved in shaping the final gradients in ellipticals. However, if fossils originate from an atypical, top-heavy luminosity function – the failed group scenario (Mulchaey & Zabludoff 1999), with the magnitude gap being in place a priori, i.e. the central elliptical formed monolithically, no galaxies would have been present to allow for subsequent major mergers after an initial monolithic collapse and we would expect to observe much steeper gradients. Hence we conclude that fossils are not failed groups but indeed formed through successive major mergers of galaxies.
Spolaor et al. (2009) also found that massive galaxies with show in general flatter gradients than low-mass galaxies, but exhibit a much larger scatter in gradient slopes. The flatter gradients were also attributed to galaxy mergers which should be the driving process in building up galaxies above this mass limit. The large scatter in gradient strengths was interpreted to be the consequence of various merging histories with different amounts of gas involved during the mergers. The fossil gradients in this work do not show a large spread in gradient slopes suggesting similar merging histories. Figures 11 and 12 show trends between gradient strength and central age for the Virgo and Fornax early-type galaxies. There also seems to be a slight trend between age and metallicity gradients, steeper negative metallicity gradients showing more positve age gradients. All observed fossils fall on these relations. However, because of the low-number statistics of our sample it is impossible to conclude if fossils systematically follow these trends. We also compared our fossils to the FP of Bernardi et al. (2003b) and conclude that our sample follows their FP within confidence intervals, indicating that they are dynamically relaxed systems, at least in their central parts (Méndez-Abreu et al. 2012). Interestingly, all our galaxies fall below the FP, suggesting that they are either too compact for given surface brightness and velocity dispersion or that they are too massive for a given effective radius. The latter seems very plausible since these galaxies are expected to constitute the mass of several galaxies.
5 Conclusion
We observed spatially resolved stellar population parameters in a sample of fossil ellipticals. Exhibiting an average central velocity dispersion of km s-1, our sample comprises some of the most massive galaxies in the universe, expected for the remnants of multiple mergers of galaxies. We find comparatively flat () metallicity gradients that suggest a hierarchical merger scenario for fossils. If fossils were failed groups, arising from an atypical luminosity function where the gap was in place a priori, then FCGs would have formed monolithically, not experiencing any major mergers during their evolution due to the absence of galaxies. Models of monolithic collapse predict steep metallicity gradients () in such a formation scenario especially for massive galaxies. Such steep gradients are not observed in this work. Hence we conclude that the observed fossils indeed formed through major mergers of galaxies. The low scatter of gradient slopes suggests a similar merging history for all galaxies in our sample. Our observations clearly suffer from low-number statistics and a much larger sample of FCGs will be needed to systematically quantify spatially resolved stellar population parameters in these galaxies. Measurements of a larger sample will then help to probe the uniformity of the formation of these systems.
Acknowledgements.
This work is based on observations made with the William Herschel Telescope (WHT) operated on the island of La Palma by the Isaac Newton Group (ING) in the Spanish Observatorio del Roque de los Muchachos of the Instituto de Astrofísica de Canarias. We have made use of the astronomical data reduction software IRAF which is distributed by the National Optical Astronomy Observatories, which are operated by the Association of Universities for Research in Astronomy Inc., under cooperative agreement with the National Science Foundation. The publication was supported by the Austrian Science Fund (FWF). PE was supported by the University of Vienna in the frame of the Initiative Kolleg (IK) The Cosmic Matter Circuit I033-N and acknowledges support from FONDECYT through grant 3130485. We thank Mina Koleva, Robert Proctor, Claudia Mendes de Oliveira, Christoph Saulder and Bodo Ziegler for useful discussions. We also thank the anonymous referee who read the manuscript carefully and helped to improve the presentation of the paper.References
- Annibali et al. (2007) Annibali, F. et al. 2007, A&A, 463, 455
- Baes et al. (2007) Baes, M. et al. 2007, A&A, 467, 991
- Barnes (1989) Barnes, J. E. 1989, Nature, 338, 123
- Bedregal et al. (2006) Bedregal, A. G. et al. 2006, MNRAS, 371, 1912
- Bekki & Shioya (1999) Bekki, K., Shioya, Y. 1999, ApJ, 513, 108
- Bernardi et al. (2003a) Bernardi, M. et al. 2003a, AJ, 125, 1817
- Bernardi et al. (2003b) Bernardi, M. et al. 2003b, AJ, 125, 1866
- Bernardi et al. (2003c) Bernardi, M. et al. 2003c, AJ, 125, 1882
- Bernardi et al. (2011) Bernardi, M. et al. 2011, MNRAS, 412, 6
- Burstein et al. (1984) Burstein, D. et al. 1984, ApJ, 287, 586
- Cardiel (2007) Cardiel, N. 2007, in Highlights of Spanish Astrophysics IV
- Carlberg (1984) Carlberg, R. G. 1984, ApJ, 286, 403
- Cypriano et al. (2006) Cypriano, E. S. et al. 2006, AJ, 132, 514
- Dariush et al. (2007) Dariush, A. et al. 2007, MNRAS, 382, 433
- Davies et al. (1993) Davies, R. L. et al. 1993, MNRAS, 262, 650
- de la Rosa et al. (2007) de la Rosa, I. G. et al. 2007, AJ, 133, 330
- De Rijcke et al. (2005) De Rijcke, S. et al. 2005, A&A, 438, 491
- de Vaucouleurs (1948) de Vaucouleurs, G. 1948, AnAp, 11, 247
- Díaz-Giménez et al. (2008) Díaz-Giménez, E., Muriel, H., & Mendes de Oliveira, C. 2008, A&A, 490, 965
- Di Matteo et al. (2009) Di Matteo, P. et al. 2009, A&A, 499, 427
- D’Onghia et al. (2005) D’Onghia, E. et al. 2005, ApJ, 630, 109
- Djorgovski & Davis (1987) Djorgovski, S., Davis, M. 1987, ApJ, 313, 59
- Dressler et al. (1987) Dressler, A. et al. 1987, ApJ, 313, 42
- Eigenthaler & Zeilinger (2009) Eigenthaler, P., Zeilinger, W. W. 2009, AN, 330, 978
- Eigenthaler & Zeilinger (2012) Eigenthaler, P., Zeilinger, W. W. 2012, A&A, 540, A134
- Fisher et al. (1995) Fisher, D., Franx, M., Illingworth, G. 1995, ApJ, 448, 119
- Graham & Driver (2005) Graham, A. W., Driver, S. P. 2005, PASA, 22, 118
- Hess et al. (2012) Hess, K. M., Wilcots, E. M., Hartwick, V. L. 2012, AJ, 144, 48
- Hopkins et al. (2008) Hopkins, P. F. et al. 2008, ApJ, 689, 17
- Hopkins et al. (2009) Hopkins, P. F. et al. 2009, ApJS, 181, 135
- Horne (1986) Horne, K. 1986, PASP, 98, 609
- Jones et al. (2003) Jones, L. R. et al. 2003, MNRAS, 343, 627
- Jørgensen et al. (1995) Jørgensen, I., Franx, M., Kjaergaard, P. 1995, MNRAS, 276, 1341
- Kauffmann & White (1993) Kauffmann, G., White, S. D. M. 1993, MNRAS, 261, 921
- Khochfar & Burkert (2005) Khochfar, S., Burkert, A. 2005, MNRAS, 359, 1379
- Kobayashi & Arimoto (1999) Kobayashi, C., & Arimoto, N. 1999, ApJ, 527, 573
- Khosroshahi et al. (2004) Khosroshahi, H. G. et al. 2004, MNRAS, 349, 1240
- Khosroshahi et al. (2006) Khosroshahi, H. G. et al. 2006, MNRAS, 372, 68
- Khosroshahi et al. (2007) Khosroshahi, H. G. et al. 2007, MNRAS, 377, 595
- Kobayashi (2004) Kobayashi, C. 2004, MNRAS, 347, 740
- Koleva et al. (2009) Koleva, M. et al. 2009, A&A, 501, 1269
- Koleva et al. (2011) Koleva, M. et al. 2011, MNRAS, 417, 1643
- La Barbera et al. (2009) La Barbera, F. et al. 2009, AJ, 137, 3942
- Larson (1974) Larson, R. B. 1974, MNRAS, 166, 585
- Larson (1975) Larson, R. B. 1975, MNRAS, 173, 671
- Le Borgne et al. (2004) Le Borgne, D. et al. 2004, A&A, 425, 881
- Loubser & Sánchez-Blázquez (2012) Loubser, S. I., & Sánchez-Blázquez, P. 2012, MNRAS, 425, 841
- Magoulas et al. (2012) Magoulas, C. et al. 2012, MNRAS, 427, 245
- Méndez-Abreu et al. (2012) Méndez-Abreu, J. et al. 2012, A&A, 537, A25
- Mendes de Oliveira et al. (2006) Mendes de Oliveira, C. et al. 2006, AJ, 131, 158
- Mendes de Oliveira et al. (2009) Mendes de Oliveira, C. et al. 2009, AJ, 138, 502
- Mihos & Hernquist (1994) Mihos, J. C., Hernquist, L. 1994, ApJ, 427, 112
- Miller et al. (2012) Miller, E. D., Rykoff, E., Dupke, R. et al. 2012, ApJ, 747, 94
- Mulchaey & Zabludoff (1999) Mulchaey, J. S., & Zabludoff, A. I. 1999, ApJ, 514, 133
- Pierini et al. (2011) Pierini, D. et al. 2011, MNRAS, 417, 2927
- Ponman et al. (1994) Ponman, T. J. et al. 1994, Nature, 369, 462
- Proctor et al. (2004) Proctor, R. et al. 2004, MNRAS, 349, 1381
- Proctor et al. (2011) Proctor, R. et al. 2011, MNRAS, 418, 2054
- Prugniel & Soubiran (2001) Prugniel, P., Soubiran, C. 2001, A&A, 369, 1048
- Rawle et al. (2010) Rawle, T. D., Smith, R. J., Lucey, J. R. 2010, MNRAS, 401, 852
- Reda et al. (2007) Reda, F. M. et al. 2007, MNRAS, 377, 1772
- Sánchez-Blázquez et al. (2006) Sánchez-Blázquez, P., Gorgas, J., Cardiel, N. 2006, A&A, 457, 823
- Santos et al. (2007) Santos, W.A. et al. 2007, AJ, 134, 1551
- Schirmer et al. (2010) Schirmer, M. et al. 2010, A&A, 514, 60
- Spolaor et al. (2009) Spolaor, M. et al. 2009, ApJ, 691, 138
- Springel et al. (2005) Springel, V. et al. 2005, Nature, 435, 629
- Stetson (1989) Stetson, P. B. 1989, HiA, 8, 635
- Sun et al. (2004) Sun, M. et al. 2004, ApJ, 612, 805
- Ulmer et al. (2005) Ulmer, M. P. et al. 2005, ApJ, 624, 124
- Vazdekis et al. (2001) Vazdekis, A. et al. 2001, ApJ, 551, 127
- Véron-Cetty & Véron (2010) Véron-Cetty, M. P., Véron, P. 2010, A&A, 518, A10
- Vikhlinin et al. (1999) Vikhlinin, A. et al. 1999, ApJ, 520, 1
- Wegner et al. (1999) Wegner, G. et al. 1999, MNRAS, 305, 259
- White (1980) White, S. D. M. 1980, MNRAS, 191, 1
- Worthey (1994) Worthey, G. 1994, ApJS, 95, 107
- Worthey et al. (1994) Worthey, G. et al. 1994, ApJS, 94, 687
- Worthey & Ottaviani (1997) Worthey, G., Ottaviani, D. L. 1997, ApJS, 111, 377
- Worthey (1999) Worthey, G. 1999, ASPC, 192, 283
- Yoshioka et al. (2004) Yoshioka, T. et al. 2004, AdSpR, 34, 2525