MOLECULAR LINE EMISSION FROM A PROTOPLANETARY DISK IRRADIATED EXTERNALLY BY A NEARBY MASSIVE STAR
Abstract
Star formation often occurs within or nearby stellar clusters. Irradiation by nearby massive stars can photoevaporate protoplanetary disks around young stars (so-called proplyds) which raises questions regarding the ability of planet formation to take place in these environments. We investigate the two-dimensional physical and chemical structure of a protoplanetary disk surrounding a low-mass (T Tauri) star which is irradiated by a nearby massive O-type star to determine the survivability and observability of molecules in proplyds. Compared with an isolated star-disk system, the gas temperature ranges from a factor of a few (in the disk midplane) to around two orders of magnitude (in the disk surface) higher in the irradiated disk. Although the UV flux in the outer disk, in particular, is several orders of magnitude higher, the surface density of the disk is sufficient for effective shielding of the disk midplane so that the disk remains predominantly molecular in nature. We also find that non-volatile molecules, such as HCN and H2O, are able to freeze out onto dust grains in the disk midplane so that the formation of icy planetesimals, e.g., comets, may also be possible in proplyds. We have calculated the molecular line emission from the disk assuming LTE and determined that multiple transitions of atomic carbon, CO (and isotopologues, 13CO and C18O), HCO+, CN, and HCN may be observable with ALMA, allowing characterization of the gas column density, temperature, and optical depth in proplyds at the distance of Orion (400 pc).
1 INTRODUCTION
Star formation rarely takes place in isolation; stars form primarily within multiple systems and often within, or nearby, massive stellar clusters (see, e.g., Kennicutt & Evans, 2012). Thus, the young star’s protoplanetary disk can be heavily irradiated and indeed, photoevaporated, by nearby massive stars (see, e.g., Bally et al., 1998), for example, the famous proplyds in the Orion nebula (O’Dell et al., 1993). The properties of proplyds have been well studied since their discovery; however, little is known about their molecular content due to their small size ( 100–1000 AU) and relatively large distance, e.g., Orion at 400 pc. Protoplanetary disks are the sites of planet formation and the study of disks in extreme environments is important for a complete understanding of this process. Can the disk survive sufficiently long for planet formation to take place? This has implications on our understanding of the formation of our own solar system as it is thought that the Sun formed within a stellar cluster which has long since dispersed (see, e.g., Adams, 2010, and references therein).
We calculate the chemical structure and molecular line emission from a protoplanetary disk around a classical T Tauri star which is irradiated by a nearby (0.1 pc) massive O-type star. Our aims are (1) to determine whether molecules are able to form and survive in the disk, (2) to identify species which may be observable with ALMA, and (3) to identify species which can characterize the physical conditions and the subsequent implications on planet formation.
2 PROTOPLANETARY DISK MODEL
2.1 Physical Model
We model a steady axisymmetric disk in Keplerian rotation about a classical T Tauri star with mass 0.5 , radius 2 , effective temperature 4000 K, and = 0.01, using the methods outlined in Nomura & Millar (2005) and Nomura et al. (2007). The radial surface density distribution is determined assuming a constant mass accretion rate, = 10-8 yr-1 (Pringle, 1981). To determine the density and temperature structure, we solve the equation of hydrostatic equilibrium in the vertical direction and the local thermal balance between the heating and cooling of the gas. We include grain photoelectric heating by UV photons and heating via hydrogen ionization by X-rays and allow the gas to cool via gas–grain collisions and line transitions.
Our disk is irradiated by UV photons and X-rays from the central star and UV photons from the interstellar radiation field and a nearby massive O-type star. We model the UV spectrum of the O-type star as a blackbody with an effective temperature of 45,000 K. We set the UV flux at the disk surface to (4 105) , where 1.6 10-3 erg cm-2 s-1 is the average strength of the integrated interstellar radiation field. This corresponds to a distance between the disk and the massive star of 0.1 pc.
We assume the dust and the gas in the disk are well mixed and adopt a dust-grain size distribution which reproduces the extinction curve observed in dense clouds (Weingartner & Draine, 2001). We note that this is a simplistic treatment of the dust distribution in disks since it is thought that gravitational dust settling and coagulation perturb the dust size and density distribution from that observed in dense clouds (see, e.g., Dullemond & Dominik, 2004; D’Alessio et al., 2006).
2.2 Chemical Model
We use the gas–grain chemical network from Walsh et al. (2010) and compute the photoreaction rates and X-ray ionization rates using the methods outlined in Walsh et al. (2012). Our gas-phase chemistry is from the UMIST Database for Astrochemistry (Woodall et al., 2007). We include freezeout of gas-phase material onto dust grains and thermal and non-thermal desorption. We allow photodesorption by both external and internal UV photons and desorption via cosmic-ray heating of dust grains (Hasegawa & Herbst, 1993; Öberg et al., 2009a, b). We use a small grain-surface network to include the synthesis of several complex organic molecules, e.g., methanol (Hasegawa et al., 1992; Hasegawa & Herbst, 1993). We include the photodestruction of grain mantle material by UV photons, X-rays, and cosmic rays (Ruffle & Herbst, 2001). Experiments have shown that the irradiation of interstellar ice analogs by UV and X-ray photons induces chemistry in the ice (see, e.g., Hagen et al., 1979; D’Hendecourt et al., 1986; Allamandola et al, 1988; Öberg et al., 2010b; Ciaravella et al., 2010). We adopt the equivalent gas-phase photorates for ice species and allow the products to remain on the grain to take part in further grain-surface reactions.
We assume the grains are negatively charged compact spheres with a radius of 0.1 m and a constant fractional abundance of 10-12 relative to the gas number density, equivalent to a gas-to-dust mass ratio of 100. We adopt a sticking coefficient, 1, for all species. We include the dissociative recombination of gas-phase cations with dust grains. The dust model used for the chemistry is simple compared with that used to calculate the disk physical structure; however, the total dust-grain cross section is consistent between models.
Our initial abundances are from the output of a dark cloud model at an age of 105 yr. Our underlying elemental abundance ratios for H:He:C:N:O:Na:Mg:Si:S:Cl:Fe are 1.00:0.14:7.30(–5):2.14(–5):1.76(–4):3.00(–9):3.00(–9):3.00(–9):2.00(–8):3.00(–9):3.00(–9). We map the chemical structure of the disk at a time of yr, the typical age of classical T Tauri stars.
2.3 Molecular Line Emission
To estimate the molecular line emission, we assume the disk is “face on” and that local thermodynamic equilibrium (LTE) holds throughout. We calculate the emergent flux from the top (i.e., visible) half of the disk only which we also assume is the surface directly irradiated by the nearby massive star. In reality, the lower half, although not directly irradiated by the nearby star, is subject to diffuse, scattered UV radiation originating from the stellar cluster, and this needs to be taken into account in the calculation of the physical structure of the lower disk. Hence, our estimated molecular line emission strengths are lower limits to the potentially observable line strengths. We include only thermal broadening of the line profiles because this will dominate turbulent broadening. For CO isotopologues, we assume the molecular isotopic ratios reflect the atomic ratios and use values applicable for the local interstellar medium: 13C/12C = 1/77 and 18O/16O = 1/560 (Wilson & Rood, 1994).
3 RESULTS
3.1 Physical Structure
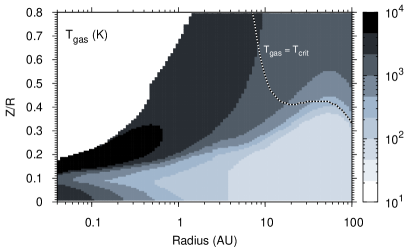
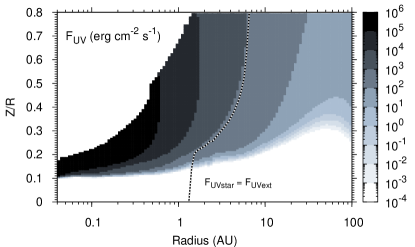
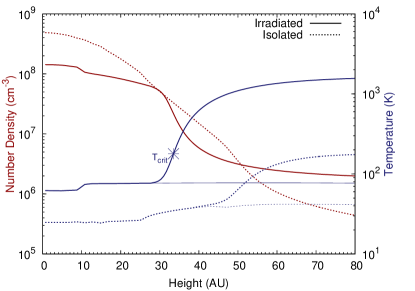
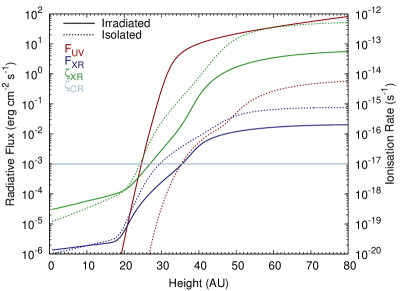
In Figure 1, we present the gas temperature, number density, integrated UV flux, and integrated X-ray flux as a function of disk radius, , and height, . We also display these parameters, along with the cosmic-ray and X-ray ionization rates, as a function of height at = 100 AU. We compare results from our irradiated disk (solid lines) and isolated disk (dashed lines; see Walsh et al., 2012). Here, “irradiated” refers to a disk irradiated by a nearby massive star and the central star, whereas, “isolated” refers to a disk irradiated by the central star only.
Compared with the isolated disk, the gas and dust temperatures in the irradiated disk are significantly higher in the outer disk midplane ( 1 AU). The gas temperature structure in the innermost region, 1 AU, is similar in both disks because this is driven by irradiation by the central star. The density structure is also perturbed, depending on the gas temperature profile.
In the surface at 100 AU, we see around an order of magnitude decrease in the X-ray flux and subsequent ionization rate in the irradiated model, compared with the isolated model. This is due to the differing attenuation of X-rays along the line of sight from the central star, which is affected by the density and gas temperature profile in the disk. In the disk midplane, the X-ray flux (and ionization rate) is similar in both models. We see a large increase in the UV flux in the disk surface, increasing from a value of 1 erg cm-2 s-1 in the isolated case to 100 erg cm-2 s-1 in the irradiated case at = 100 AU. The surface density in the irradiated disk is sufficient for the disk midplane to remain effectively shielded from all sources of UV irradiation.
3.2 Chemical Structure
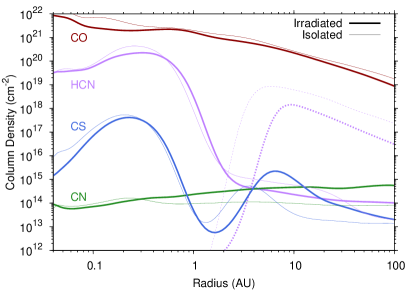
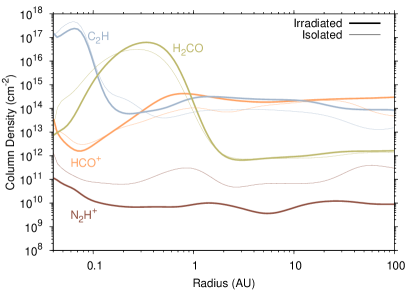
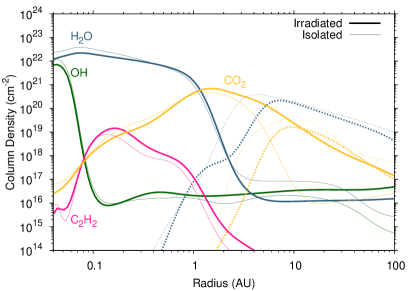
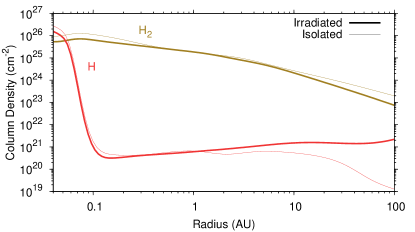
In Figure 2, we present the fractional abundance (relative to number density) of gas-phase CO, HCO+, CN, HCN, C2H, CS, H2CO and N2H+ as a function of disk radius, , and height, /. These species have been detected in numerous nearby gas-rich primordial isolated protoplanetary disks due their relatively large abundance and simple rotational spectra leading to strong emission lines (see, e.g., Thi et al., 2004; Dutrey et al., 2007; Henning et al., 2010; Öberg et al., 2010a; Dutrey et al., 2011). In Figure 3, we present the vertical column densities as a function of disk radius, . We have smoothed the column densities using a Bézier function of index, , where is the number of data points. We also present the column densities for those additional species observed in protoplanetary disks in absorption and/or emission at infrared wavelengths: OH, H2O, C2H2, and CO2 (bottom, see, e.g., Lahuis et al., 2006; Carr & Najita, 2008; Mandell et al., 2012). We also show the grain-surface column densities (dashed lines) for species which exhibit significant freezeout. In Table 1, we list the calculated column densities at radii of 10 AU and 100 AU.
We see a different chemical stratification in the irradiated disk, compared with the isolated disk. The higher dust temperature in the disk midplane allows volatile molecules, such as CO, to remain in the gas, whereas tightly bound molecules, such as HCN, freeze onto grain surfaces. Instead of the usual “warm molecular layer” observed between 0.3 0.5, we see a thinner molecular layer which is deeper in the disk and abundant in radicals, e.g., CN, C2H, and CS, and molecules. HCO+ resides in a layer slightly higher than the “molecule/radical” layer reflecting the abundance of proton-donating molecules, such as, H3+ and H3O+.
Gas-phase CO possesses its canonical fractional abundance of 10-4 throughout the disk midplane and also survives in the disk surface beyond 10 AU with a fractional abundance, 10-7. Thus, the disk remains significantly molecular in nature, even under extreme irradiation. We see hints of the truncation of the molecular disk beyond 50 AU. Here, we have assumed hydrostatic equilibrium, whereas, in reality, photoevaporative flow may affect the surface density of the outer disk. The disk truncation radius depends primarily on the scale of the flow (see, e.g., Adams et al., 2004).
HCN is depleted in the disk midplane due to freezeout and reaches a fractional abundance of 10-7 in the “molecule/radical” layer beyond = 1 AU. Within this radius, thermal desorption from dust grains increases the fractional abundance to 10-4. HCO+ and CN both reach a fractional abundance of 10-6, whereas C2H and CS reach a value of 10-7. H2CO and N2H+ reach lower peak values of 10-8 and 10-9, respectively. N2H+ reaches this value within a radius 1 AU only.
Comparing column densities at 10 AU, there are minor differences between models (less than a factor of three) for most species. However, in the irradiated disk, the CN, CS, and CO2 column densities are larger, by factors of 4.7, 44, and 1800, respectively, and those for N2H+, H2O, and C2H2, are smaller, by factors of 9.6, 7.0, and 9.6, respectively. The CN/HCN, OH/H2O, C2H/C2H2 column density ratios are also larger in the irradiated disk, 1.9, 2.9, and 8.2 versus 0.16, 0.26, and 0.29, respectively, indicative of increased photodissociation of HCN, H2O, and C2H2. Both models exhibit peaks in the CS column density where the dust temperatures are comparable (10 AU in the irradiated disk and 4-5 AU in the isolated disk.) Hence, freezeout onto dust grains accounts for the difference in the CS column densities at 10 AU. The CO2 column density is significantly larger in the irradiated disk 2 1019 cm-2 versus 1016 cm-2. In the isolated disk, the snow line for CO2 lies within 10 AU; however, in the irradiated disk, the temperature in the midplane at 10 AU, and beyond, is high enough for CO2 to possess a significant gas-phase abundance.
At 100 AU, the effects of external irradiation are clear. The H/H2 column density ratio is much larger in the irradiated disk, 2.9 10-2 versus 6.5 10-5 for the isolated disk. The OH/H2O and C2H/C2H2 column density ratios are also larger, 3.3 and 7.0 versus 0.20 and 0.47, respectively. The OH and H2O column densities also increase significantly in the irradiated disk, by factors of 94 and 5.8, respectively. OH and H2O can form efficiently in warm/hot gas ( 200 K) via the reactions, H2 + O and H2 + OH (Glassgold et al., 2009). The HCO+ column density is a factor of 6.3 larger in the irradiated disk, tracing the increased ionization degree. We see only minor differences in the column densities of all other species, except CO2 (already discussed) and N2H+, the latter of which is a factor of 35 smaller in the irradiated disk, at 100 AU. N2H+ is destroyed via reactions with CO and electrons. The CO abundance in both models is similar; however, the electron abundance in the molecular layer of the irradiated model is several orders of magnitude higher so that N2H+ destruction via dissociative recombination is more effective in this model.
The best astrophysical analog of our isolated disk model is TW Hya. We achieve good agreement with the disk-averaged abundance ratios for CN/HCN derived by Thi et al. (2004, 7.1 versus 3.8 in our model) and the fractional abundance of water vapor determined by Hogerheijde et al. (2011, 5-20 10-8 versus 1-3 10-8). Adjusting for source size and distance, we achieve reasonable agreement with H2CO line strengths observed by Qi et al. (2013): 1.22 and 0.54 Jy km s-1 versus 0.65 and 0.82 Jy km s-1 from our model for the 414–313 and 515–414 transitions, respectively (C. Walsh et al., in preparation). We get poor agreement for the HCO+/CO ratio from Thi et al. (2004, 1.4 10-4 versus 2.5 10-6) and our N2H+ line strengths are around an order of magnitude lower than that observed. The truncation of our disk at 100 AU means we do not account for the depletion of CO onto dust grains at larger radii where 20 K. As discussed previously, N2H+ is destroyed via reaction with CO.
3.3 Molecular Line Emission
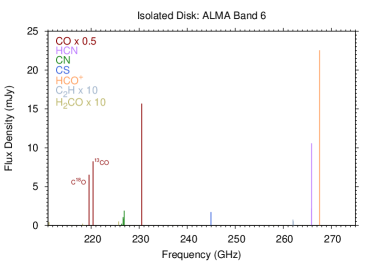
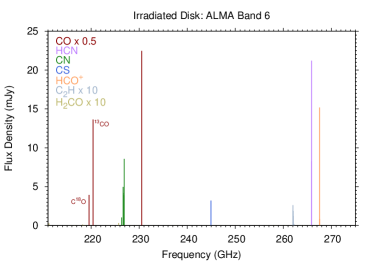
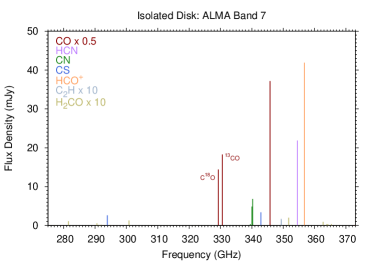
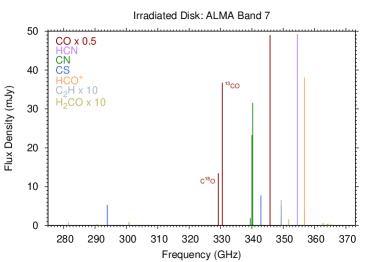
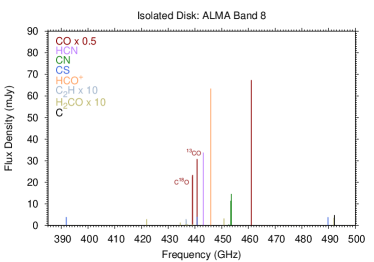
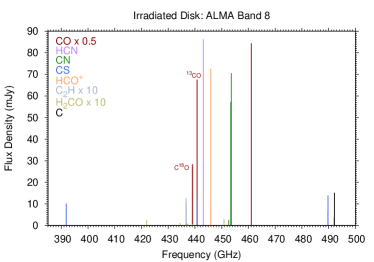
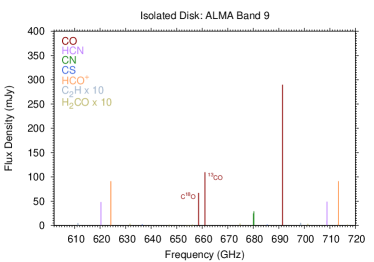
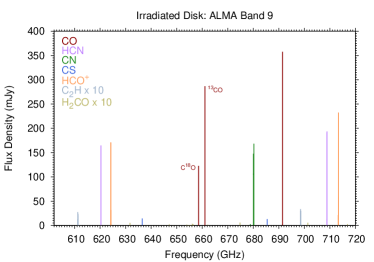
In Figure 4, we present our synthetic line spectra in ALMA receiver bands 6–9. We assume a maximum disk radius of 100 AU and a distance to source of 400 pc. The lines in bands 3 and 4 are likely too weak to be observable and observations in band 10 are difficult due to increased atmospheric absorption at higher frequencies. Due primarily to the higher gas temperature, the emission lines from the irradiated disk reach higher peak values than the equivalent lines from the isolated disk. This is most notable for C, CO (and isotopologues), CN, CS, and HCN. The HCO+ transitions in bands 6 and 7 reach higher peak flux densities in the isolated disk and are also much stronger than those for HCN, despite both molecules possessing similar rotational spectra. HCO+ is a tracer of cold, dense material and is generally more abundant than HCN in the outer disk midplane.
In Table 1, we list the transitions, frequencies, and integrated line intensities. Due to the higher gas temperature in the irradiated disk (50 K), lower frequency transitions ( 100 GHz) are weaker than higher frequency transitions and the integrated line strengths are stronger than those for the isolated disk. A significant proportion of the CO,13CO, and C18O ladders should be observable with ALMA advantageously allowing characterization of the gas excitation temperature, column density, and optical depth (see, e.g., Bruderer et al., 2012). Multiple transitions of CI, HCO+, HCN, and CN may also be observable allowing additional characterization of the physical conditions. The CN/HCN and CI/CO line ratios and derived column densities would also allow a measurement of the degree of photodestruction in the disk. The remaining molecules would be difficult to observe; however, CS and C2H may be observable in larger, more massive, proplyds (100 AU 400 AU).
4 DISCUSSION
Proplyds have been extensively studied since their discovery (see, e.g., O’Dell et al., 1993; Bally et al., 1998), and were originally observed in silhouette against the bright nebular background. Early models concentrated on characterizing physical properties: morphology, surface density, mass, dust distribution, mass-loss rates, and lifetime (see, e.g., Johnstone et al., 1998; Störzer & Hollenbach, 1999; Richling & Yorke, 2000; Adams et al., 2004; Clarke, 2007). Models generally agree that the disk survives for a few Myr, beyond which, photoevaporation destroys the disk on a timescale 105 yr, depending on the distance from the massive star. In Figure 1, we identify the region where the gas temperature equals the critical temperature for photoevaporation, i.e., where the photoevaporative flow likely originates. According to Dullemond et al. (2007), 0.2 , where is the temperature at which the sound speed equals the escape velocity of the gas. Several groups (e.g., Adams et al., 2004) model the disk as a photon-dominated region (PDR) including a small chemical network for the computation of the thermal balance and do not report the molecular structure beyond the transition from atomic to molecular hydrogen. Other authors report chemical structure calculations and resulting line emission; however, this has been restricted to ionic and atomic lines (see, e.g., Richling & Yorke, 2000). Nguyen et al. (2002) studied the chemistry in irradiated disks around high-mass and low-mass stars, modeling the disk structure as a series of one-dimensional vertical PDRs. They categorize “observable” molecules as those possessing a value 10 12 cm-2. In their low-mass model, their column densities for HCN, H2CO, H2O, and C2H are larger than ours by more than an order of magnitude despite both models generating similar CO column densities. We find the opposite case for HCO+ and CN. These differences likely arise from different prescriptions for the disk structure: we perform a self-consistent calculation of the physical structure, whereas Nguyen et al. (2002) adopt assumed conditions. Our work highlights the importance of radiative transfer calculations in determining the potential observability of molecules, rather than relying on column density calculations.
Here, we report the results of a self-consistent two-dimensional model of the physical and chemical structure of a protoplanetary disk irradiated by a nearby massive star. The disk remains predominantly molecular in nature over the lifetime of the disk (106 yr) with potentially observable abundances of atoms and molecules (CI, CO, HCO+, CN, and HCN) at (sub)mm wavelengths. The disk midplane is effectively shielded from UV radiation such that non-volatile molecules, e.g., HCN and H2O, are frozen out onto dust grains suggesting icy planetesimal formation may be possible in proplyds. Observations of multiple transitions of these species (and isotopologues) would allow characterization of the gas surface density, excitation temperature, and optical depth. As far as we are aware, the work reported here is the first attempt to model the two-dimensional molecular structure and resultant (sub)mm molecular line emission of a proplyd.
References
- Adams (2010) Adams, F. C. 2010, ARA&A, 48, 47
- Adams et al. (2004) Adams, F. C., Hollenbach, D., Laughlin, G., & Gorti, U. 2004, ApJ, 611, 360
- Allamandola et al (1988) Allamandola, L. J., Sandford, S. A., & Valero, G. J. 1988, Icar, 76, 225
- Bally et al. (1998) Bally, J., Sutherland, R. S., Devine, D., & Johnstone, D. 1998, AJ, 116, 293
- Bruderer et al. (2012) Bruderer, S., van Dishoeck, E. F., Doty, S. D., & Herczeg, G. J. 2012, A&A, 541, A91
- Carr & Najita (2008) Carr, J. S. & Najita, J. R. 2008, Sci, 319, 1504
- Ciaravella et al. (2010) Ciaravella, A., Mũnoz Caro, G., Jiménez Escobar, A., et al. 2010, ApJL, 722, L45
- Clarke (2007) Clarke, C. J. 2007, MNRAS, 376, 1350
- D’Alessio et al. (2006) D’Alessio, P., Calvet, N., Hartmann, L., Franco-Hernández, R., & Servín, H. 2006, ApJ, 638, 314
- D’Hendecourt et al. (1986) D’Hendecourt, L. B., Allamandola, L. J., Grim. R. J. A., & Greenberg, J. M. 1986 A&A, 158 119
- Dullemond & Dominik (2004) Dullemond, C. P. & Dominik, C. 2004, A&A, 421, 1075
- Dullemond et al. (2007) Dullemond, C. P., Hollenbach, D., Kamp, I., & D’Alessio, P. 2007, in Protostars and Planets V, ed. B. Reipurth, D. Jewitt, K. Keil (Tucson, AZ: Univ. Arizona Press), 555
- Dutrey et al. (2007) Dutrey, A., Henning, T., Guilloteau, S., et al. 2007, A&A, 464, 615
- Dutrey et al. (2011) Dutrey, A., Wakelam, V., Boehler, Y., et al. 2011, A&A, 535, A104
- Glassgold et al. (2009) Glassgold, A. E., Meijerink, R., & Najita, J. R. 2009, ApJ, 701, 142
- Hagen et al. (1979) Hagen, W., Allamandola, L. J., & Greenberg, J. M. 1979, Ap&SS, 65, 215
- Hasegawa & Herbst (1993) Hasegawa, T. I. & Herbst, E. 1993, MNRAS, 261, 83
- Hasegawa et al. (1992) Hasegawa, T. I., Herbst, E., & Leung, C. M. 1992, ApJS, 82, 167
- Henning et al. (2010) Henning, Th., Semenov, D., Guilloteau, St., et al. 2010, ApJ, 714, 1511
- Hogerheijde et al. (2011) Hogerheijde, M. R., Bergin, E. A., Brinch, C., et al. 2011, Sci, 334, 338
- Johnstone et al. (1998) Johnstone, D., Hollenbach, D., & Bally, J. 1998, ApJ, 499, 758
- Kennicutt & Evans (2012) Kennicutt, R. C., Jr. & Evans, N. J., II 2012, ARA&A, 50, 531
- Lahuis et al. (2006) Lahuis, F., van Dishoeck, E. F., Boogert, A. C. A., et al. 2006, ApJL, 636, L145
- Mandell et al. (2012) Mandell, A. M., Bast, J., van Dishoeck, E. F., et al. 2012, ApJ, 747, 92
- Nomura et al. (2007) Nomura, H., Aikawa, Y., Tsujimoto, M., Nakagawa, Y., & Millar, T. J. 2007, ApJ, 661, 334
- Nomura & Millar (2005) Nomura, H. & Millar, T. J. 2005, A&A, 438, 923
- Nguyen et al. (2002) Nguyen, T. K., Viti, S., & Williams, D. A. 2002, A&A, 387, 1083
- Öberg et al. (2009a) Öberg, K. I., Linnartz, H., Visser, R., & van Dishoeck, E. F. 2009a, ApJ, 693, 1209
- Öberg et al. (2010b) Öberg, K. I., Qi, C., Fogel, J. K. J. 2010a, ApJ, 720, 480
- Öberg et al. (2009b) Öberg, K. I., van Dishoeck, E. F., & Linnartz, H. 2009b, A&A, 496, 281
- Öberg et al. (2010a) Öberg, K. I., van Dishoeck, E. F., Linnartz, H.,& Andersson, S. 2010b, ApJ, 718, 832
- O’Dell et al. (1993) O’Dell, C. R., Wen, Z., & Hu, X. 1993, ApJ, 410, 696
- Pringle (1981) Pringle, J. E. 1981, ARA&A, 19, 137
- Qi et al. (2013) Qi, C., Öberg, K. I., & Wilner, D. J. 2013, ApJ, 765, 34
- Richling & Yorke (2000) Richling, S. & Yorke, H. W. 2000, ApJ, 539, 258
- Ruffle & Herbst (2001) Ruffle, D. P. & Herbst, E. 2001, MNRAS, 322, 770
- Störzer & Hollenbach (1999) Störzer, H. & Hollenbach, D. 1999, ApJ, 515, 669
- Thi et al. (2004) Thi, W.-F., van Zadelhoff, G.-J., & van Dishoeck, E. F. 2004, A&A, 425, 955
- Walsh et al. (2010) Walsh, C., Millar, T. J., & Nomura, H. 2010, ApJ, 722, 1607
- Walsh et al. (2012) Walsh, C., Nomura, H., Millar, T. J., & Aikawa, Y. 2012, ApJ, 747, 114
- Weingartner & Draine (2001) Weingartner, J. C. & Draine, B. T. 2001, ApJ, 548, 296
- Wilson & Rood (1994) Wilson, T. L. & Rood, R. T. 1994, ARA&A, 32, 191
- Woodall et al. (2007) Woodall, J., Agúndez, M., Markwick-Kemper, A. J., & Millar, T. J. 2007, A&A, 466, 1197


| Species | Column Densityaa = 10b. | Transition | Frequency | Line Strengthbb Listed line strengths are restricted to 10 mJy km-1. | ||||
|---|---|---|---|---|---|---|---|---|
| (cm-2) | (GHz) | (mJy km s -1) | ||||||
| Isolated | Irradiated | Isolated | Irradiated | |||||
| 10 AU | 100AU | 10 AU | 100AU | |||||
| H | 5.6(20) | 1.3(19) | 1.6(21) | 2.2(21) | ||||
| H2 | 2.6(24) | 2.0(23) | 2.1(24) | 7.5(22) | ||||
| C | 2.3(17) | 7.2(16) | 4.7(17) | 2.3(17) | 3P1–3P0 | 492.161 | 22.8 | |
| 3P2–3P1 | 809.342 | 24.8 | 85.2 | |||||
| CO | 2.7(20) | 1.8(19) | 2.3(20) | 8.8(18) | 1–0 | 115.271 | 14.5 | 31.2 |
| 2–1 | 230.538 | 68.2 | 141 | |||||
| 3–2 | 345.796 | 163 | 326 | |||||
| 4–3 | 461.041 | 293 | 578 | |||||
| 6–5 | 691.473 | 599 | 1230 | |||||
| 7–6 | 806.652 | 734 | 1600 | |||||
| 8–7 | 921.800 | 824 | 1970 | |||||
| HCO+ | 1.7(14) | 4.8(13) | 2.1(14) | 3.0(14) | 3–2 | 267.558 | 27.1 | 31.6 |
| 4–3 | 356.734 | 54.1 | 86.9 | |||||
| 5–4 | 445.903 | 86.4 | 184 | |||||
| 7–6 | 624.209 | 150 | 545 | |||||
| 8–7 | 713.342 | 183 | 830 | |||||
| 9–8 | 802.456 | 225 | 1200 | |||||
| 10–9 | 891.558 | 284 | 1670 | |||||
| CN | 9.7(13) | 8.0(13) | 4.6(14) | 5.5(14) | 25/2–13/2 | 226.876 | 12.0 | |
| 35/2–23/2 | 340.031 | 32.9 | ||||||
| 37/2–25/2 | 340.249 | 45.4 | ||||||
| 47/2–35/2 | 453.390 | 14.0 | 83.2 | |||||
| 49/2–37/2 | 453.607 | 18.1 | 104 | |||||
| 611/2–59/2 | 680.047 | 32.4 | 221 | |||||
| 613/2–511/2 | 680.264 | 38.2 | 255 | |||||
| 713/2–611/2 | 793.336 | 37.7 | 278 | |||||
| 715/2–613/2 | 793.554 | 43.7 | 315 | |||||
| 815/2–713/2 | 906.593 | 39.5 | 308 | |||||
| 817/2–715/2 | 906.811 | 44.7 | 345 | |||||
| HCN | 5.9(14) | 2.1(13) | 2.4(14) | 1.0(14) | 3–2 | 265.886 | 12.4 | 30.1 |
| 4–3 | 354.505 | 27.1 | 71.9 | |||||
| 5–4 | 443.116 | 44.9 | 129 | |||||
| 7–6 | 620.304 | 80.2 | 251 | |||||
| 8–7 | 708.877 | 98.0 | 295 | |||||
| 9–8 | 797.433 | 120 | 316 | |||||
| 10–9 | 885.971 | 149 | 313 | |||||
| CS | 2.7(13) | 1.5(13) | 1.2(15) | 2.0(13) | 7–6 | 342.883 | 10.8 | |
| 8–7 | 391.847 | 14.2 | ||||||
| 9–8 | 440.803 | 17.3 | ||||||
| 10–9 | 489.751 | 19.6 | ||||||
| 13–12 | 636.532 | 20.2 | ||||||
| 14–13 | 685.436 | 18.5 | ||||||
| 17–16 | 832.062 | 11.3 | ||||||
| C2H | 7.7(13) | 1.4(13) | 2.3(14) | 8.4(13) | ||||
| H2CO | 8.1(11) | 1.4(12) | 9.3(11) | 1.6(12) | ||||
| N2H+ | 6.7(10) | 3.1(11) | 7.0(09) | 8.9(09) | ||||
| H2O | 8.4(16) | 2.6(15) | 1.2(16) | 1.5(16) | ||||
| OH | 2.2(16) | 5.2(14) | 3.5(16) | 4.9(16) | ||||
| CO2 | 1.3(16) | 2.7(16) | 2.4(19) | 1.4(17) | ||||
| C2H2 | 2.7(14) | 3.0(13) | 2.8(13) | 1.2(13) | ||||