Electric properties of supercooled water contained in cylindrical nanopores
Abstract
The paper provides data on measuring electrical properties of supercooled water in nanoporous silica MCM-41 with diameter cylindrical pores, using the methods of dielectric spectroscopy and measuring proper electrical fluctuations at low frequencies. Occurrence of non-linear media properties at the temperatures below was determined, which was revealed in the form of registered cell capacity dependence on voltage amplitude in it, as well as noise increase close to . The effects observed are supposed to be related to the earlier predicted ferroelectric phase transition.
Introduction
One of the methods of studying the properties of supercooled water is the method of dielectric spectroscopy of pore materials containing entrapped water. It is widely used in the frequency range to Frunza et al. (2004); Sliwinska-Bartkowia et al. (2008). In some cases the measurements are taken over the frequency of Frunza et al. (2004), and measurements of some parameters - over the frequency of Bordonskiy and Krylov (2012).
When combining the dielectric spectroscopy method with the methods of neutron and X-ray diffraction and scanning differential spectroscopy, some unique data on structural water transformations in nanoporous media were obtained. For instance, occurrence of cubic ice Ic at the temperatures below was experimentally determined Sliwinska-Bartkowia et al. (2008); Johari (2009). It was reported about detection of ferroelectric phase transition close to in supercooled water in MCM-41 silica pores which look like diameter ordered cylinders Bordonskiy and Orlov (2011); Bordonskiy et al. (2012); Fedichev et al. (2011). The phase transition in supercooled water at the temperatures was theoretically discussed in Angell (1983); Menshikov and Fedichev (2011).
Detection of nonlinear electrical properties in porous moistened media requires the dielectric spectroscopy method correction. When studying ferroelectric phase or phase transition areas, medium response to external electric field can depend on amplitude, frequency and some other factors in a complicated way.
The purpose of the present study was to search for signs of supercooled water phase transition at the temperature close to , from paraelectric to ferroelectric phase, for confirmation of the research results Bordonskiy and Orlov (2011); Bordonskiy et al. (2012); Fedichev et al. (2011); Angell (1983); Menshikov and Fedichev (2011). This transition must be accompanied by the change in medium electric polarization, so methods of electric measurements should be used for its identification. Moreover, we had the task of dielectric spectroscopy method modification to study nonlinear ferroelectric media.
Methods of research
Improving the dielectric spectroscopy technique, we used the idea of a nonlinear electric circuit and its reaction to an external signal which depends on amplitude and frequency of a test signal. However, some complex parametric phenomena occur, and negative electrical resistance may appear Khalil (2002). Electromagnetic oscillation can appear in this system causing total measurement results distortion in the standard dielectric spectroscopy technique Barsukov and Macdonald (2005). Therefore, the research task was to detect the negative resistance and conditions of its occurrence in moist nanoporous silicates. Another aspect of measurement modification consisted in measuring capacity of a cell containing the medium studied with different voltage of its electric field. Occurrence of powerful electric polarization and increase of dielectric constant must have caused spasmodic rise in cell capacity, when cooling below Bordonskiy and Orlov (2011); Bordonskiy et al. (2012); Fedichev et al. (2011). However, it wasn’t reported about any findings on this effect in the studies that had been done by other researchers previously. We were to find out the causes for this disagreement.
A method for measuring electric noise EMF used for studying properties of ferroelectrics is also applied during the research Bednyakov (2011). In particular, this method uses intrinsic thermal noises for registration of changes in absolute sample’s permittivity in the form of a capacitive cell. After noise voltage has been amplified, it is usually detected, and a DC constant of output voltage equal to a root-mean-square value of a signal is measured. An important advantage in measuring intrinsic noises is absence of the external electric field of high strength that is present in the medium of the dielectric spectroscopy technique. This field can considerably distort the results of measuring electrical properties of the medium.
However, ferroelectric cells produce not only the thermal noises, but also some other electric fluctuation of different nature. For example, at frequencies less than , Barkhausen noise related to polarization jumps can dominate if the external electric field, the temperature and the pressure are changed Bednyakov (2011).
According to the above mentioned research, two different approaches in revealing nonlinearity of the moist porous medium at low frequencies were used. The first one consisted in searching for nonlinearity manifestations during capacity and resistance measurements at different amplitudes of the cell test signal, as well as negative resistance occurrence. As to the second approach, the low-frequency noise voltage that is considerably changed in the ferroelectric, which temperature is temporally varied, was researched. Meanwhile, we paid attention to the registration of unsteady processes in the form of sharp voltage pulses of short duration, similar to Barkhausen noise
An important aspect of the research was to reveal that a considerable portion of water in the pores of this diameter had the properties similar to volumetric water. According to some works Limmer and Chandler (2012); Fedichev and Menshikov (2012), loss of volumetric water properties happens with pore diameter of . The same was confirmed in Castrillon et al. (2009), when the methods of molecular dynamics were used to study rotation and translatory motion of water molecules in a flat layer close to hydrophilic surfaces. The surface effect disappeared at a distance more than .
Peculiaritied of measurement methods
.1 Dielectric spectroscopy
Measurements of the cell impedance were taken; its capacity depending on the temperature for different amplitudes of the test sinusoida signal in the range from to was calculated. The cell was a plane capacitor in size and had between the capacitor plates. Possibility of negative resistance appearance was examined at the same time.
The cell impedance was measured by GW-INSTEK LCR-78110G meter. The meter was preliminarily tested to register a negative resistance. Medium temperature was measured by means of thermocouple. Signal recording was done by Agilent’s data acquisition system. Silica MCM-41 was used as a porous medium. Its moistening thermal properties were thoroughly studied (for example, in Schreiber et al. (2001)). This material was used in Bordonskiy and Orlov (2011); Bordonskiy et al. (2012); Fedichev et al. (2011) for deep water supercooling. For this research we applied MCM-41 that was synthesized in the Institute of Chemistry and Chemical Technology, SB RAS. Its specific internal volume was and specific internal pore surface was about Parfenov and Kirik (2009). The diameter of cylindrical pores was . For these parameters, the temperature of phase transition in case of free ice melting, i.e. when heating after deep cooling, determined by formula, where r is pore radius in nanometers, , was Schreiber et al. (2001). When moist silicate is cooled, the diffusion of phase transition at the temperature with the interval about is observed Schreiber et al. (2001), so we could expect liquid water existence close to . Some freezing temperature drop takes place when pore filling is not complete Johari (2009).
.2 Intrinsic noises within the cell and the medium
Polarization noise measurements were taken by means of a tube cell in diameter. Round metal electrodes were on the cylinder’s base, pore powder-like material studied was placed between them. The cell was located in a shielded chamber where cooling nitrogen vapors were fed. Electric noises were amplified by a two-stage amplifier with a voltage ratio . The noise signal was detected by a linear-response detector. The constant component was filtered by a RC circuit with 1 second time constant. Voltage measured after the detector was equal to a root-mean-square value of the amplified noise voltage. A frequency band limited at the high frequency by was formed by a low-pass filter fixed between the two stages. Amplifier’s input resistance was equal to . A frequency band at the low frequency was limited by an input filter equal to some hertz. A system of information recording registered output signals with 0.5 second interval. The cooling and heating rate was approximately equal to per minute.
Measurement results
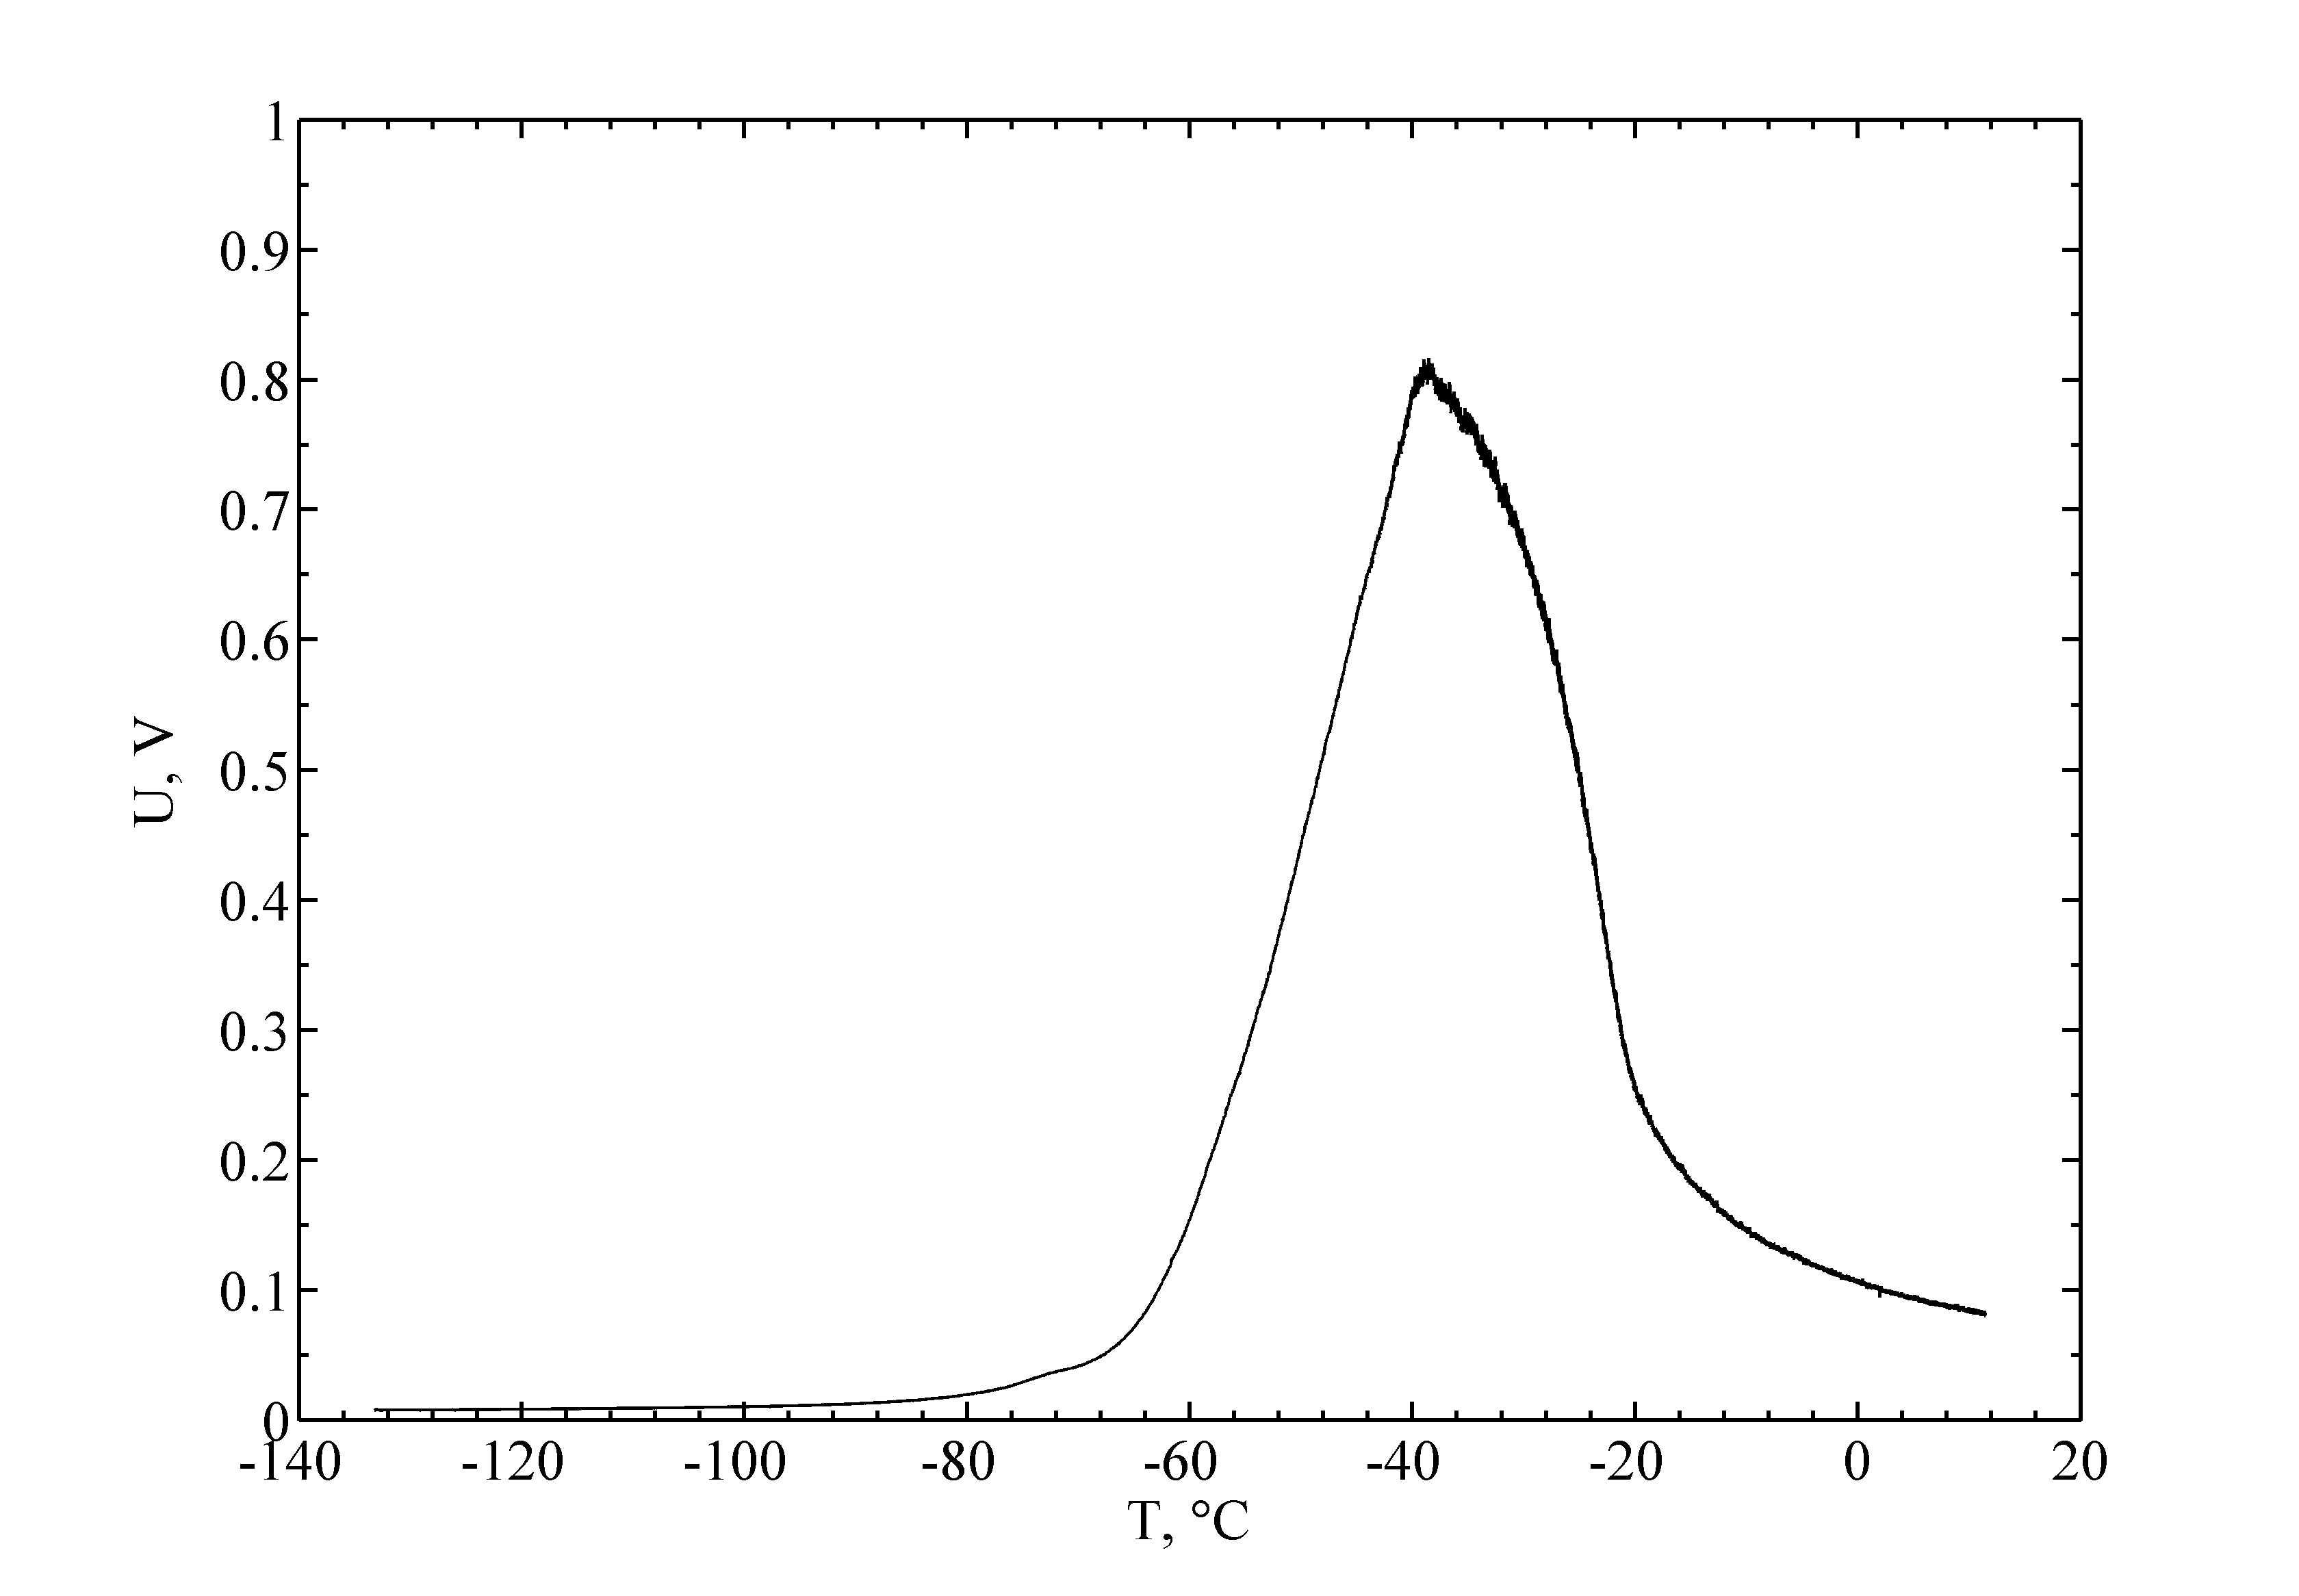
Fig. 1 shows the results of measuring cell capacity by MCM-41 depending on the medium temperature with different voltage amplitudes on the cell. The material’s gravimetric moisture in the experiment was 44% which corresponded to 55% of pore space filling.
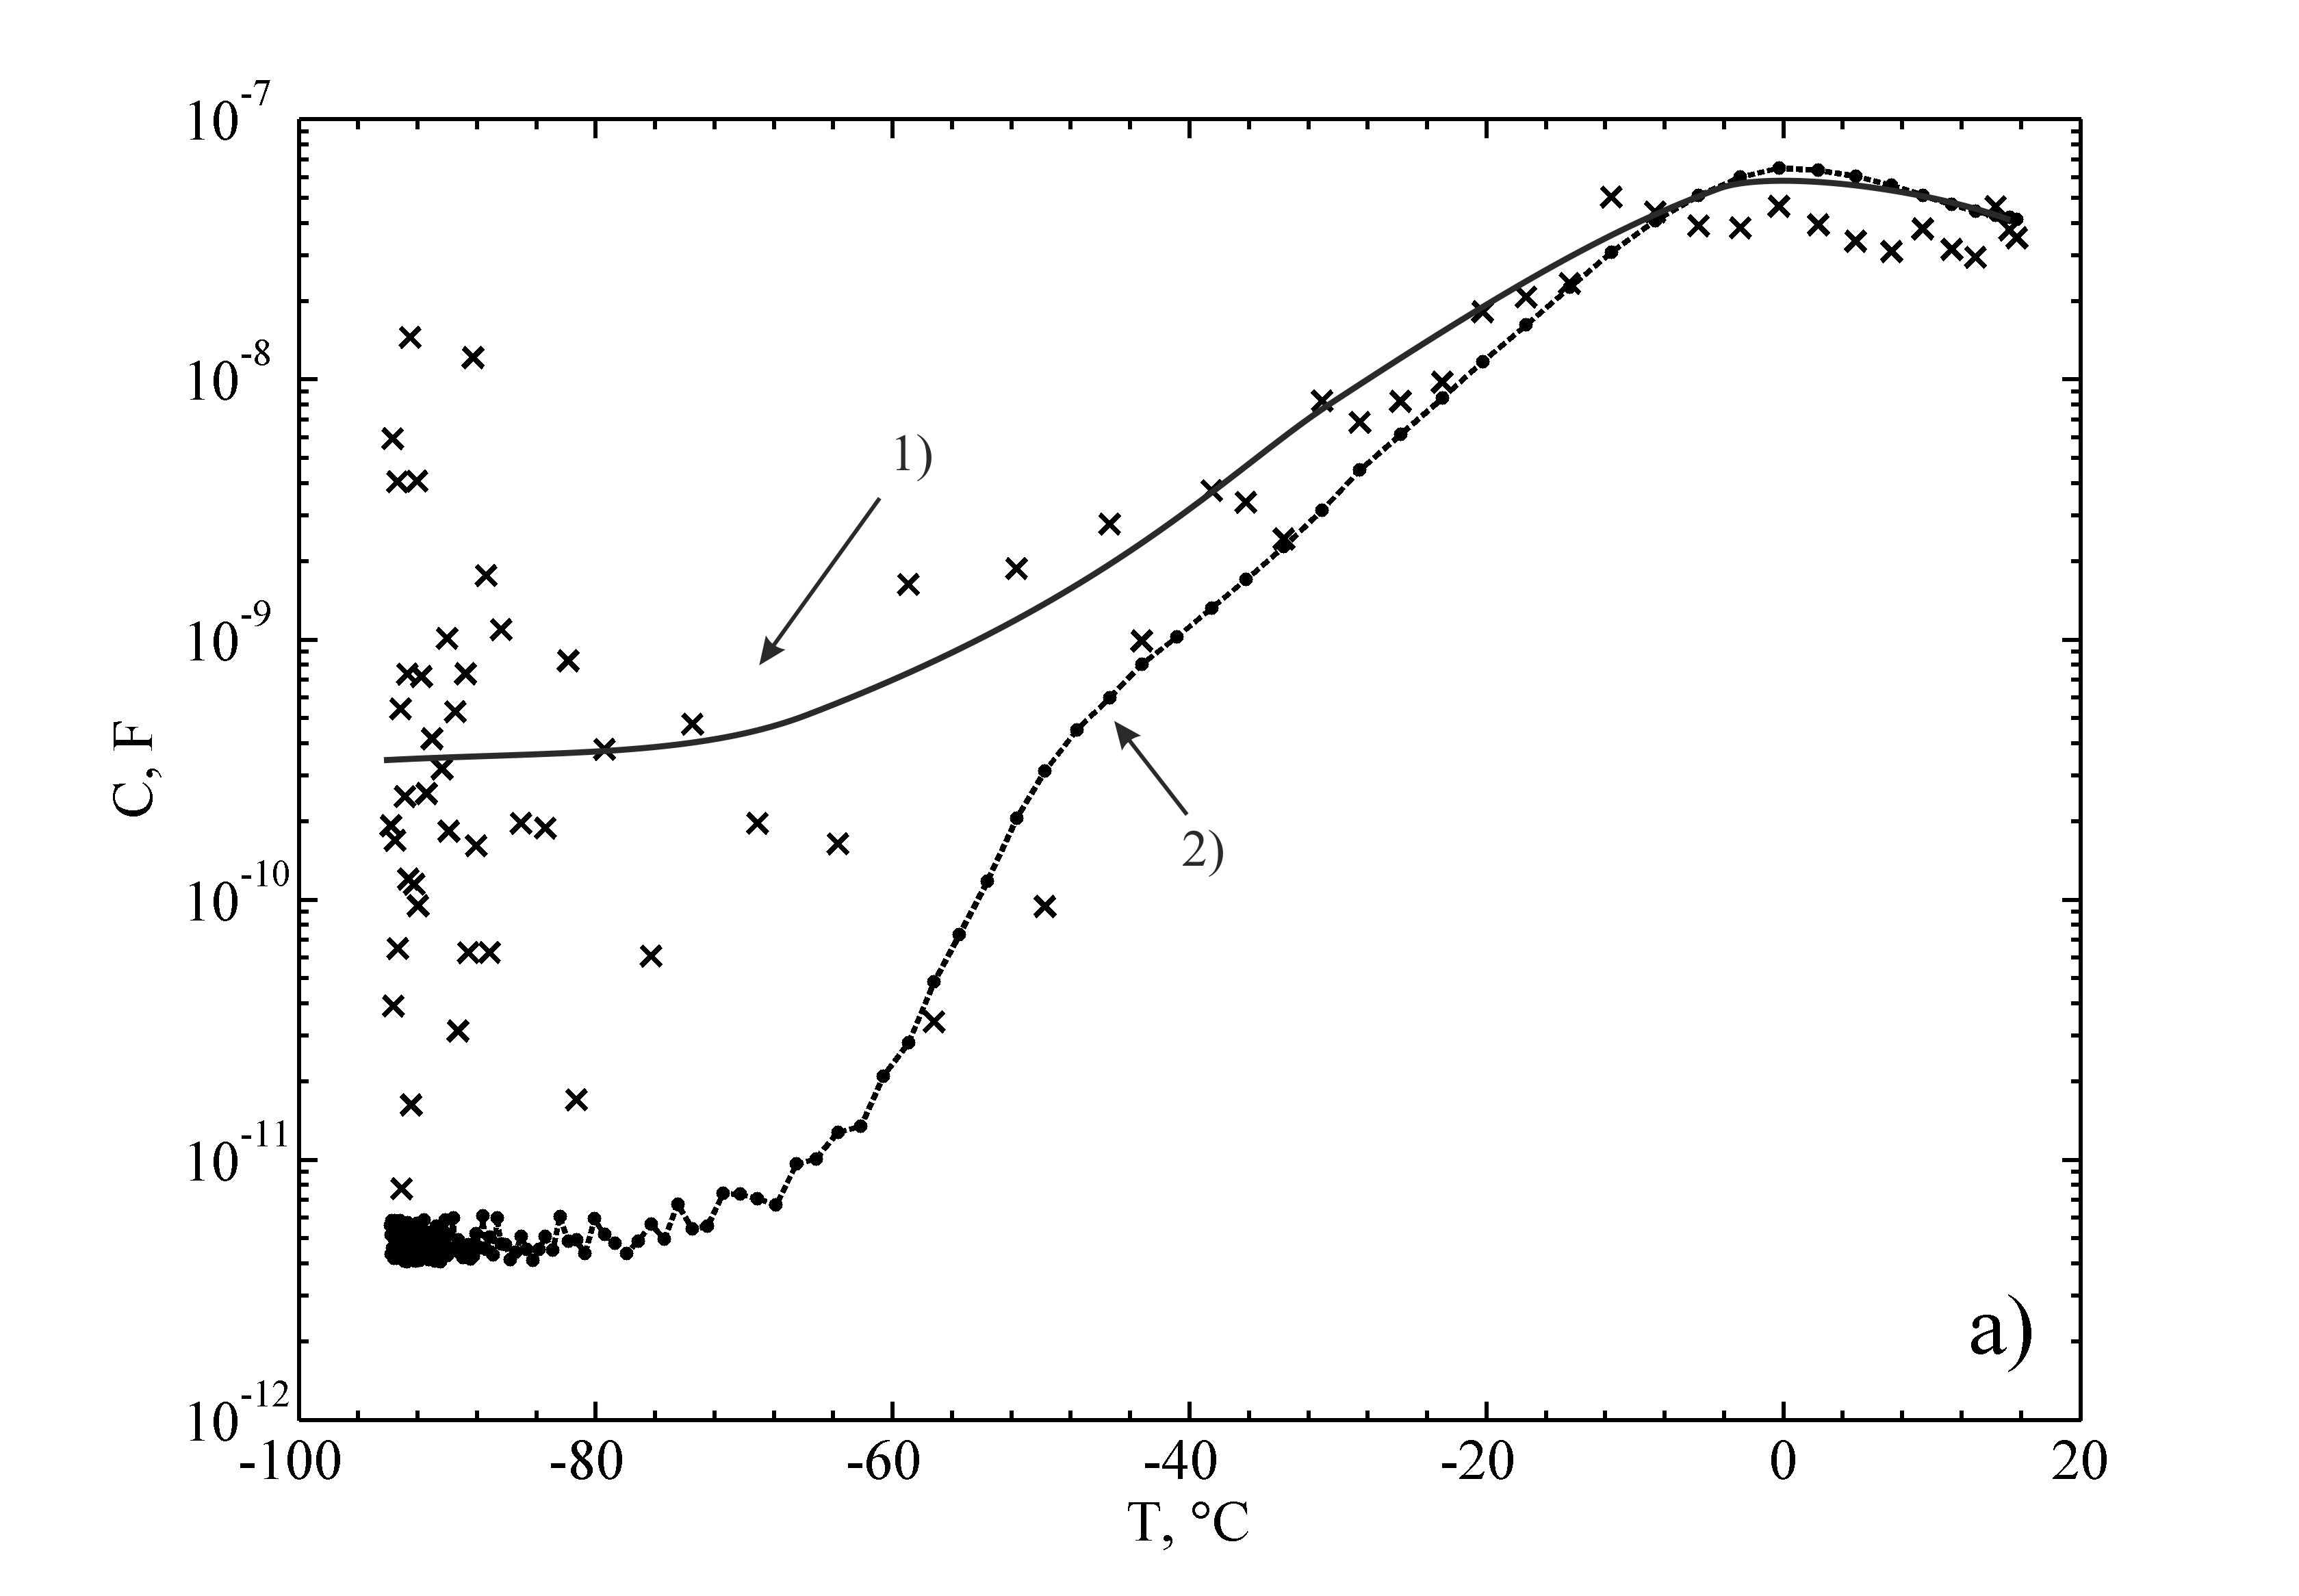
There is a considerable difference in the capacity measured from the signal’s amplitude at a frequency of at the temperature below . The measurements showed that for the voltage amplitude of the capacity was 100 times higher than for . High capacity values at the temperatures above the phase transition temperature are explained by the conductance effect and influence of double electrical layer capacity at the medium and electrode boundary Barsukov and Macdonald (2005).
At frequencies about several hundred hertz and below, at measured cell capacity dependencies on the temperature, we observed high spikes and dips of the value measured at some temperatures (fig.1a). This effect was observed at the temperatures below . One of the reasons of high instability in meter indications can be connected with nonlinearity of an electric circuit containing the cell with the medium studied. The reason of instability was detected by measurements of the real part of the cell impedance.
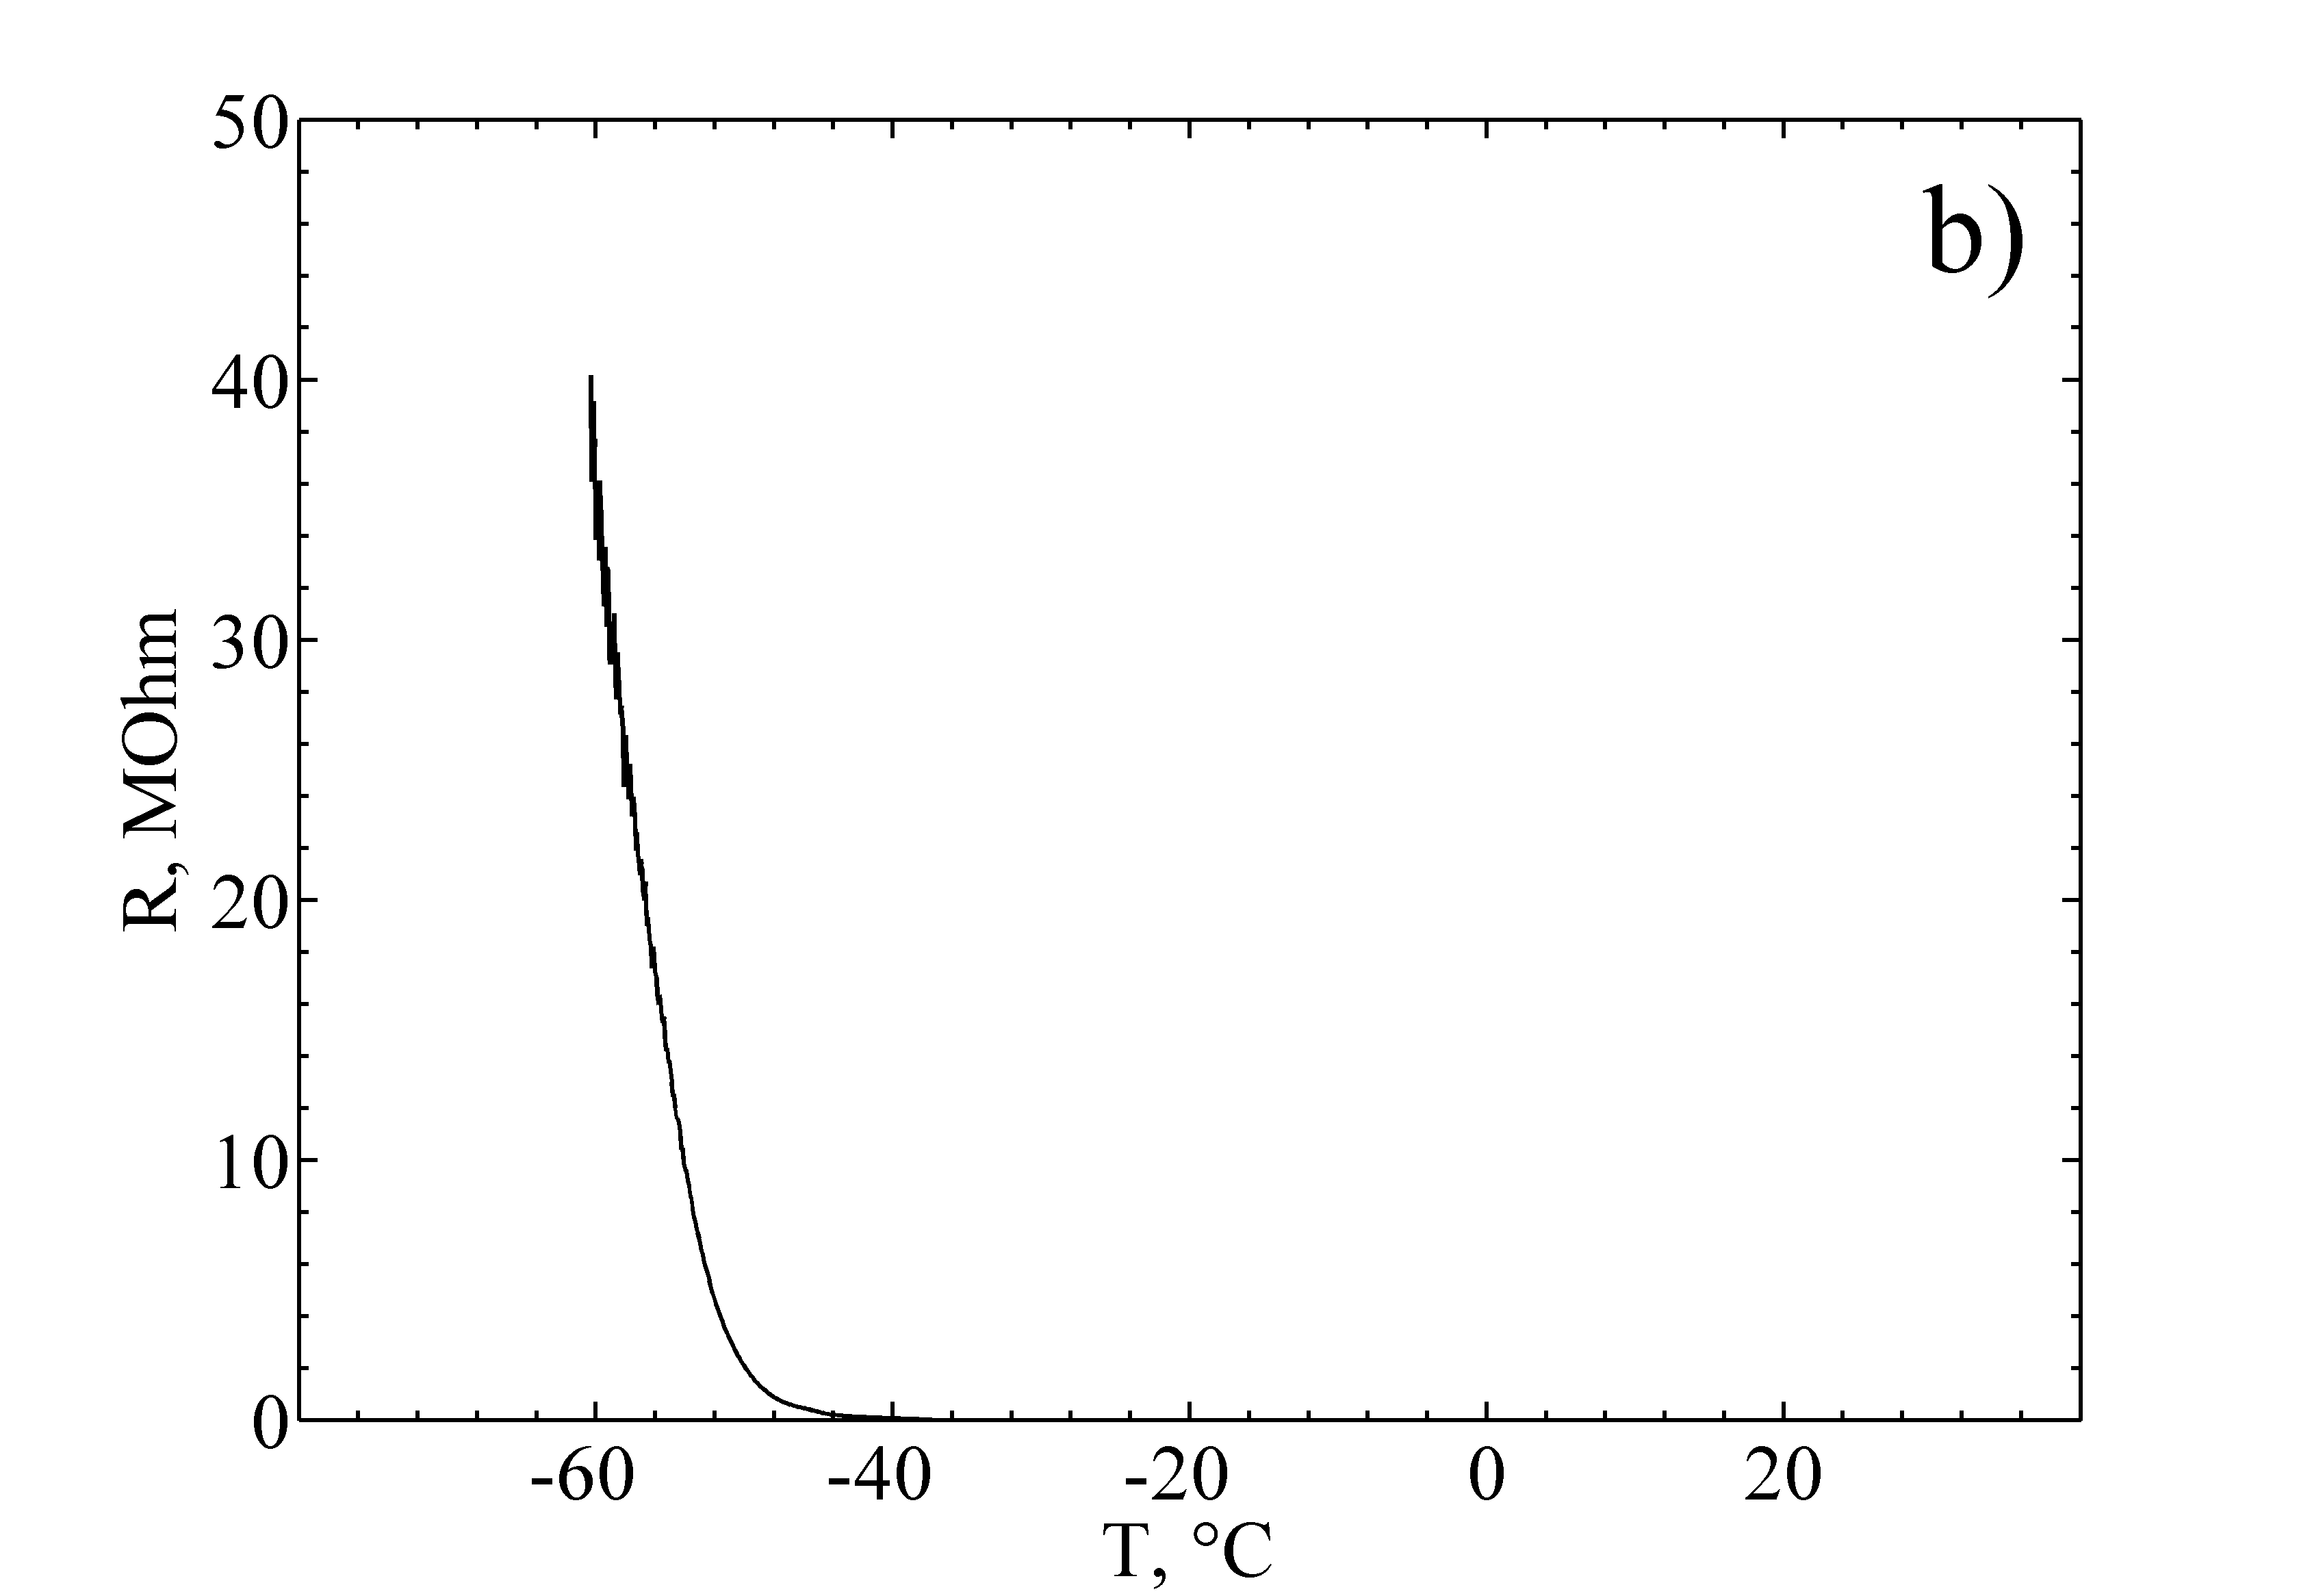
In fig. 2 dependence of the cell impedance real part on the temperature for the same sample is shown.
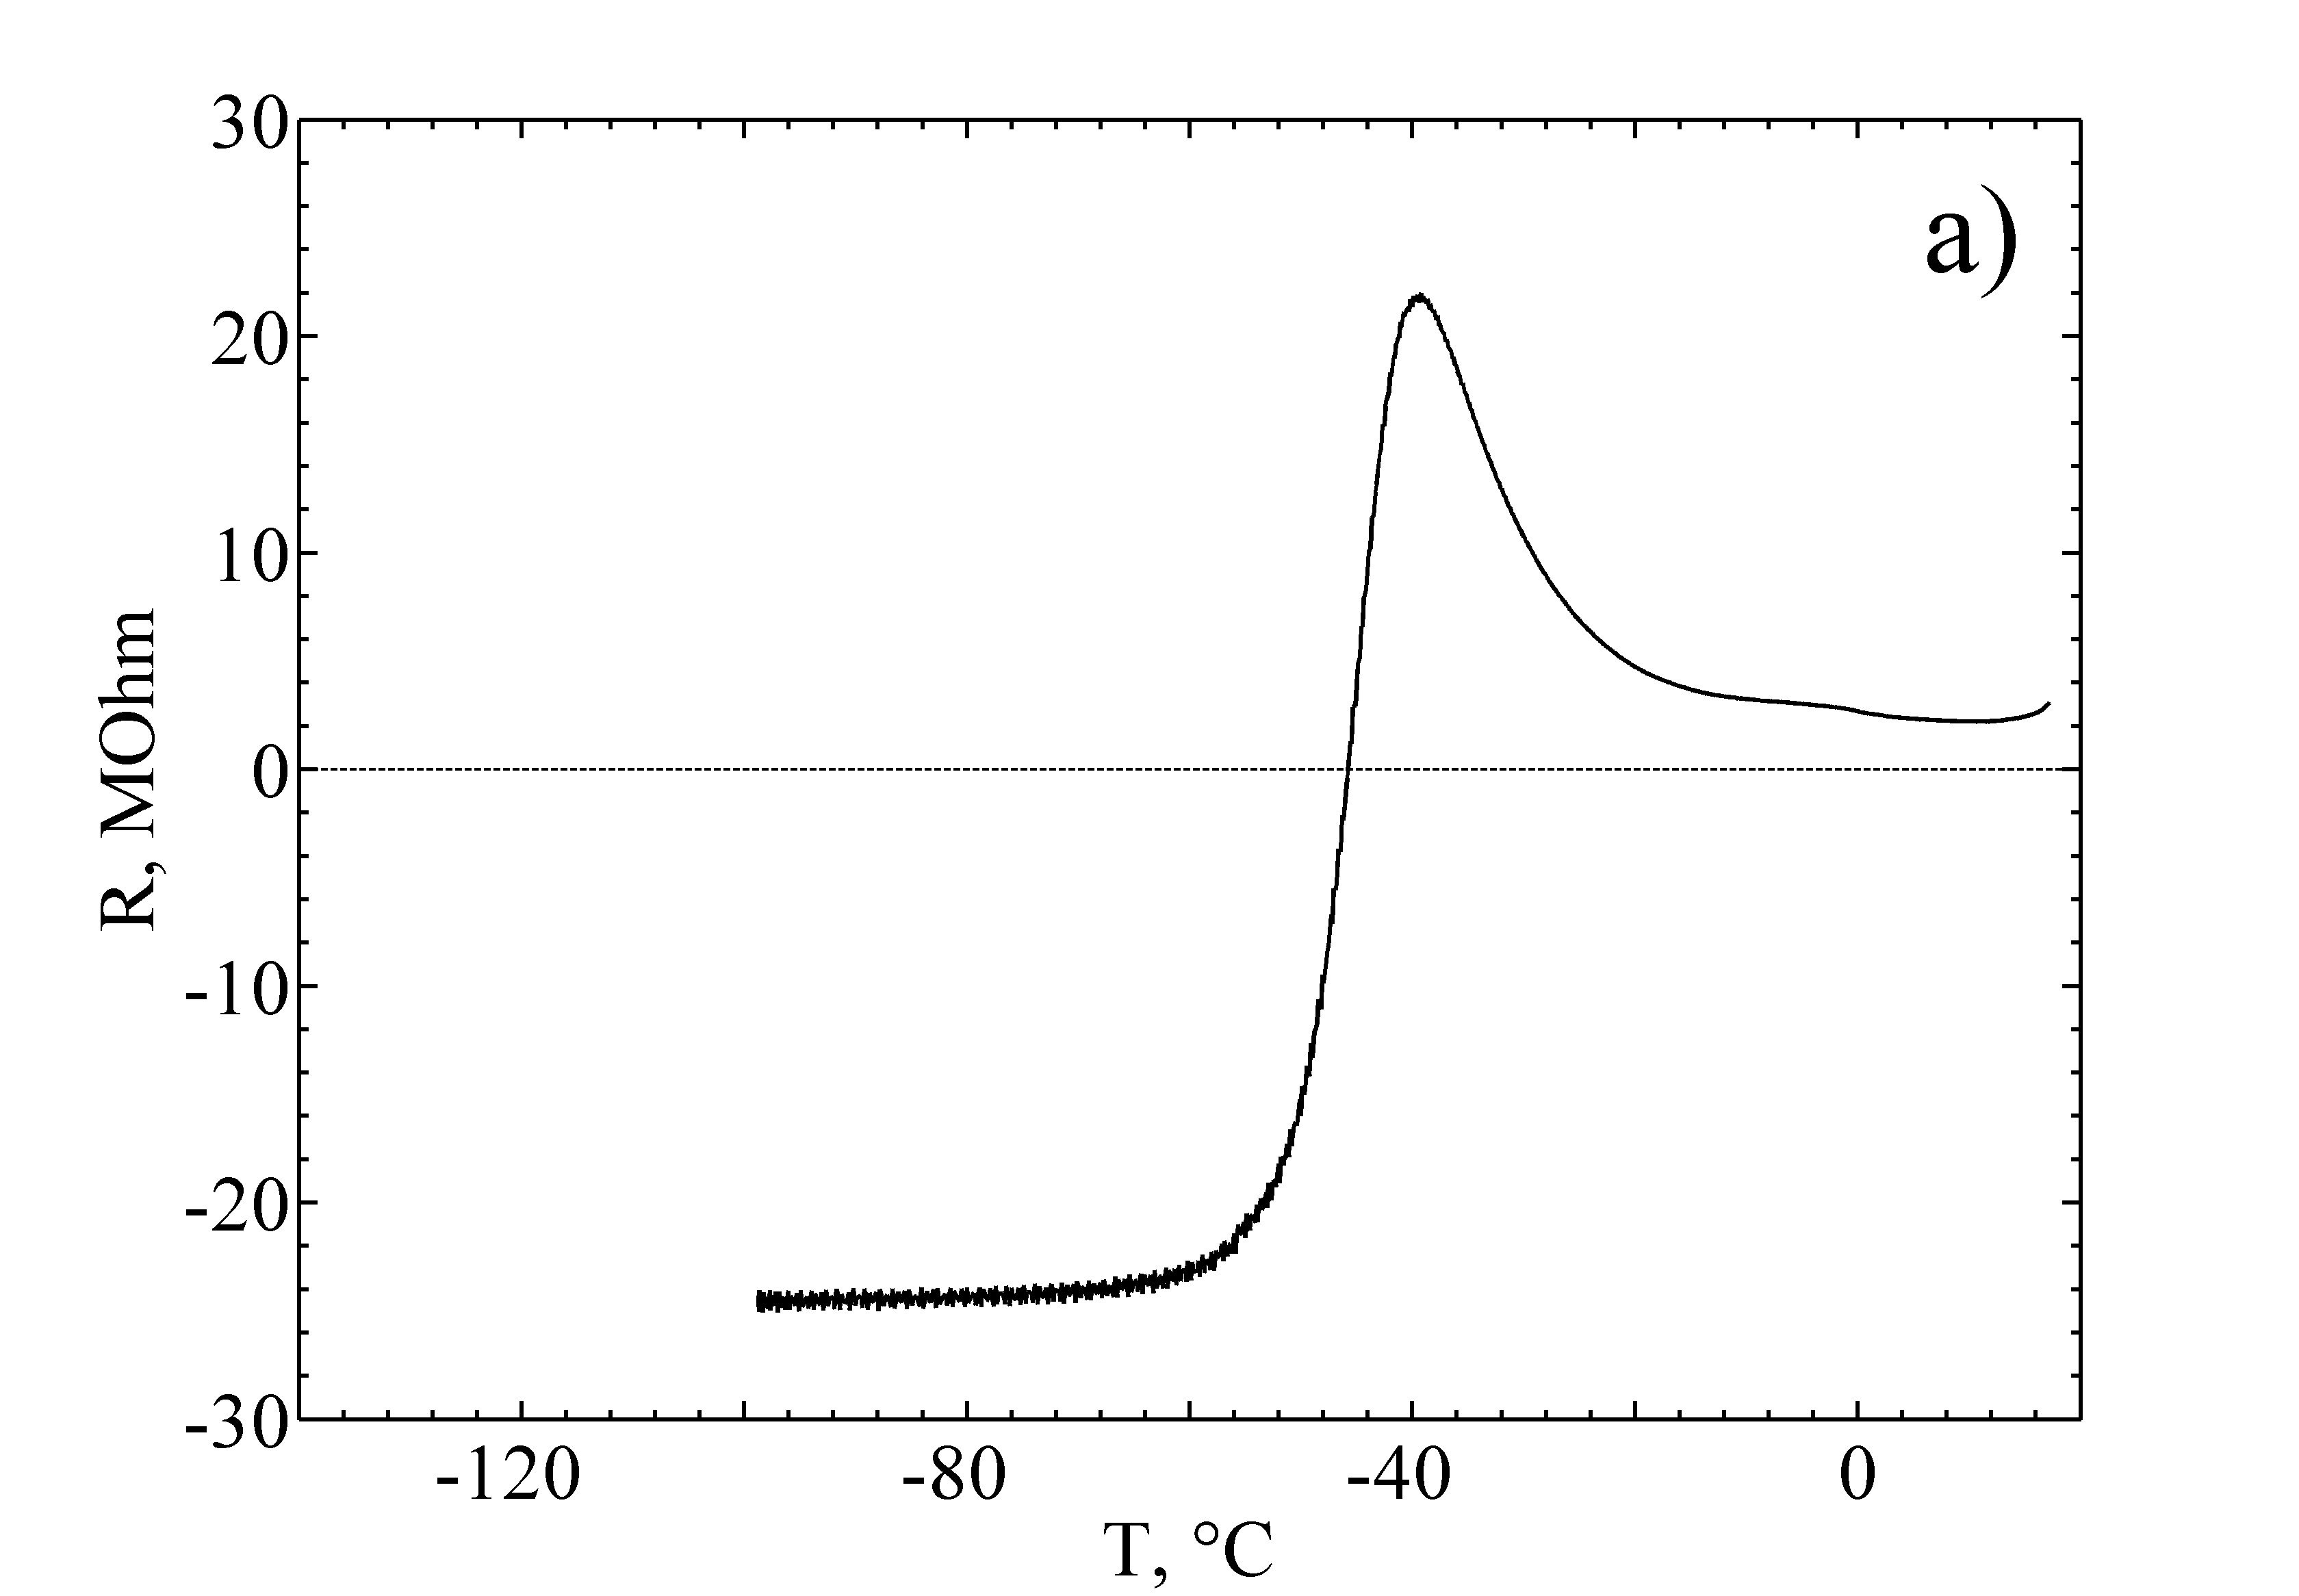
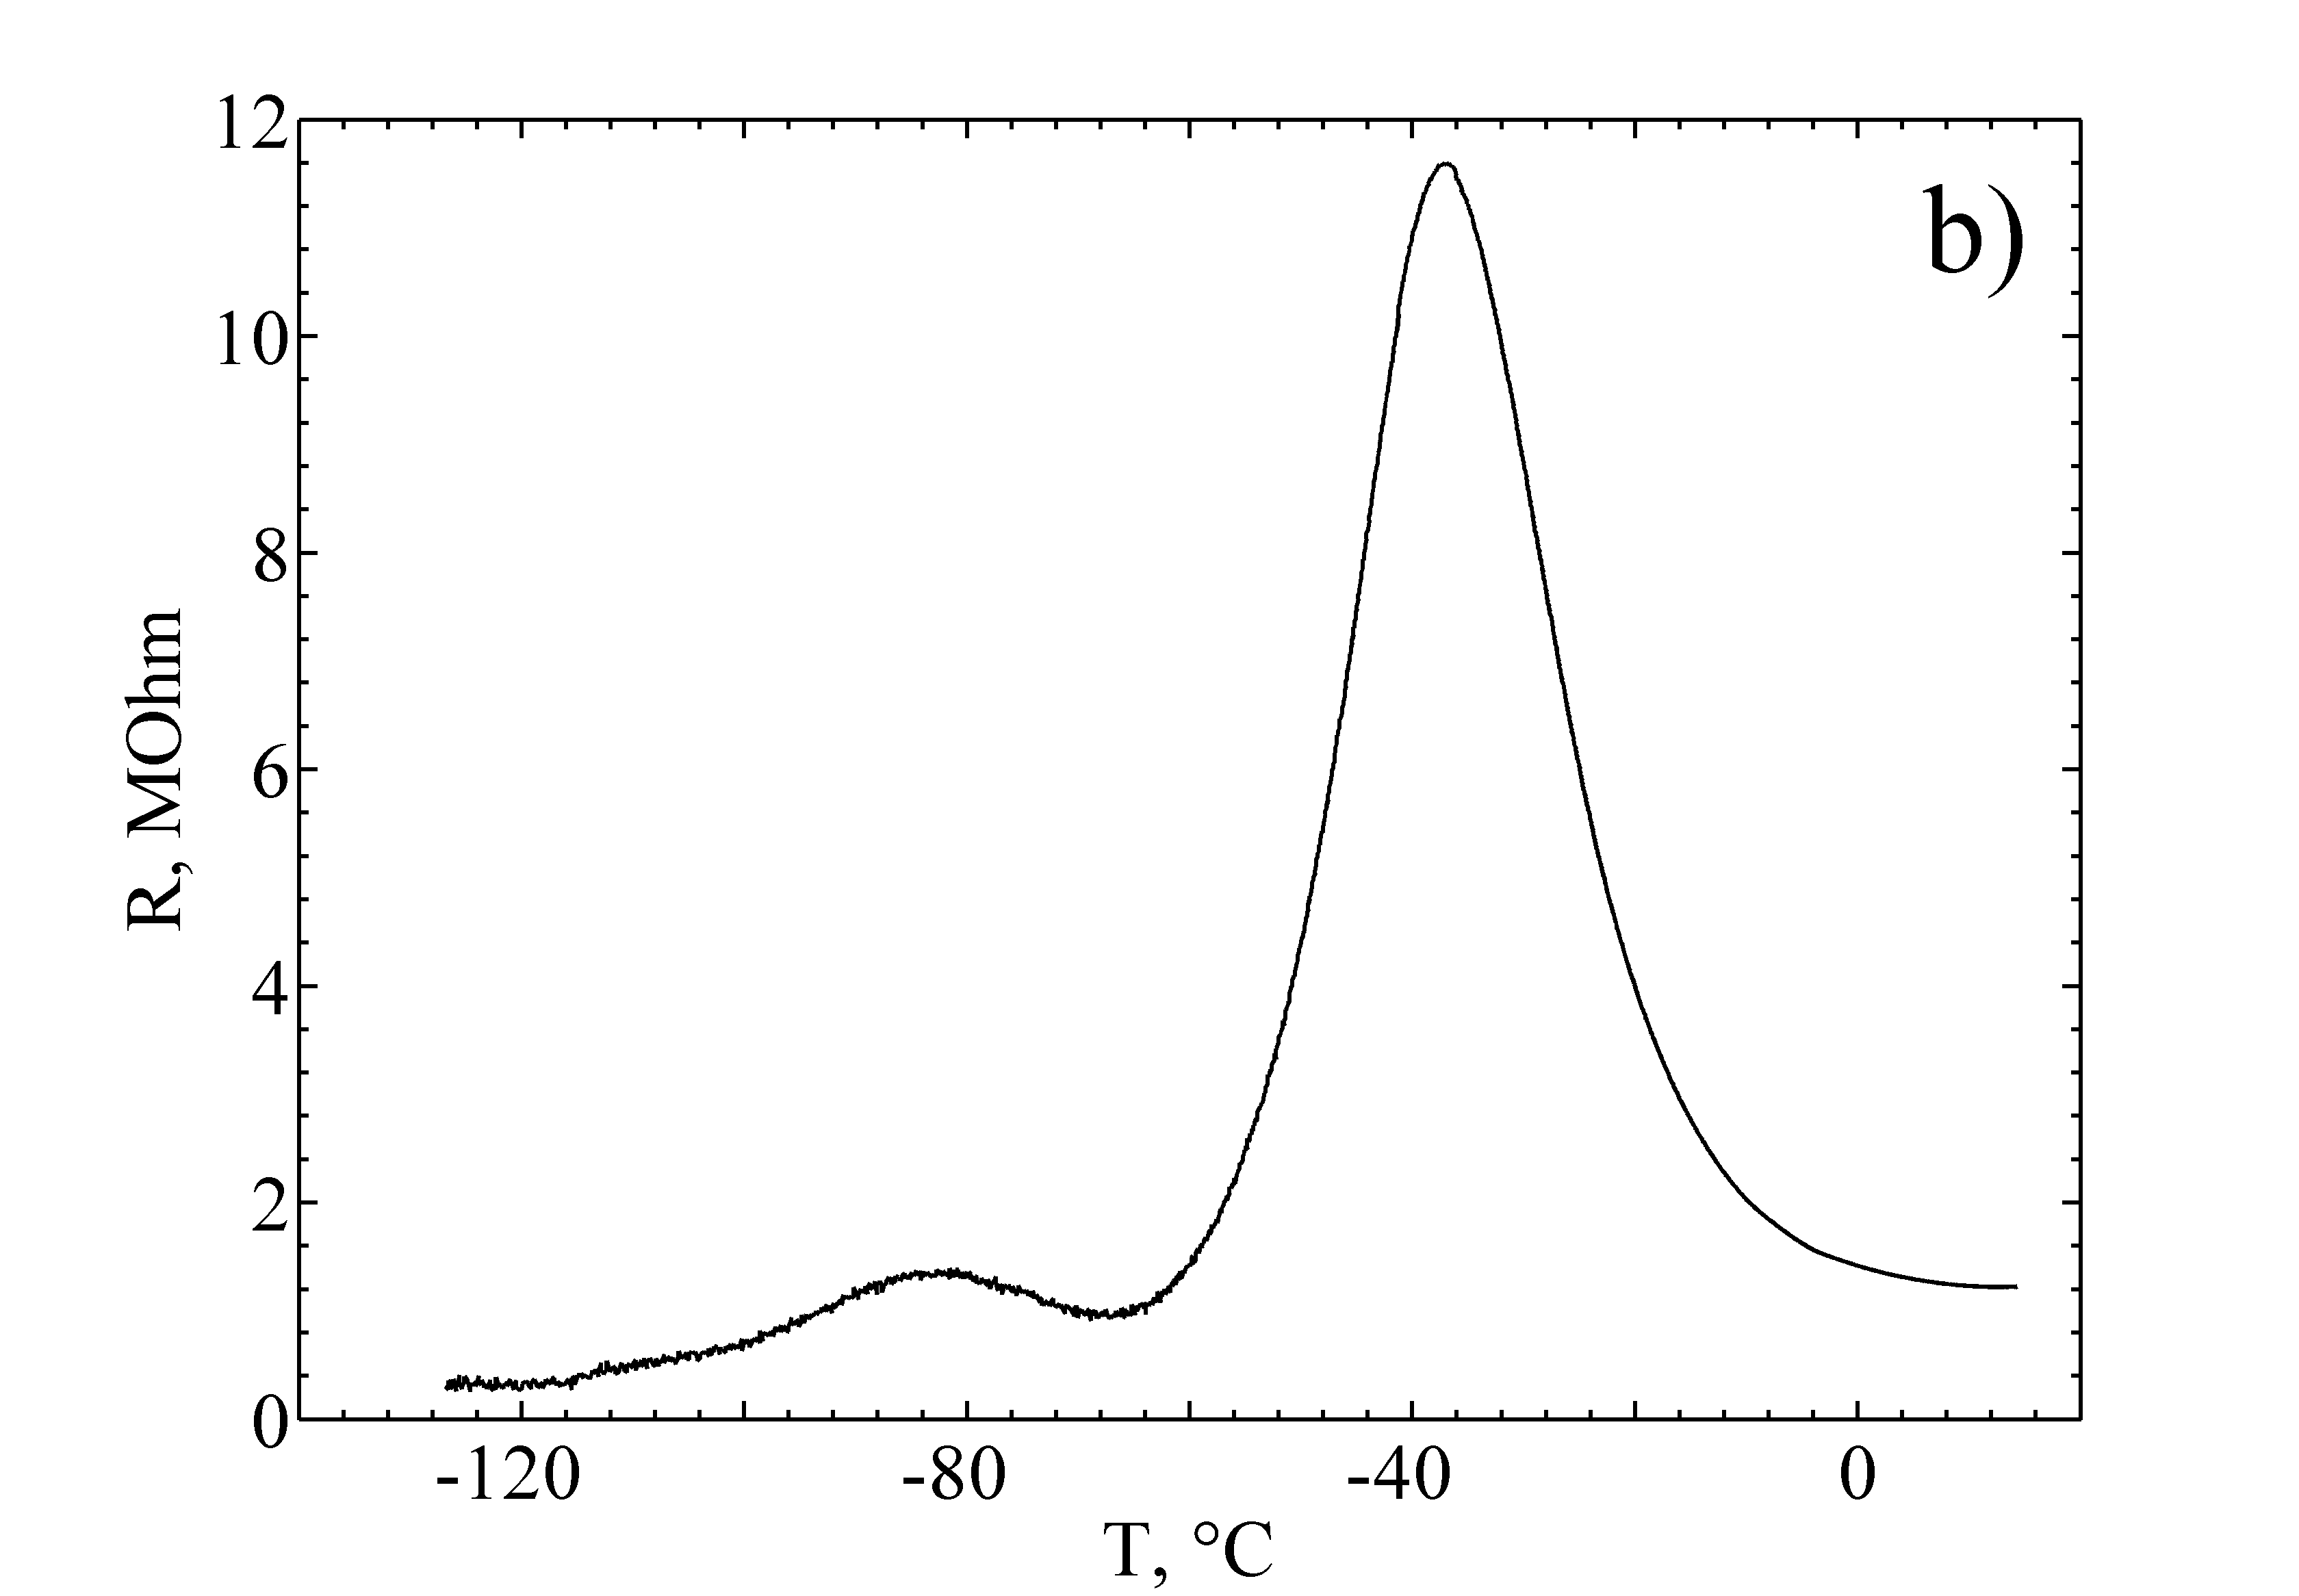
The graphs show negative resistance of the cell that appears at the temperatures down to at a frequency of . There wasn’t this effect at a frequency of . The amplitude of a test sine signal on the cell was .
Measurements at other frequencies, in the range to , showed instability in the measured value during the frequency manipulation.
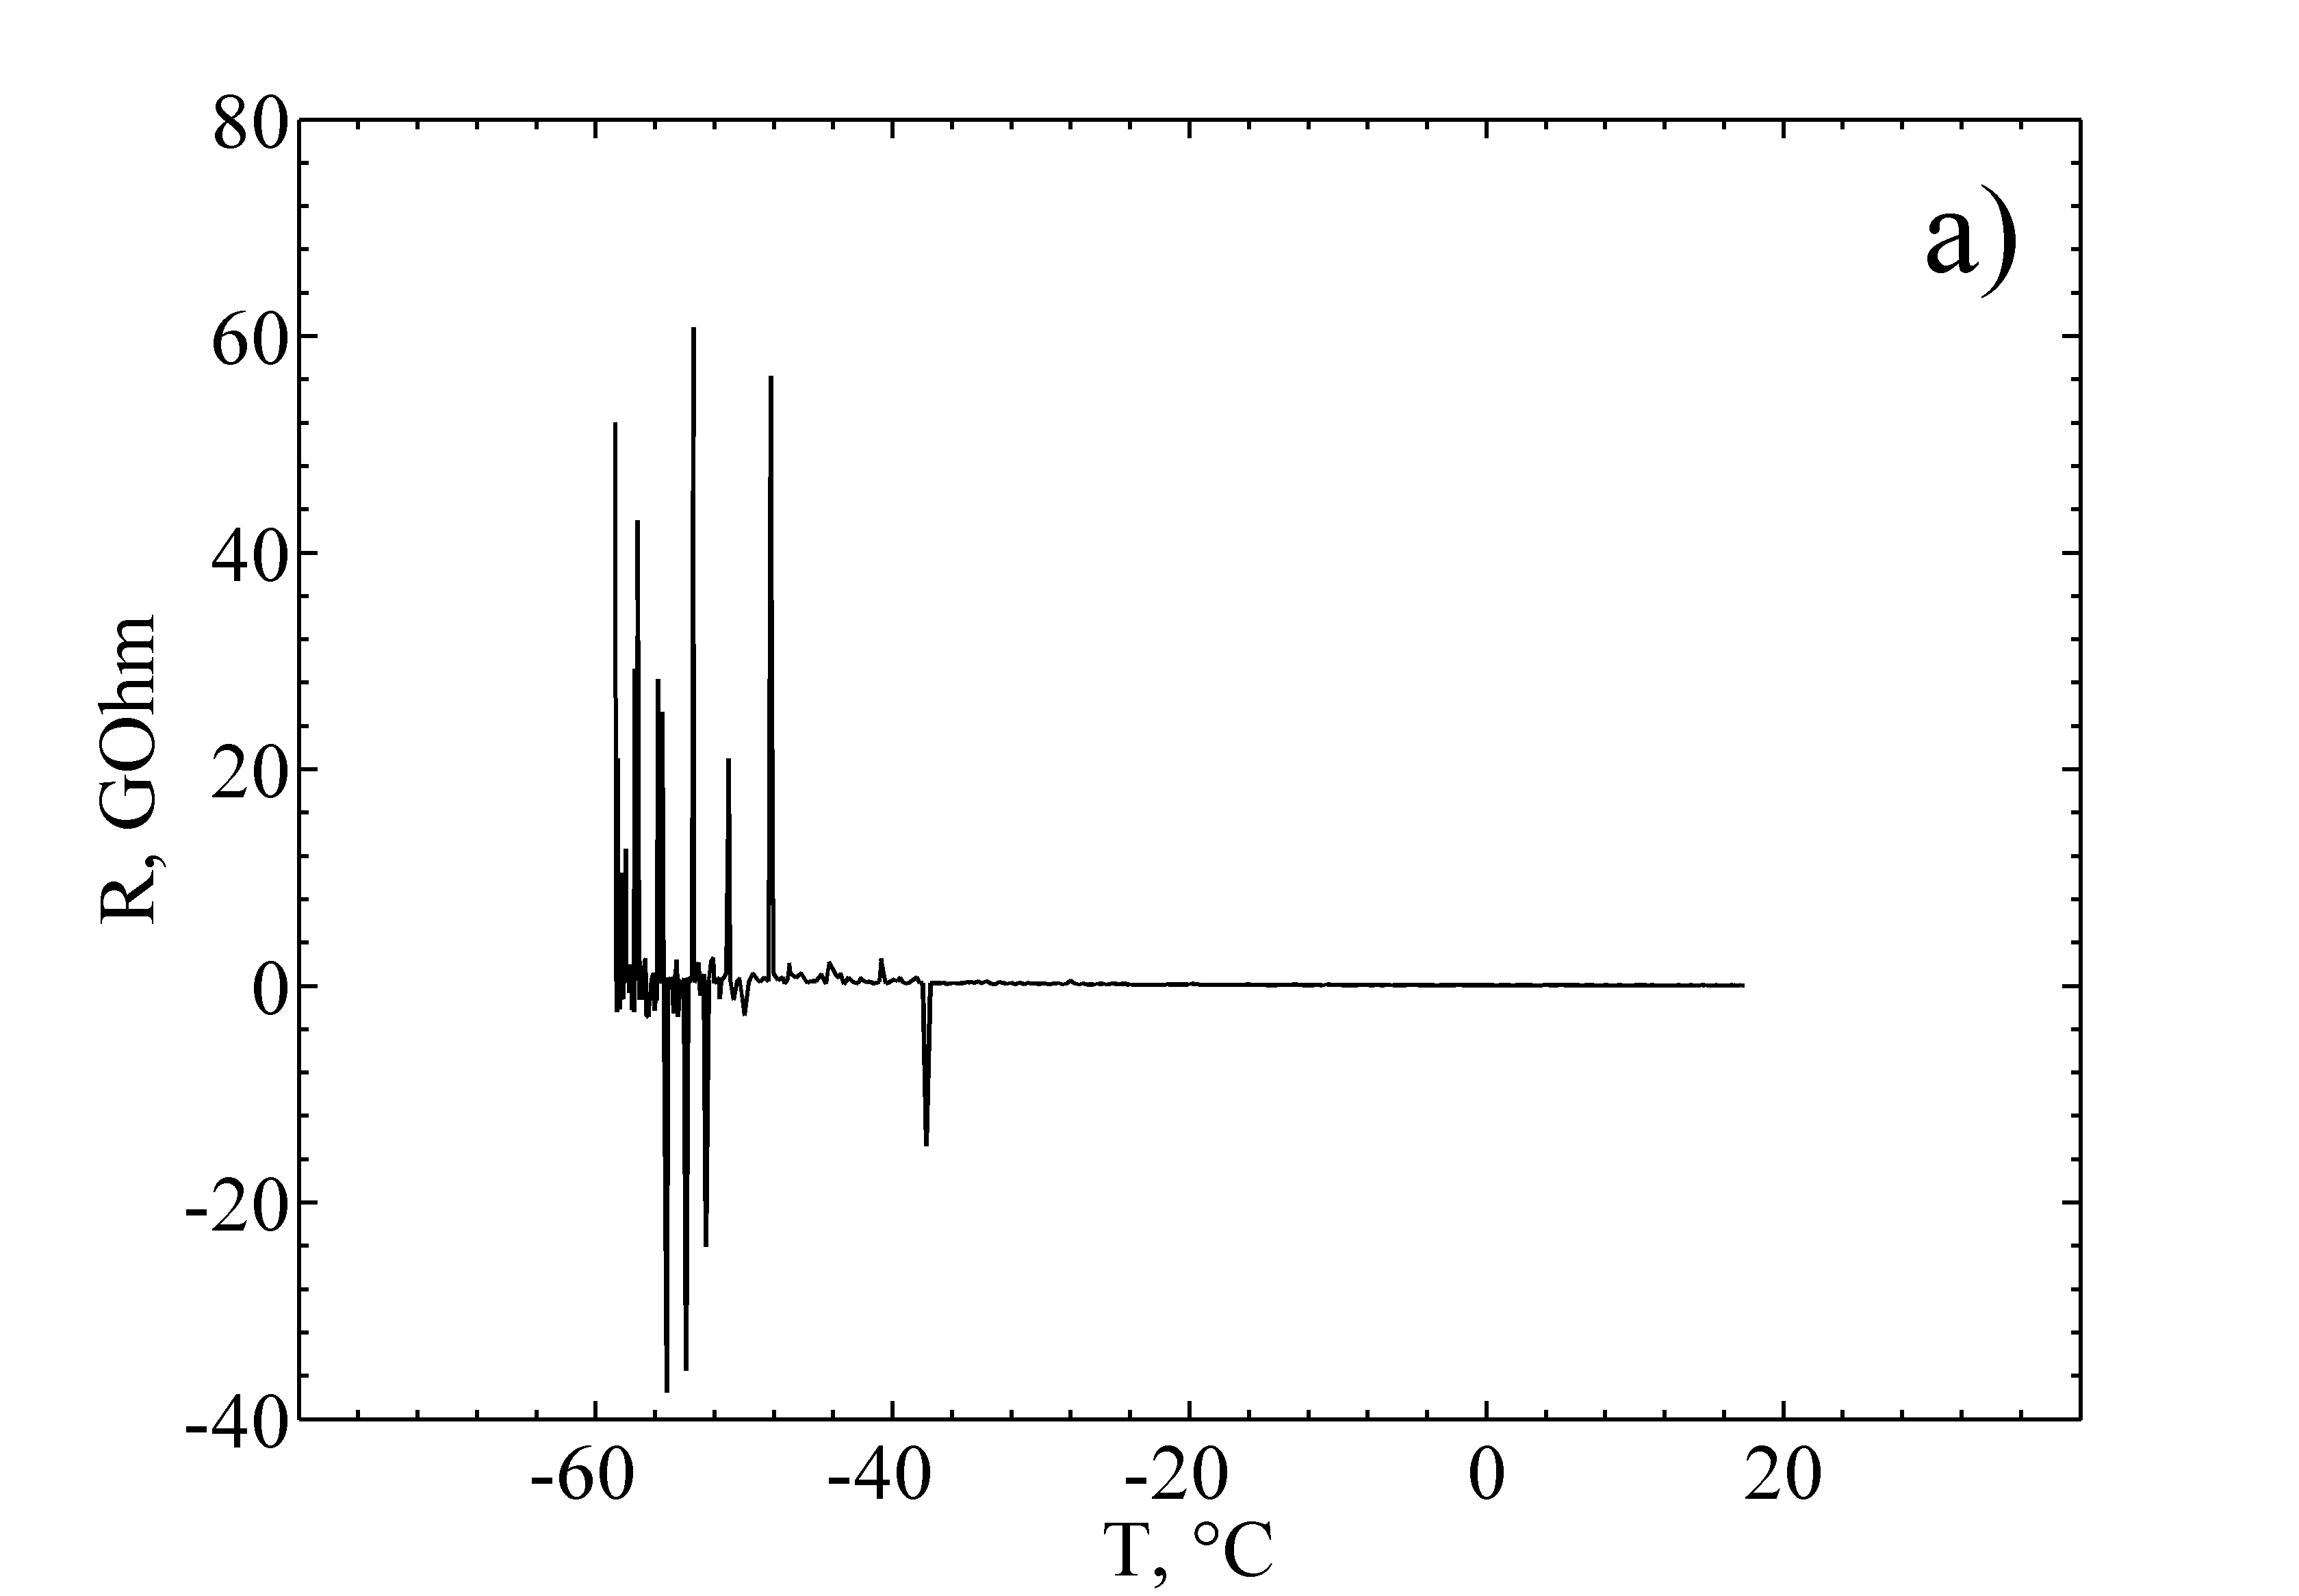
Taking measurements at the some frequency, one could observe spikes of the resistance values into the negative region at frequencies about , depending on MCM-41 sample temperature with different moisture content. Measuring a sample with a higher phase transition temperature equal to (silicate SBA-15 with cylinder pore diameter), there were no negative resistance values (fig.3).
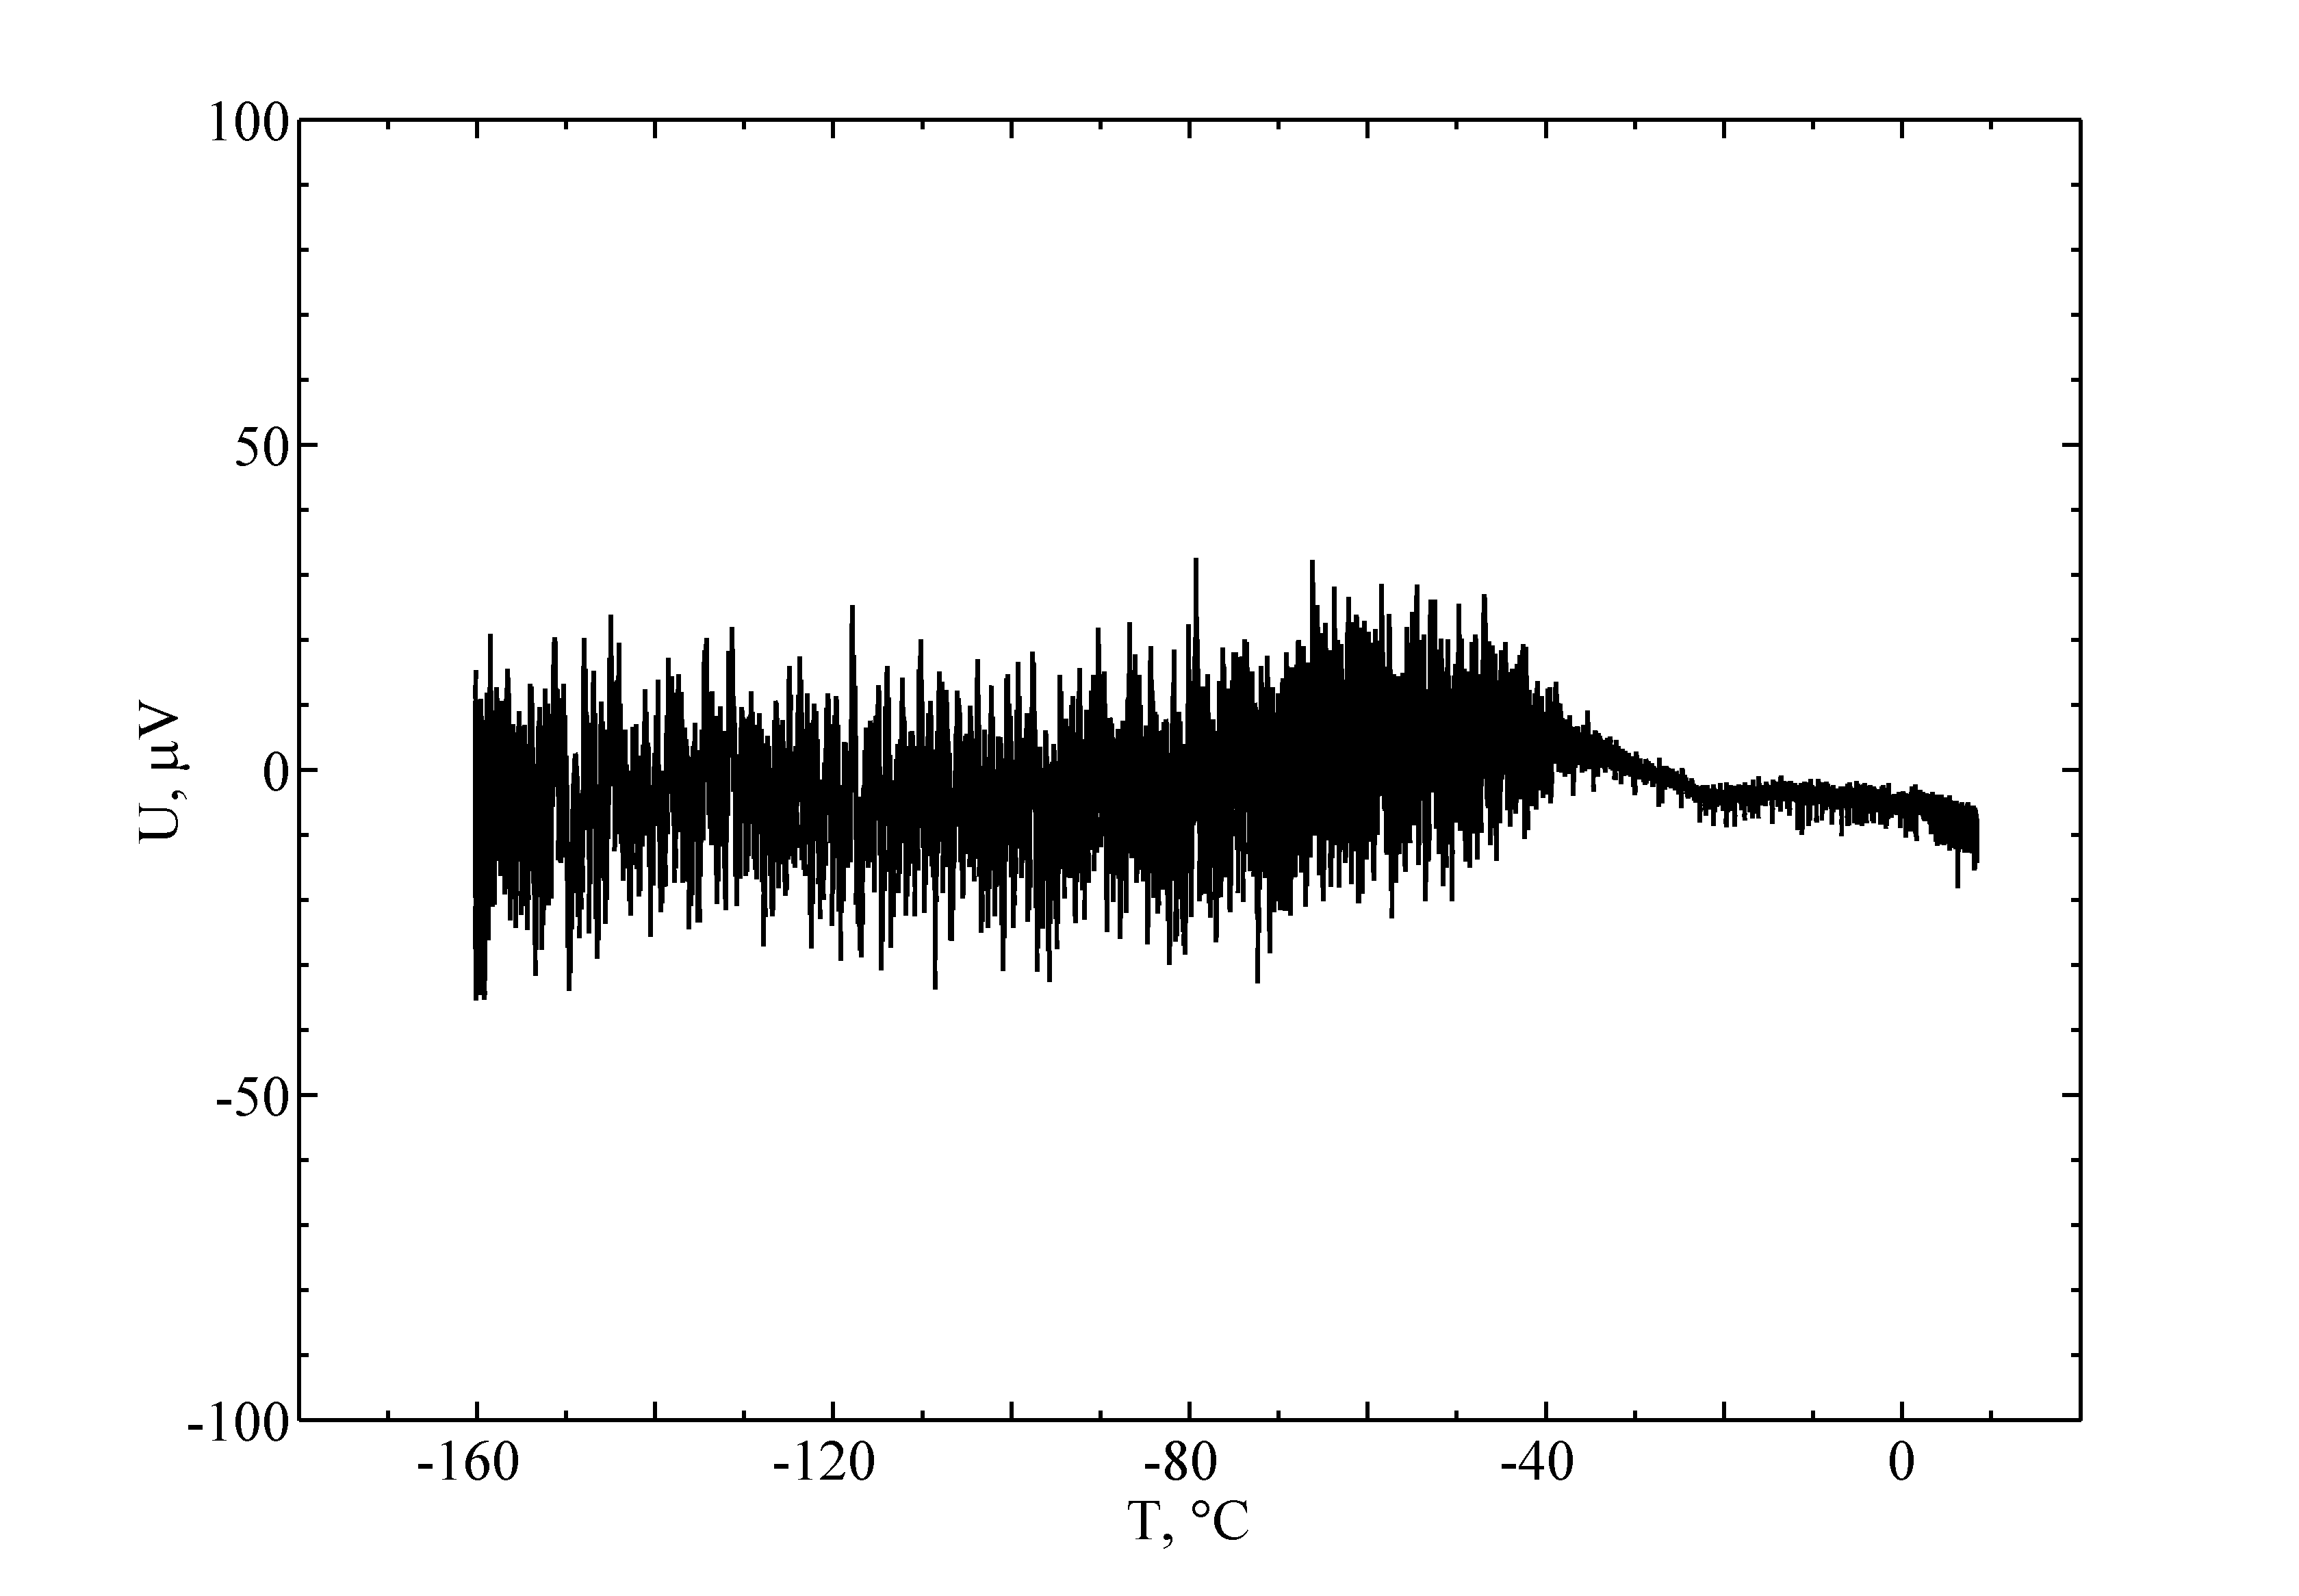
The results of measuring a root-mean-square value of electric noise amplitude after the amplification are shown in fig. 4.
When taking measurements for the noise voltage, a bell-shaped curve of its dependence on the temperature with maximum (on medium cooling) and (on its heating) was observed. Obviously, the temperature range is characterized as a specific one.
Moreover, a noise EMF source can be nonstationary, as in case with Barkhausen noise. Data on noise signal nonstationarity can disappear during the signal filtering and transformation. Formation of high level narrow pulses during Barkhausen effect can be used for verification of the ferroelectric phase existence. To detect such noise voltage pulses, we took measurements for the electrical noise with the modified amplifier circuit. The first amplifier stage was an operational amplifier LM833 having input bipolar transistors; its voltage transfer ratio was equal to 5. The upper value of the amplifier bandwidth was about (a filter with band was put between the first and the second amplifier stages). The signal was fed to the noninverting input. A pull-up resistor () was switched off the first stage in the modified amplifier circuit and that caused a sharp increase in input resistance. Due to leakage current in input transistor base, the amplifier entered into the mode close to saturation which caused a decrease in transfer coefficient for a week signal and occurrence of a high level of direct-current voltage at the first stage circuit output.
Measuring in this mode enables to reveal the input voltage pulses about and duration up to 1 microsecond, as in this case the amplifier short-term moves out of the saturation mode. Meanwhile, input fluctuations of the amplified signals increase because of the transient processes in the amplifier. The measurement results for the sample’s cooling are presented in Figure 5. As seen from the graph of noise recording, there is a temperature at which the noise is sharply changing. This temperature is close to . The same was observed using the sample heating.
Discution and results
So, different ways of measuring electric properties of the moist nanoporous silicate containing non-frozen water on moistening up to 70% of the pore space, characterize the temperature range close to as a specific one. In the temperature range , a 100 times capacity increase at a frequency of with the voltage amplitude on a cell was observed, which corresponded to the maximum intensity of the electric field in the medium . When the field intensity was higher than , effect of the capacity increase disappeared. In a heterogeneous medium the dielectric constant should be determined by means of Maxwell-Wagner mechanism taking account of inter-granular polarization. However, in any case, intermittent growth of the medium dielectric constant must be accompanied by a sharp dielectric constant increase of one of its components which is the most probable for the pore water. The negative resistance is registered in the medium below . Such an effect is feasible in nonlinear circuits; it is well-known in radio physics and is common for different devices - vacuum-tube and transistor oscillators, Gunn-diode oscillators, etc. Occurrence of the negative resistance under certain conditions brings about the electric circuit instability accompanied by the noise gain and pulse generation. The most probable reason for the supercooled water nonlinearity is the occurrence of electric domains, i.e. ferroelectric state.
A similar pattern of polarization noises was determined in the work Musevic et al. (1997) for the case of ferroelectric state formation in liquid crystals on their cooling. When passing from the positive to the negative temperatures, spectral density of the noise voltage increased about an order of magnitude and then remained constant in the process of aftercooling to some tens of degrees. For the measurement results presented in Figure 4, a significant level of noises down to takes place. Their increase in this case can be explained not only by Barkhausen effect, but also by the amplification in negative resistance field determined by electric medium instability. This effect is known in a theory of signal transformations, for instance, for a parametric circuit in the form of paralleled capacitor and resistor variables. Such a circuit can be found in mixer diodes, in down converter accompanied by the noise temperature increasing (i.e. negative resistance occurs) Bordonskiy (1977). In case of supercooled water parametric effect is connected with the change in spontaneous polarization during Barkhausen effect that can play a pumping part.
We can suppose that similarity of our results with those in the work Musevic et al. (1997) concerning the noise occurrence after the moist medium cooling below the defined temperature denotes the formation of ferroelectric liquid crystals in MCM-41 pores. This hypothesis has been put forward previously Bordonskiy and Orlov (2011) on the basis of both our own results and other authors’ researches Webber and Dore (2004); Jahnert et al. (2008). Coexistence of crystalline and liquid states was observed by means of different methods in these works. The hypothesis was also verified by theoretical studies Blinov and Golo (2012). This issue calls for further research.
The ferroelectric phase can emerge in any nanoporous bodies due to the existence of a number of pores less than 3 nm in size, where water supercools to about and below. Moreover, liquid water films having the properties similar to those of volumetric water, i.e. with thicknesses more than , exist at the interface between ice and non-freezing films of adsorbed water. For example, supercooled water having volumetric water properties was observed during microwave measurements of radiation power absorption through the moist silica gel with the average pore size of at the frequencies of Bordonskiy and Krylov (2012). Microwave radiation absorption was observed at the temperatures below which is probable if relaxation time of water molecules is close to oscillation period in the external electric field. The oscillation period for these frequencies is , and that corresponds to the time of free water relaxation.
Conclutions
So, a complex of the electrical measurements carried out on the moist nanoporous silicate enabling to reach deep water supercooling proves existence of the ferroelectric phase transition at about .
The following experimental data indicate that.
In MCM-41 at the temperature of we observed: a) about 100-fold increase in dielectric conductivity; b) negative resistance occurrence (fig. 3a); c) the noises related to Barkhausen effect (fig.5). We could have assumed that the phenomena observed are explained by charge redistribution occurring at the ice-liquid phase boundary during ice crystal formation, not indicating the ferroelectric phase transition. However, this assumption is rejected by our results. First, jump in dielectric conductivity, Barkhausen effect in particular, definitely indicates the ferroelectric transition. Second, if these signals had been generated by the forming ice crystals, they would have been observed in the experiment with SBA-15 (fig. 3b) at the temperature of , when water in cylindrical pores in diameter freezes. There are no such signals, and consequently, there are not any effects related to charge redistribution when boundaries form. Finally, the temperature of water freezing in MCM-41 with pore diameter and 50-70% of their filling drops to Johari (2009); Jahnert et al. (2008), i.e. water is liquid at the temperature of .
The research done showed that measurements for studying the ferroelectric state should be carried out with the imposition of the external electric field with intensity not higher than . When choosing schemes and techniques for measuring, one should consider the negative resistance of the cell containing the substance studied. The method of measuring intrinsic noises is effective for studying nonlinear properties of supercooled pore water, as in this case there is no high intensity external electric field.
Agreement of the theoretical results obtained independently Menshikov and Fedichev (2011) with the experimental findings indicates that the properties of deeply supercooled pore water can model the electrical properties of volumetric water on its supercooling, at least at .
It is obvious that research of deeply supercooled water by conventional electric measurement techniques (dielectric spectroscopy and thermal noise) would require a considerable modification and correct interpretation of the data due to occurrence of parametric phenomena in nonlinear circuits related to the ferroelectric properties.
Acknowledgements
This work was supported by the Russian Foundation for Basic Research, project No. 12-05-31052.
References
- Frunza et al. (2004) L. Frunza, H. Kosslick, I. Pitsch, S. Frunza, A. Schonhals, and et al., Studies in Surface Science and Catalysis 154, 1721 (2004).
- Sliwinska-Bartkowia et al. (2008) K. Sliwinska-Bartkowia, M. Jazdzewska, L. Huang, and K. Cubbins, Phys. Chem. Chem. Phys. 10, 4909 (2008).
- Bordonskiy and Krylov (2012) G. Bordonskiy and S. Krylov, Russian Journal of Physical Chemistry A. 86, 1682 (2012).
- Johari (2009) G. Johari, Thermochimica Acta 492, 29 (2009).
- Bordonskiy and Orlov (2011) G. Bordonskiy and A. Orlov, Condensed matter and interphases 13, 5 (2011).
- Bordonskiy et al. (2012) G. Bordonskiy, A. Gurulev, A. Orlov, and K. Schegrina, Preprint arXiv: 1204.6401v1 [cond-mat.soft] , 6 (2012).
- Fedichev et al. (2011) P. Fedichev, L. Menshikov, G. Bordonskiy, and A. Orlov, JETP Letters 94, 401 (2011).
- Angell (1983) C. Angell, Ann. Rev. of Phys. Chem. 34, 593 (1983).
- Menshikov and Fedichev (2011) L. Menshikov and P. Fedichev, Russian Journal of Physical Chemistry A. 85, 906 (2011).
- Khalil (2002) H. Khalil, Nonlinear systems (Prentice Hall, N.Y., 2002) p. 832.
- Barsukov and Macdonald (2005) E. Barsukov and J. Macdonald, Impedance Spectroscopy. Theory, experiment and applications (John Wiley & Sons, 2005) p. 608.
- Bednyakov (2011) P. Bednyakov, Measurements of dielectric properties of ferroelectric crystals and thin films by thermal noise methods, Ph.D. thesis, Moscow St. Univ. (2011).
- Limmer and Chandler (2012) D. Limmer and D. Chandler, J. Chem. Phys. 137, 044509 (2012).
- Fedichev and Menshikov (2012) P. Fedichev and L. Menshikov, Preprint arXiv: 1206.3470 [cond-mat.soft] , 3 (2012).
- Castrillon et al. (2009) S.-V. Castrillon, N. Giovambattista, I. Arsay, and P. Debenedetti, J. of Phys. Chem. B. 113, 7973 (2009).
- Schreiber et al. (2001) A. Schreiber, I. Kotelsen, and G. Findenegy, Phys. Chem. Chem. Phys. 3, 1185 (2001).
- Parfenov and Kirik (2009) V. Parfenov and S. Kirik, in IV Staverov Reading (Krasnoyarsk Univ., 2009) p. 319.
- Musevic et al. (1997) I. Musevic, A. Kityk, M. Skarabot, and R. Blinc, Phys. Rev. Lett. 79, 1062 (1997).
- Bordonskiy (1977) G. Bordonskiy, Questions of the analysis of millimeter-wave frequency converters on diodes with a Schottky barrier, Tech. Rep. TM 75049 (NASA Technical Reports, 1977).
- Webber and Dore (2004) B. Webber and J. Dore, J. of Physics: Condens. Matter 16, 5449 (2004).
- Jahnert et al. (2008) S. Jahnert, F. Chaves, G. Schaumann, and et al., Phys. Chem. Phys. 10, 6039 (2008).
- Blinov and Golo (2012) V. Blinov and V. Golo, JETP Letters 96, 475 (2012).