Spectroscopic followup of three bright halo stars selected from SDSS and GALEX photometry
Abstract
We aim to reveal the nature of the Sloan Digital Sky Survey (SDSS) stars: SDSS J100921.40+375233.9, SDSS J015717.04+135535.9, and SDSS J171422.43+283657.2, showing apparently high NUV excesses for their colors, as expected for extremely low-metallicity stars. High resolution (R=60 000) spectra of the stars with a wide wavelength coverage were obtained to determine their chemical compositions with the Tull echelle spectrograph on the 2.7 m telescope at the McDonald Observatory. We derived the spectroscopic parameters =5820125 K, = 3.90.2, and = 1.10.5 km s-1 for SDSS J100921.40+375233.9, =6250125 K, = 3.70.2, and = 4.00.5 km s-1 for SDSS J015717.04+135535.9, and =6320125 K, = 4.10.3, and = 1.50.5 km s-1 for SDSS J171422.43+283657.2, and elemental abundances were computed for 21 elements for J100921 and J171422 and for 19 elements for J015717 for the first time. We find metallicities of [Fe/H], , and for SDSS J100921.40+375233.9, J015717.04+135535.9, and J171422.43+283657.2, respectively. On the basis of calculated abundance ratios for J171422.43+283657.2 and J015717.04+135535.9, we also report that these two program stars have the expected composition of main-sequence halo turnoff stars, but with low- abundances, i.e., the [/Fe] ratio is 0.0 for J171422.43+283657.2 and 0.1 for J015717.04+135535.9. The latter one shows typical halo or thick-disk -element abundances, but has a substantial rotational line broadening and sin=40 0.5 km s-1
keywords:
Stars: abundances – Stars: atmospheresPACS:
01.30.yT. Şahin1∗,
D. L. Lambert2,
C. A. Prieto2,3,4
1Akdeniz University, Faculty of Science, Space Science and Technologies Department, 07058, Antalya, Turkey
2Department of Astronomy and The W.J. McDonald Observatory, University of
Texas, Austin, TX 78712, USA
3Instituto de Astrofísica de Canarias, 38205, La Laguna, Tenerife, Spain
4Departamento de Astrofísica, Universidad de La Laguna, 38206, La Laguna, Tenerife, Spain
1 Introduction
Stars with extremely low iron abundances are rare, and only a handful are known at [Fe/H] 111Standard notation is used for quantities [X] where [X]=(X)star-(X)⊙. (Beers & Christlieb 2005; Schörck et al. 2009). Therefore, any efforts to identify additional candidates in this regime are important. Metal-poor stars exhibit a distinct UV excess compared to higher-metallicity stars, as metal (mainly iron) line opacity becomes smaller. UV-excesses have long been used to identify halo stars in the solar neighborhood (see, e.g., Eggen, Lynden-Bell & Sandage 1962), and with the advent of the Galaxy Evolution Explorer (GALEX, Morrissey et al. 2007), UV fluxes are now available for sources down to at least over more than 25 000 square degrees of the sky, presenting us with a new opportunity to search for low-metallicity objects.
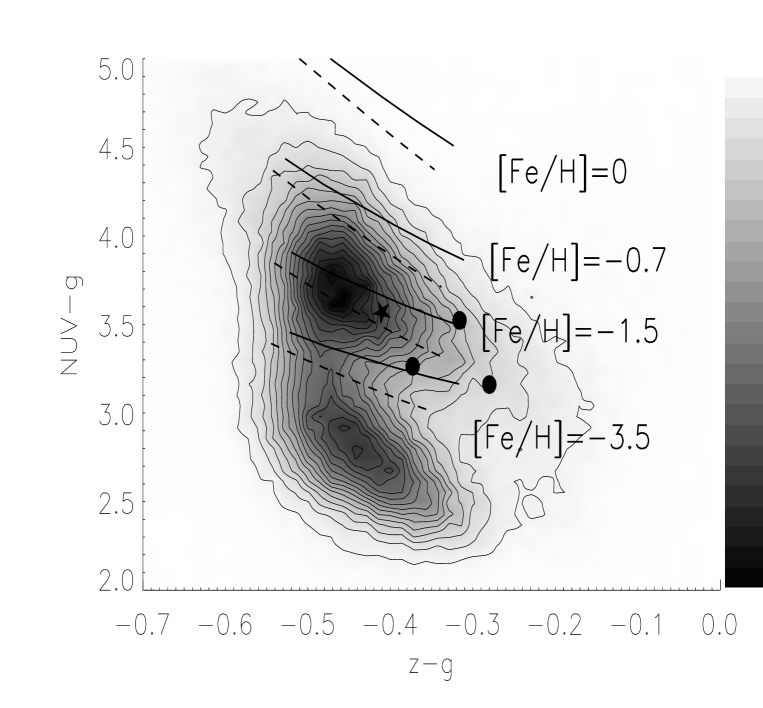
Making use of the tables of cross-matched sources between Galaxy Evolution Explorer (GALEX) and SDSS available at the Multimission Archive at the Space Telescope (MAST), we have endeavoured to identify stars that exhibit colors of extremely metal-poor stars. Figure 1, a combination of GALEX and SDSS photometry, i.e., a stellar density map in the plane of the 222Near UV (NUV, 1770-2730 Å ) and colors for a sample of some 200,000 stars, reveals two accumulations of sources: one centered at and and associated with moderately metal-poor F and G main sequence and subgiant stars. The second cluster at a similar but at is populated by white dwarfs. We have used the , and colors of BD 4708 to set the zero point of the and scales for model fluxes from Kurucz’s model atmospheres333http://kurucz.harvard.edu (Kurucz 1993). For the photometry of BD +17 4708, the fluxes are taken from Bohlin & Gilliland (2004); this star is indicated with a star symbol in Fig. 1. After this calibration, the calculated colours for a similar subgiant in the range of effective temperature between 5900–6400 K with metallicities typical of the thin disk ([Fe/H]=0), the thick disk ([Fe/H]), halo ([Fe/H]=), and ultra-low metallicity ([Fe/H]) population, are shown in Fig. 1 with solid lines: decreases as metallicity decreases. The same models for a dwarf star () correspond to the dashed lines in the figure.
Figure 1 is a resource for extracting candidate very metal-poor stars for detailed abundance analysis. A hasty search of the MAST database suggested three bright stars (Table 1) as candidates for high-resolution optical spectroscopy. Closer inspection of the database, however, revealed that SDSS photometry of the three stars is unreliable; there are saturation flags with their entries. Thus, the stars are located incorrectly in Fig. 1, as our abundance analysis demonstrates.
2 Spectroscopy
High-resolution spectra were obtained for the three stars listed in Table 1. One of them, SDSS J100921.40+375233.9 (which we tagged as SDSS J100921) is a Hipparcos star, HIP 49750, with a large proper motion. This star is listed in the New Luyten Catalogue of Stars with Proper Motions Larger than Two Tenths of an Arcsecond (Luyten 1979b) as NLTT 23519. The star, SDSS J015717.04+135535.9 (or SDSS J015717 in this paper), is included in the 2MASS catalog (2MASS J01571705+1355360). The third star, SDSS J171422.43+283657.2 (hereafter SDSS J171422) is designated as TYC 2073-1105-1, and it is also included in the 2MASS point source catalog.

The spectroscopic data for SDSS SDSS J100921 were obtained on 2009 March 15 (two frames) and for J171422 on May 9 (three frames) and for J015717 on November 21 (four frames) and December 21 (six frames) at the McDonald observatory with the 2.7 meter Harlan J. Smith reflector with the CCD-equipped Tull cross-dispersed échelle spectrograph (Tull et al. 1995). The spectra have a FWHM resolving power of with full spectral coverage from 3600 to 5300 Å , and substantial but incomplete coverage from 5300 to 10 200 Å .
Spectra of 30 minutes each on each night were combined to remove cosmic-rays hits and to improve the signal-to-noise ratio (S/N). Wavelength calibration was performed using a Th-Ar hollow cathode lamp for which the spectra were acquired before and after each of the sets of program star exposures.
Observations were reduced using the echelle reduction package in IRAF.444IRAF is distributed by the National Optical Astronomy Observatories, which is operated by the Association of Universities for Research in Astronomy (AURA), Inc., under cooperative agreement with the National Science Foundation. The bias level in the overscan area was modeled with a polynomial and subtracted. In order to correct for pixel-to-pixel sensitivity variations, a flatfield was used. Scattered light was modeled and removed from the spectrum. The spectra were optimally extracted. The individual orders were cosmic-ray cleaned up, continuum normalized, and merged into a continuous spectrum with bespoke echelle reduction software in IDL (Şahin 2008). The reduced spectra were transferred to the STARLINK spectrum analysis program DIPSO (Howarth et al. 1998) for further analysis (e.g. for equivalent width measurement). A section of the final spectrum is shown in Figure 2.
We measured the radial velocity of our targets using cross-correlation against the spectrum of Arcturus (Hinkle et al. 2000). The spectral range used for the cross-correlation was 4800-5300 Å .555In the spectra of the program stars, this region is dominated by transitions of neutral iron, titanium, and nickel. As a check, we also derived radial velocities by measuring the central wavelength of several unblended Fe i lines. These central wavelengths were compared to laboratory values (Nave et al. 1994). The cross-correlation method and the Fe i method agree with one another within 0.3 km s-1. To correct the small instrumental offsets666It is 0.2 km s-1 for SDSS J100921, 1.1 km s-1 for SDSS J171422, and 0.4 km s-1 for SDSS J015717. between the spectrum of the star and the hollow-cathode lamp, we use H2O and O2 telluric lines. The heliocentric corrections were computed with the routine heliocentric in which the routine baryvel is called (see Stumpff 1980) from the IDL Astronomy User’s Library777http://idlastro.gsfc.nasa.gov, and applied. For the SDSS stars J100921 and J171422, we determined the heliocentric radial velocities V⊙=59.30.5 km s-1 and V⊙=26.61.0 km s-1, respectively. For the SDSS star J015717, the heliocentric radial velocities measured on 2009 November 21 and December 21 are -6.61.0 km s-1 and -7.90.9 km s-1 respectively.
The model atmosphere parameters found for J100921, J015717, and J171422 are presented in Table 1.
2.1 ABUNDANCE ANALYSIS - THE MODEL ATMOSPHERES AND STELLAR PARAMETERS
Chemical abundances were calculated using the current version of the local thermodynamic equilibrium (LTE) stellar line analysis program MOOG (Sneden 1973). We use a grid of ATLAS9 model atmospheres (ODFNEW models) (Castelli & Kurucz 2003). The models are line-blanketed plane-parallel atmospheres in LTE and hydrostatic equilibrium with flux (radiative plus convective) conservation, computed with a constant microturbulent velocity ( 2 km s-1). The models are linearly interpolated for the appropriate values of the spectroscopically determined atmospheric parameters.
The original sources for the transition probabilities of the Fe i lines are listed by Lambert et al. (1996). The values for Fe ii lines are taken from Meléndez et al. (2006). These choices for the source of -values for Fe i and Fe ii lines allow one to make a direct comparison between this study and Ramírez et al. (2006), who studied BD +17 4708. The revised Fe ii line list by Meléndez et al. (2006) takes into account new laboratory measurements by Schnabel et al. (2004) and theoretical calculations by R. L. Kurucz.888See http://kurucz.harvard.edu The mean difference between the values for Fe ii lines in Lambert et al. (1996) and Meléndez et al. (2006) is just 0.03 dex.
The model parameters were determined using only spectroscopic criteria. We determined the effective temperature of the star from the condition that Fe abundance should be independent from the lower excitation potential LEP (lower excitation potential) of clean Fe i lines. Solutions for and are not very sensitive to the adopted surface gravity. The large range in lower level excitation potentials (LEP) and the large number of lines999J100921: EP = 0.0–4.8 eV, 105, 6; J171422: EP = 0.0 – 4.8, 111, 5; J015717: EP = 0.9 – 4.8, 44, 7 ensures a reliable identification of the temperature. The determination of the microturbulence velocity , was based on the condition that iron abundance should be independent of the intensity of the Fe i line. The determination of Teff and is confirmed by other elements with a large number of detected lines (e.g. Cr and Ni).
Iron is used as the primary element via ionization equilibrium to provide a Teff – log g locus which with an independent estimate of Teff is used to obtain an estimate of log g. Finally, the metallicity [Fe/H] is refined by requiring that the derived abundance be equal to that adopted for the construction of the model atmosphere for the final set of , , and .
2.2 The Balmer Lines
Balmer line profiles offer an alternative method of estimating atmospheric parameters. For the three SDSS stars, predicted profiles for H lines are computed with SYNTHE (Kurucz & Avrett 1981).
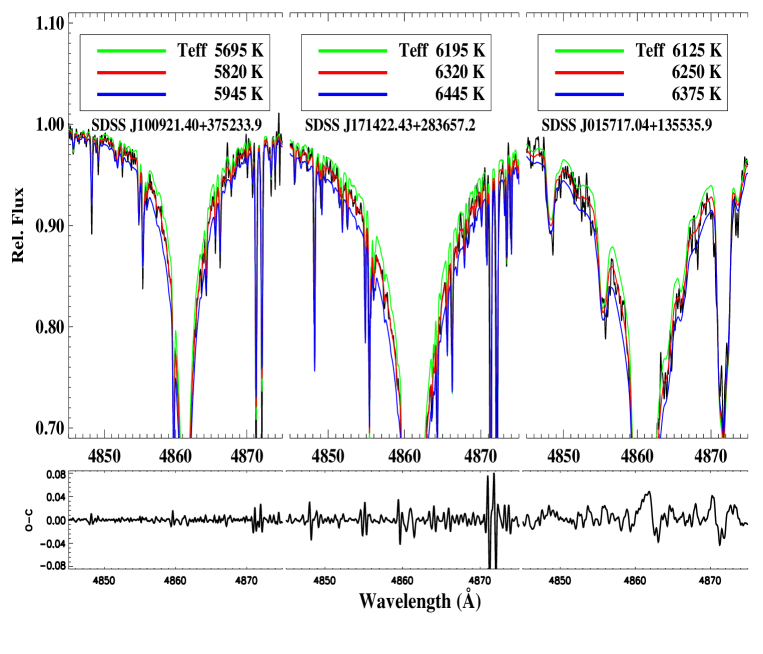
Figure 3 shows observed and predicted profiles from synthetic spectrum calculations in the spectra of SDSS J100921 for Teff from 5695 K to 5945 K with log g=3.86. For this star, the best-fitting was obtained with a Kurucz model of T5820 K. This temperature is equal to that suggested by the intersection of the Ti excitation temperature and the Ti, V, and Cr ionization equilibria and very close to the Fe excitation temperature. In Figure 3, we also illustrate the observed profiles with best-fitting theoretical line profiles correspond to effective temperatures of T6320 K and 6250 K for log g=4.12 and 3.70 and [Fe/H]=0.75 and 0.90 for the stars, J171422 and J015717, respectively. The former temperature for J171422 is fully consistent with the effective temperature from the excitation of the Fe i lines. The latter temperature for the star, J015717 is significantly cooler than the Fe excitation temperature. These estimates for the temperature are almost independent of the adopted surface gravities of the program stars. Residuals (observed minus synthesis) of the best fits to the data are also represented in Figure 3.
The temperatures obtained from Hβ lines for the SDSS stars, J100921 and J171422 agree well with the spectroscopic temperatures of the stars.
2.3 ABUNDANCE ANALYSIS - ELEMENTS AND LINES
The lines of neutral and/or singly-ionized atoms were systematically searched for using lower excitation potentials and - values as a guide. The Revised Multiplet Table(RMT) (Moore 1945) is used as starting point in this basic step. Notes on the adopted -values with comments on individual elements are presented in Appendix A. When a reference to solar abundances is necessary in order to convert our abundance of element X to either of the quantities [X/H] or [X/Fe], Asplund et al. (2009) is adopted.
-
Notes. The solar abundances () are from Asplund et al. (2009).
3 DISCUSSION
We performed the first detailed abundance analysis on SDSS J100921 and J171422 for 21 elements and on J015717 for 19 elements. A summary of the abundances for the stars is given in Table 6, where the quantities log (X), [X/H], and [X/Fe] are reported in columns two, three, and four. For the SDSS J100921 and J171422, these abundances were computed for the common lines with the model parameters reported in Table 1. Table 2, 3, and 4 list the elemental abundances for these two program stars while the abundances for the J015717 is listed in Table 5.
In this analysis, the stars, J171422 and J015717, are found to be -poor stars, i.e., the [/Fe] ratio is 0.09 for J171422 and 0.13 for J015717. Their silicon abundances agree within 0.01 dex. The -poor characteristics of these two SDSS stars are not common in the literature. The stars, BD +80 245, G4-36, and CS 22966-043 are such low- halo stars with unusually low abundances of - (Mg, Si, Ca) and neutron-capture (Sr, Y, Ba) elements (Ivans et al. 2003). The spectrum of J100921 with -element/Fe]=0.22 is slightly enriched in -elements.
The mean [/Fe] values calculated over seven (low-) halo stars of Nissen & Schuster (1997) are ranging between 0.11 - 0.24. The [/Fe] ratio for the star, J100921 is, apparently, close to that upper limit within 0.06 dex. The same ratio for J015717 is in the range. Over twenty-three turnoff halo stars of Nissen et al. (2005), we find a mean value of [Ca/Fe]=0.25 dex and define a range in [Ca/Fe] ratio: 0.11 [Ca/Fe] 0.38 (see their Table 1). The stars, J171422 ([Ca/Fe]=0.01) and J015717 ([Ca/Fe]=0.06) have apparently solar and near solar Ca abundances ratios, while J100921 with [Ca/Fe]=0.14 is found to be slightly enriched in Ca. Also, in the [Mg/Fe], [Si/Fe], and [Ti/Fe] vs. [Fe/H] planes (Figures 1 and 2 in the same paper) of Nissen & Schuster (2008), J171422 and J015717 appear to be located in a region dominated by low- stars with a decreasing trend of [/Fe] as a function of increasing [Fe/H]. The star, J100921, with [Fe/H]=-1.3, appears to be beyond the region where the halo and thick-disk stars tend to merge at [Fe/H]1.2. This star with [Mg/Fe]=0.26 also seems to lie just on the dividing line for high- and low- populations in Figure 1 of Nissen & Schuster (2010) and with [/Fe]=0.22, it is in the same region as low- stars in the lower panel of the same figure while the stars, J171422 and J015717 clearly appear to belong to the low- population. The -element abundances for apparently normal halo star J100921 are in good accord with mean abundances ratios to iron of Mg, Si, Ca, and Ti over seventeen thick-disk stars of Nissen & Schuster (2010): 0.340.02, 0.310.05, 0.290.04, and 0.250.03, respectively, within the uncertainties. Also, the star is located in the region populated by thick disk stars in Figure 12 of Reddy et al. (2006). Estimated [Ni/Fe] ratio for J100921 in Figure 2 of Nissen & Schuster (2010) with [Na/Fe]=0.26 is in excellent agreement with the star’s reported [Ni/Fe] ratio in Table 6. Accordingly, estimated [Na/Fe] ratio for J171422 with [Ni/Fe]=0.00 in the Figure 2 of the same paper is 0.3 dex and in good agreement with the star’s reported [Na/Fe] ratio.
It is obvious that [Ca/Fe] and [Ti/Fe] ratios for J171422 and J015717 do not agree with the idea of the stars being members of a thick-disk population but support the low- membership for the two stars. The estimated [Na/Fe] ratio for J015717 from Figure 1 of Nissen & Schuster (2010) with [Ni/Fe]=0.13 is in very good accord with J100921 and J171422.
Errors in model parameters do not change position of three SDSS stars dramatically but, for instance, shifting J171422 and J015717 into the regions populated by low- stars in Fig.5 and Fig.6 of Nissen & Schuster (2010) for Si, Ca, Ti, Na, Cr, i.e., an increase of 125 K in Teff of the J171422 and J015717 cause increase in abundances of Ca, Ti, Cr, Ni in the range 0.07 – 0.12 dex.
The [-element/Fe] ratios over thirty-six low- stars in the same study with [Mg/Fe]=0.140.06, [Si/Fe]=0.150.05, [Ca/Fe]=0.230.05, and [Ti/Fe]=0.140.07 not only support the low- membership for J171422 and J015717 but also reveal 0.2 dex lower Ca abundances for the two stars.
Besides the Nissen et al. studies summarized above, average abundances ratios to iron of Mg, Si, Ca, and Ti in halo stars in several selected studies, with an average value of [/Fe]=+0.35 over these four species, ([Mg/Fe]=+0.36, [Si/Fe]=+0.38, [Ca/Fe]=+0.38, and [Ti/Fe]=+0.29; Magain 1987, 1989; Gratton & Sneden 1987, 1988, 1991; Zhao & Magain 1990; Ryan et al. 1991; Nissen et al. 1994; Fuhrmann et al. 1995; McWilliam et al. 1995) indicates typical -element abundances for J100921. However, when the thick-disk sample of Reddy et al. (2006) is scrutinized, with exceptions of too high [O/Fe] and too low [Al/Fe] ratios, the star is clearly seen to resemble a thick-disk star. The unusually high O abundance of the star is indicated by the O i lines at 7770 Å and 8440 Å . The former lines will probably be affected by departures from LTE (e.g., Kiselman 1993). Fe contribution to latter group of lines is checked during synthesis analysis and seen to be negligible.
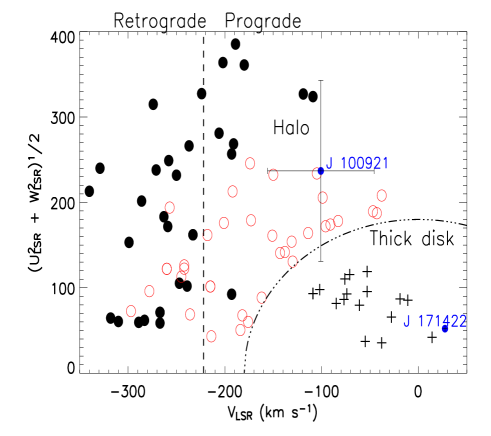
We searched for further evidence for halo and/or thick-disk memberships of the program stars using their kinematics. We calculate Galactic velocities (, , ; Johnson & Soderblom 1987) for the stars, where is directed towards the Galactic Centre, is directed in the sense of Galactic rotation (clockwise as seen from the North Galactic Pole), and is directed towards the North Galactic Pole, with proper motions and parallaxes taken from the Tycho-2 catalog (Hog et al. 2000, J171422) and the new reduction of the Hipparcos data (van Leeuwen 2007, J100921). In calculation of the velocities, , , and , relative to the local standard of rest (LSR), a solar motion of (, , )=(+7.5,+13.5,+6.8) km s-1, as derived by Francis & Anderson (2009) was assumed. The errors in the parallaxes are 50 for J100921 and larger than 90 for 171422. The radial velocities of the stars are derived from the echelle spectra.
Fig 4 shows the Toomre diagram for the thick-disk and halo stars from Nissen & Schuster (2010) with two program SDSS stars reported in the SIMBAD shown with filled (blue) circles. In the same figure, the halo stars are divided into two groups as the high- or the low- population. Relatively big errors on the parallaxes for the two program SDSS stars indicates ambiguous memberships for the stars kinematically.
4 CONCLUDING REMARKS
Two of the stars under scrutiny (SDSS J100921.40+375233.9 and J171422.43+283657.2) appear to lie close to ultra-low metallicity ([Fe/H]=3.5) population track (Fig 1), with the caveat that the SDSS photometry for them is saturated. For the third object, SDSS J015717.04+135535.9, one of the available observations place it in the ultra-low metallicity range, even though four other observations of the object indicated redder NUV colors101010Object appear to lie close to halo metallicity ([Fe/H]=1.5)., and in this case both the GALEX and the SDSS photometry were flagged as problematic. Despite of the high risk, we have followed spectroscopically these targets to explore the nature of these stars in detail.
We report that none of these SDSS stars present ultra-low metallicities. Two of the stars, J171422 and J015717 are found to be two low- halo stars. An interesting anomaly is noted for J015717.04+135535.9 which exhibits a high rotational velocity (e.g. 40 km s-1), unusual for a halo turnoff star. The star, J100921 is roughly consistent with thick-disk membership.
Appendix A ABUNDANCE ANALYSIS - ELEMENTS AND LINES
Li: The 6707 Å Li i is detected in J100921. Lithium is assumed to be purely 7Li. Then the synthetic spectrum is computed and matched to the spectrum of the star by adjusting the Li abundance to fit the 6707 Å line. For the spectrum synthesis, a line list for several ngströms around 6707 Å was compiled using Kurucz’s line list111111http://kurucz.harvard.edu. Fe i line at 6707.44 Å in the blue wing of the Li line gives no significant contribution. For J100921, we find log (Li)=1.76 and [Li/Fe]2.0 dex. The [Li/Fe] ratios of 1.21 and 2.10 for J171422 and J015717, respectively, are listed in Table 6 as upper limits.121212Uncertainties in derived lithium abundance are estimated from uncertainties in the atmospheric parameters:Teff=+125 K, log g=+0.2 cgs units, =+0.5 km s-1 lead to uncertainties of +0.08, 0.01, and 0.02.
C: Detection of C i lines was sought via the 3s3Po-3p3P multiplet with lines between 9061 Å and 9112 Å . The detected multiplet lines are presented in Table 3 and Table 5 for three SDSS stars. The -values are taken from Wiese, Fuhr & Deter (1996).
O: For J100921.40+375233.9, an abundance (O) fits the O i triplet at 7774 Å . The triplet is fitted by an abundance of (O) for the J171422. In the spectrum of J015717, only one member of the triplet being 7772 Å O i was measurable. The 8446 Å feature is also present and provides abundances reported in Table 6. The -values are taken from Wiese, Fuhr & Deter (1996).
Na: Four Na i lines were suitable for abundance analysis of J171422 (Table 3). The Na i doublet at 5688 Å is fitted by an abundance of (Na)=5.2 for the J100921. The -values are taken from C. Froese Fischer131313The MCHF (multi-configuration Hartree-Fock) collection, http://www.vuse.vanderbilt.edu/ cff/mchf collection/ who used dipole length and dipole velocity form of the LS line strength in the calculations of oscillator strengths. Achieved accuracy between the length and velocity results are quite small, of the order of 0.01 - 0.02. For J015717, the Na lines used in determination of abundances for J100921 and J171422 were mostly smeared out due to high value of the stellar rotation. In addition to smearing affect, some Na lines (e.g. Na i lines at 5688 Å and 8195 Å ) showed doubling while some were found to be heavily blended (e.g. Na i line at 8183 Å ).
Mg: For the two weak Mg i lines at 4571 Å (RMT1) and 5711 Å (RMT8), the -value are taken from G. Tachiev & C. Froese Fischer141414http://www.vuse.vanderbilt.edu/ cff/mchf collection/ and Chang & Tang (1990), respectively. In the latter source, theoretical oscillator strengths are presented.
Si: Silicon is represented solely by the Si i lines at 5708 Å (RMT10) and 5948 Å (RMT16) . For the Si lines, the -values are taken from Allende Prieto et al. (2004).
Ca: The -values for the Ca i lines listed in Table 3 and Table 5 are taken from a variety of sources including Olsen, Routly & King (1959) and Köstlin (1964) and for some, the -values listed in the NIST database are used. New measurement for the common Ca i line at 6162 Å (RMT3) by Aldenius et al. (2009) is smaller by only -0.09 dex.
Sc: The gf-values for the Sc ii lines in Table 3 and Table 5 are from Lawler & Dakin (1989) who combined radiative lifetime and branching ratio measurements.
Ti: For J100921 and J171422, several neutral and single ionized Ti lines are detected. The -values for the Ti i are taken from the NIST database. For the Ti ii lines, we take the semi-empirical -values from Pickering et al. (2001, 2002).
V: Vanadium is represented by the one weak line of RMT21 at 4444 Å The EWs for the line for J100921 and J171422 are reported in Table 3. The -values for those lines are taken from Biemont et al. (1989). For J015717, no neutral vanadium line was detectable. The ionized V lines around 3950 Å region appear to be smeared out due to high value of the stellar rotation. the star.
Cr: The gf-values for Cr i lines are taken from the NIST database in which the following references dominate as source of transition probabilities for the Cr lines listed in Table 3 and Table 5: J. M. Bridges (private communication, 1976), Blackwell et al. (1984), Tozzi, Brunner & Huber (1985), and Kostyk (1981). Sobeck et al.’s (2007) measurements are within 0.03 dex of NIST values for the common lines in Table 3 and Table 5. The -values for Cr ii lines are from NIST database.
Mn: The gf-values for Mn i lines are taken from Blackwell- Whitehead & Bergemann (2007) when available or otherwise from the NIST database. Hyperfine structure was considered for all lines with data taken from Kurucz151515http://kurucz.harvard.edu, as discussed by Prochaska & McWilliam (2000).
Fe: The original sources for the transition probabilities of the Fe i lines are listed by Lambert et al. (1996). The values for Fe ii lines are taken from Melendez et al. (2006). This revised Fe ii line list by Melendez et al. (2006) takes into account new laboratory measurements by Schnabel et al. (2004) and new theoretical calculations by R. L. Kurucz.161616See http://kurucz.harvard.edu The values reported by Melendez et al. (2006) were put onto the laboratory scale via experimental branching ratios and radiative lifetimes. The mean difference between the values for Fe ii lines in Lambert et al. (1996) and Melendez et al. (2006) is 0.03 dex.
Co: The search for Co i lines drew on the tabulation of experimental gf-values provided by Cardon et al. (1982). The Co i lines at 3995.31 Å , 4121.32 Å are present.
Ni: A dominant source of the -values for the Ni i lines is Kostyk (1982b). The -values from Doerr & Kock (1985) and Lennard et al. (1975) are also used.
Zn: Zinc is represented by the two Zn i lines of RMT2 at 4722 Å and 4810 Å . The former line is not detected in J015717 and also, the letter one could not be resolved from the background. The gf-values are from Biémont & Godefroid (1980).
Sr: The strong resonance lines of Sr ii at 4077 Å and 4215 Å are present in the spectra of J100921 and J171422. Their equivalent widths are listed in Table 4. The -values are from Brage et al. (1998).
Y: Selection of Y ii lines is based on the solar lines judged to be unblended Y ii lines in the solar spectrum by Hannaford et al. (1982) who provide accurate gf-values. The six Y lines used in the analysis of J100921 and J171422 are listed in Table 4. We present the mean Y abundances for both stars in Table 6.
Zr: Our search for Zr ii lines drew on the papers by Biémont et al. (1981) and Ljung et al. (2006) who measured accurate laboratory gf-values and conducted an analysis of Zr ii lines to determine the solar Zr abundance. The Zr ii line at 4208 Å is detected in two of the program stars: J100921 and J171422. The adopted -value for the line differs only -0.05 dex from the -value of Hannaford et al. (1981). For J015717, no zirconium line was detected.
Ba: The Ba abundance is based on the Ba ii line at 4554 Å and the lines at 5853, 6141, and 6496 Å . The gf-value adopted is the mean of the experimental values from Gallagher (1967) and Davidson et al. (1992). Hyperfine and isotopic splittings are taken into account from McWilliam (1998).
References
- (1) Abazajian K. N., et al., 2009, ApJS, 182, 543
- (2) Aldenius, M., et al., 2009, AA, 502, 989
- (3) Allende Prieto, C., et al., 2003, ApJ, 591, 1192
- (4) Alonso A., et al., 1996, AAS, 117, 227
- (5) Asplund M., et al., 2009, ARAA, 47, 481
- (6) Barklem P. S., Aspelund-Johansson J., 2005, AA, 435, 373
- (7) Beers T. C., & Christlieb N. 2005, ARAA, 43, 531
- (8) Biemont, E., & Godefroid, M., 1980, AA, 84, 361
- (9) Biemont, E., et al., 1981, ApJ, 248, 867
- (10) Biemont, E., et al., 1989, AA, 209, 391
- (11) Blackwell, D. E., et al., 1984, MNRAS, 207, 533
- (12) Blackwell-Whitehead, R., & Bergemann, M., 2007, AA, 472, L43
- (13) Bohlin R. C., Gilliland R. L., 2004, AJ, 128, 3053
- (14) Brage, T., et al., 1998, ApJ, 496, 1051
- (15) Carretta, E., et al., 2002, AJ, 124, 481
- (16) Castelli F., Kurucz R. L., 2003, Modelling of Stellar Atmospheres, 210, 20P
- (17) Cayrel R., et al. 2004, AA, 416, 1117
- (18) Chang, T. N., & Tang, X., 1990, Journal of Quantitiative Spectroscopy and Radiative Trasfer, 43, 207
- (19) Davidson, M. D., et al., 1992, AA, 255, 457
- (20) Doerr, A., & Kock, M., 1985, Journal of Quantitiative Spectroscopy and Radiative Trasfer, 33, 307
- (21) Eggen O. J., et al., 1962, ApJ, 136, 748
- (22) Fuhrmann, K., Axer, M., & Gehren, T., 1995, AA, 301, 492
- (23) Francis, C., & Anderson, E. 2009, NewA, 14, 615
- (24) Gratton, R. G., & Sneden, C., 1987, AAS, 68, 193
- (25) Gratton, R. G., & Sneden, C., 1988, AA, 204, 193
- (26) Gratton, R. G., & Sneden, C., 1991, AA, 241, 501
- (27) Hannaford, P., et al., 1982, ApJ, 261, 736
- (28) Hill G. J., et al., 2006, New Astronomy Review, 50, 378
- (29) Hinkle K., et al., 2000, Visible and Near Infrared Atlas of the Arcturus Spectrum 3727-9300 Å(San Francisco: ASP)
- (30) Høg, E., Fabricius, C., Makarov, V. V., et al., 2000, AA, 355, L27
- (31) Howarth I. D., Murray J., Mills D., Berry D. S., 1998, Starlink User Note 50
- (32) Ivans, I. I., et al., 2003, ApJ, 592, 906
- (33) Jester S., et al., 2005, AJ, 130, 873
- (34) Karlsson T., 2005, AA, 439, 93
- (35) Kiselman D., 1993, AA, 275, 269
- (36) Kurucz, R. L., Avrett, E. H., 1981, Smithsonian Astrophys. Obs. Spec. Rep., 391
- (37) Kurucz R. L., 1993, Kurucz CDROM Vol 18 (Cambridge: Smithsonian Astrophysical Observatory)
- (38) Kö stlin, H. 1964, Zeitschrift fur Physik, 178, 200
- (39) Kostyk, R. I., 1981, Astrometriia i Astrofizika, 45, 3
- (40) Kostyk, R. I., 1982, Astrometriia i Astrofizika, 46, 58
- (41) Lambert D. L., et al., 1996, ApJS, 103, 183
- (42) Lennard, W. N., et al., 1975, ApJ, 197, 517
- (43) Lindegren L., et al., 2008, in IAU Symposium, A Giant Step: from Milli- to Micro-arcsecond Astrometry (IAU Symp. 248), ed. W. J. Jin, I. Platais, & M. A. C. Perryman (Cambridge: Cambridge University Press), 217
- (44) Luyten W. J., 1979b, New Luyten Catalogue of Stars with Proper Motions Larger than Two Thenths of an Arcsecond (Minneapolis: Univ. Minnesota Press)
- (45) Magain, P., 1987, AA, 179, 176
- (46) Magain, P., 1989, AA, 209, 211
- (47) McWilliam, A., Preston, G. W., Sneden, C., & Searle, L., 1995, AJ, 109, 2757
- (48) Melendez J., Shchukina N. G., Vasiljeva I. E., Ramírez I., 2006, ApJ, 642, 1082
- (49) McWilliam, A., 1998, AJ, 115, 1640
- (50) Moore, C. E., 1945, Contributions from the Princeton Univ. Observatory, 20, 1
- (51) Morrissey P., et al., 2007, ApJs, 173, 682
- (52) Nave G., et al., 1994, ApJs, 94, 221
- (53) Nissen, P. E., et al., 1994, AA, 285, 440
- (54) Nissen, P. E., & Schuster, W. J., 1997, AA, 326, 751
- (55) Nissen, P. E., & Schuster, W. J., 2009, IAU Symposium, 254, 103
- (56) Nissen P. E., Schuster W. J., 2010, AA, 511, L10
- (57) Olsen, K. H., et al., 1959, ApJ, 130, 688
- (58) Prochaska, J. X., & McWilliam, A., 2000, ApJl, 537, L57
- (59) Reddy B. E., et al., 2006, MNRAS, 367, 1329
- (60) Ramírez I., Allende Prieto C., Redfield S., Lambert D. L., 2006, AA, 459, 613
- (61) Schörck T., et al., 2009, AA, 507, 817
- (62) Schnabel R., Schultz-Johanning M., Kock M., 2004, AA, 414, 1169
- (63) Siebert A., & the RAVE collaboration 2008, Astronomische Nachrichten, 329, 892
- (64) Sneden C., 1973, Ph.D. thesis, Univ. of Texas at Austin
- (65) Sneden C., et al., 2009, ApJs, 182, 80
- (66) Stumpff P., 1980, AAS, 41, 1
- (67) Tull R. G., et al., 1995, PASP, 107, 251
- (68) Tozzi, G. P., et al., 1985, MNRAS, 217, 423
- (69) Şahin T., 2008, Ph.D. Thesis, Queen’s University Belfast
- (70) van Leeuwen, F. 2007, AA, 474, 653
- (71) Wiese, W. L., et al., 1996, Atomic transition probabilities of carbon, nitrogen, and oxygen : a critical data compilation. Edited by W.L. Wiese, J.R. Fuhr, and T.M. Deters. Washington, DC : American Chemical Society … for the National Institute of Standards and Technology (NIST) c1996. QC 453 .W53 1996. Also Journal of Physical and Chemical Reference Data, Monograph 7. Melville, NY: AIP Press,
- (72) Windhorst R. W., et al., 1991, ApJ, 380, 362
- (73) Zhao, G., & Magain, P., 1990, AAS, 86, 85
- (74) Zhao G., Newberg H.J. 2006, astro-ph/0612034
- (75)