Crystallization in a sheared colloidal suspension
Abstract
We study numerically the crystallization process in a supersaturated suspension of repulsive colloidal particles driven by simple shear flow. The effect of the shear flow on crystallization is two-fold: while it suppresses the initial nucleation, once a large enough critical nucleus has formed its growth is enhanced by the shear flow. Combining both effects implies an optimal strain rate at which the overall crystallization rate has a maximum. To gain insight into the underlying mechanisms, we employ a discrete state model describing the transitions between the local structural configurations around single particles. We observe a time-scale separation between these transitions and the overall progress of the crystallization allowing for an effective Markovian description. By using this model, we demonstrate that the suppression of nucleation is due to the inhibition of a pre-structured liquid.
pacs:
82.70.-y, 64.60.qe, 64.70.pvI Introduction
The freezing of a disordered colloidal or nano suspension into a crystalline state with long-range order is a first-order phase transition that typically follows the nucleation and growth scenario Löwen (1994). While the stable crystalline phase is favored energetically, the interface with the disordered phase penalizes small nuclei and leads to a free energy barrier. Hence, for crystallization to commence, one has to wait for a rare fluctuation that results in a large enough critical nucleus, which subsequently grows until it spans the system. This implies that by avoiding nucleation the density of a suspension can be increased beyond the thermodynamic freezing density. Such a metastable state is called supersaturated. Simple expressions for the free energy barrier can be obtained within classical nucleation theory (CNT) Becker and Döring (1935); Frenkel (1947); Das (2011), which assumes a spherical nucleus.
Subjecting a colloidal suspension to shear flow drives the system out of thermal equilibrium. Consequently, the concept of a free-energy is no longer well-defined and, strictly speaking, CNT cannot be applied anymore. Nevertheless, sheared colloidal suspensions still crystallize but with nucleation and growth kinetics that may be significantly altered from those in equilibrium Onuki (1997); Vermant and Solomon (2005). One might even find a dynamical coexistence of liquid and solid phases Butler and Harrowell (2002, 2003). Previous studies of the effects of shear flow on the crystallization rate are not conclusive: On one side, shear-enhanced crystallization has been reported for experiments Ackerson and Pusey (1988); Yan et al. (1994); Haw et al. (1998); Amos et al. (2000); Panine et al. (2002) and numerical simulations Mokshin and Barrat (2008); Nikoubashman et al. (2011). On the other side, a suppression of nucleation has been observed experimentally Palberg et al. (1995) and numerically Butler and Harrowell (1995); Blaak et al. (2004). Others report an optimal strain rate for crystallization in supersaturated hard-sphere-like suspensions Holmqvist et al. (2005); Wu et al. (2009) and protein solutions Penkova et al. (2006). An optimal strain rate has also been reported in two dimensions for numerical simulations of Yukawa-type Cerdà et al. (2008), Ising Allen et al. (2008), and depletion-driven attractive Cerdà et al. (2008) systems, and in a three-dimensional model glass Mokshin and Barrat (2010).
Colloidal systems have the advantage that both the spatial and temporal evolution can be monitored directly in experiments via light scattering Schätzel and Ackerson (1993); Harland and van Megen (1997); Sinn et al. (2001), or in real space via confocal microscopy Gasser et al. (2001); Wu et al. (2009), see also Ref. 29 for a review. Moreover, the interaction potential between colloidal particles can be tuned Yethiraj and van Blaaderen (2003). In the limit of perfect hard-spheres, the crystallization process is driven solely by entropy and the phase diagram depends on the density only. For repulsive interactions, temperature plays a role; the density is, however, still the dominant control parameter. For a numerical treatment, molecular dynamics as well as Brownian dynamics simulations appear to be ideally suited to track the temporal development of crystalline nuclei since particle coordinates are accessible and arbitrary interaction potentials can be used. However, since nucleation is hampered by a large free-energy barrier, it is a rare event. Depending on the height of the barrier, sampling such events can range from difficult to prohibitive unless specifically tailored methods are employed. Such methods include transition path sampling Dellago et al. (2002); Pan and Chandler (2004), forward flux sampling Allen et al. (2005, 2009), and umbrella sampling Torrie and Valleau (1977); Frenkel and Smit (2002).
In this work, we present numerical results for a model colloidal suspension in three dimensions, where particles interact via hard-core exclusion plus a short-ranged Yukawa repulsion. The suspension is strongly supersaturated such that the probability for nucleation is shifted into a regime accessible by straightforward methods without making use of importance sampling schemes. Here, we employ underdamped Langevin dynamics. Although the suspension is strongly supersaturated, we observe that crystallization still proceeds via nucleation and growth. For the densities studied, small clusters appear and disappear until a cluster reaches the critical size. The following growth process is dominated by a single large cluster. We find that the time for this largest cluster to reach a specified size (larger than the critical size but smaller than the total number of particles) decreases for small strain rates but strongly increases at larger strain rates. There is, therefore, an optimal strain rate for the crystallization process. The reason is that shear flow is responsible for two competing effects: suppression of the initial formation of a critical nucleus and enhancement of its growth once it has formed. Strain rates considered here are so low that shear-induced layering plays no role Ackerson and Pusey (1988); Rastogi et al. (1996).
For unsheared liquids it has recently been emphasized that nucleation resembles a two-stage process and that pre-structuring of the liquid plays a crucial role in the formation of the critical nucleus Lutsko and Nicolis (2006); Schilling et al. (2010); Lechner et al. (2011); Russo and Tanaka (2012): Droplets of the stable phase appear preferentially in regions of the supersaturated liquid that are still amorphous but where particle have already developed a loose connectivity with their neighbors. We confirm the two-stage scenario for the model studied here and demonstrate that the main effect of the shear flow is to disrupt the formation of such a pre-structured liquid. Hence, we find that the suppressed nucleation under shear flow has its origin in the inhibition of structuring in the liquid rather than in the “demolition” of crystalline clusters. The enhanced growth rate of sufficiently large clusters can be attributed to either convection or a faster reorganization of the cluster, making it thus easier to incorporate new particles.
The paper is organized as follows. In Sec. II, we present the system and simulation details. Moreover, we describe the structural order parameters that we employ to determine the structure of the local environment of single particles. In Sec. III, we present and discuss our simulation results for both the nucleation and growth stage before we conclude in Sec. IV.
II Methods
II.1 System and simulation details
We consider a mono-disperse colloidal suspension consisting of particles in a simulation box of constant volume with volume fraction . We study two densities with corresponding box dimensions for and for . Throughout the manuscript, we measure length in units of the particle diameter and energy in units of the thermal energy , where is the temperature of the suspension and is Boltzmann’s constant. The time it takes for a particle to diffuse a distance corresponding to its diameter defines the unit of time , where is the viscosity of the solvent.
We employ underdamped Langevin dynamics given by and
| (1) |
with positions and velocities . We choose the dimensionless mass to be unity such that the relaxation time of the momenta equals the diffusive time-scale. The interaction forces are described by the potential
| (2) |
Thermal fluctuations are modeled by the stochastic forces with zero mean and correlations
| (3) |
where denotes the Kronecker symbol, the Dirac distribution, and the identity matrix. Moreover, we impose an external linear shear flow by means of a solvent velocity field entering the friction term, where is the strain rate and the unit vector in direction. In the simulations, we employ periodic boundary conditions using the Lees-Edwards sliding bricks method Allen and Tildesley (1987).
Particles interact pairwise via the repulsive Yukawa potential
| (4) |
with hard-core exclusion. The strength of the potential is given by the energy at contact , and its range is determined by the inverse screening length . The magnitude of is mainly influenced by the ion concentration in the solvent and interpolates between Coulombic (low , low ion concentration) and hard-sphere interactions (large , high ion concentration). In this study, we choose and . For this set of parameters, the freezing volume fraction is . We are interested in the influence of a weak but steady shear flow on the crystallization dynamics of colloidal suspensions under highly supersaturated conditions ( and ).
The equations of motion (1) are integrated using a version of the velocity Verlet algorithm with time step . Initial configurations for different runs are generated by equilibrating the system at low densities (). The volume fraction is then increased stepwise by rescaling the simulation box and the particle coordinates until the final volume fraction is reached. We use time steps. Once we reach the final volume fraction, we switch on the shear flow with strain rate .
II.2 Structure analysis
In order to describe the crystallization process quantitatively, we need a way to distinguish between liquid and solid structures. For the hard-core Yukawa system, the phase diagram of the equilibrium bulk structure includes, beside the liquid phase, the two crystalline structures body-centered cubic (bcc) and face-centered cubic (fcc) Robbins et al. (1988); Meijer and Frenkel (1991); Löwen (1994). In the limit of hard-sphere interaction (high ), the free-energy difference between an fcc and a hexagonal close-packed (hcp) configuration is very low Woodcock (1997). Therefore, hcp structures are likely to occur along with fcc structures, as has been observed in microgravity experiments Zhu et al. (1997). For the parameters studied here, the bulk equilibrium structure is fcc. However, in the spirit of the Ostwald step rule Ostwald (1897), intermediate structures may be of a different type. Small nuclei, e.g., have been found to belong predominantly to the bcc structure in a Lennard-Jones liquid ten Wolde and Frenkel (1999). Hence, in our analysis, we will not only discern fcc from the liquid state, but also include hcp and bcc-structures.
We employ different variants of the well-known Steinhardt order parameters Steinhardt et al. (1983) to determine the local environment of a single particle. The basic idea is to construct quantities sensitive to the rotational symmetry of the local environment of the particles. To that end, one locates the set of neighbors of the th particle with size and computes the connecting vectors of the central particle with its th neighbor, where a neighbor is defined as another particle within a range not exceeding . This range is frequently chosen as the minimum between the first and second shell in the pair correlation function. We define the complex vector
| (5) |
where the functions are spherical harmonics and , . The vectors depend sensitively on the choice of .
The first step is two distinguish fluid particles (disordered environment) from solid particles (ordered environment). To this end, we make use of a recently introduced variant of the Steinhardt order parameters that averages over the second-neighbor shell Lechner and Dellago (2008),
| (6) |
where
| (7) |
where is the set of neighboring particles including the th particle itself. Averaging the order parameter this way sharpens the distinction between different structures at the expense of spatial resolution. For , the probability distributions of for fluid and solid particles are well separated, providing a good way to discriminate these two basic structure types from each other (data not shown). We regard a particle as fluid if and as solid otherwise.
Having determined these two particle sets, we further split the fluid particles into two subsets: liquid and pre-structured. While liquid particles have a truly disordered environment, we identify particles as pre-structured that have an environment that does not qualify as solid but where nevertheless some “bonds” between particles have formed. To concretize the concept of a bond, we consider the normalized scalar product
| (8) |
with the complex conjugate of . This product defines a measure for the strength of the correlation between the surrounding structures of the th and the th particle. We regard two neighboring particles as “bonded” if ten Wolde and Ruiz-Montero (1996) and denote the number of bonds for the th particle as . While also in the liquid particles will have bonds, we consider particles that have at least bonds with neighboring particles (but still ) as pre-structured.
Finally, by employing another type of averaged order parameters Lechner and Dellago (2008)
| (9) |
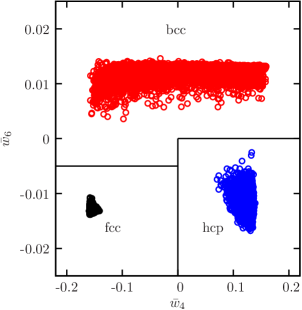
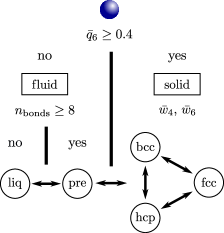
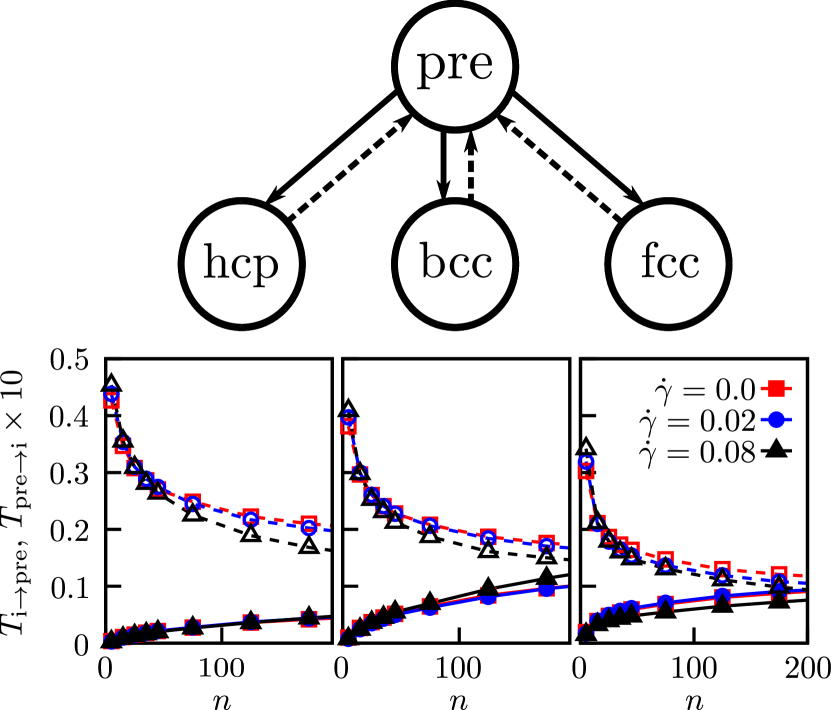
we are able to discern the different crystalline structures within the solid particles. The term in brackets is the Wigner-3-j symbol, which is related to Clebsch-Gordan coefficients. The sum runs over all combinations of , and with . Using two parameters and , we obtain a good separation between the distributions in the plane, see scatter plot in Fig. 1. The distribution is widely separated for hcp and fcc structures, while separates bcc from hcp and fcc. Hence, a solid particle is classified as fcc if and (lower left region), as hcp if and (lower right region), and as bcc otherwise (upper region). Fig. 2 illustrates the complete classification process. Moreover, it shows the possible transitions between the different structures occurring during the crystallization. Between the solid states, each of the transitions occurs. However, the transitions are biased towards an fcc environment. As we will see in the following, direct transitions from the liquid into a crystalline state are rare and the solidification of a liquid particle generally advances through a pre-structured state first.
II.3 Discrete state model
The structure analysis enables us to categorize single particles according to their local environment. For a given configuration of particle positions at time , we define an indicator function for every particle which takes on one of the five values: liquid (liq), pre-structured (pre), hcp, bcc, or fcc. The population (fraction of particles) of structure type is
| (10) |
As the suspension evolves, the structural environment of particles will of course change. To quantify these changes we define the fluxes
| (11) |
which count the number of particles that have been converted from structure into structure within the time interval . If not indicated otherwise, we set .
In the following, we consider the size of the largest cluster as an order parameter characterizing the progress of the crystallization process. Clusters are identified as the sets of all solid particles that are mutually bonded (in the sense defined above that ). We define the average population at fixed cluster size in the suspension as the conditional average
| (12) |
where averages over time and over different realizations of the crystallization process. Hence, counts how many times the largest cluster size occurs in all runs considered. Moreover, we define a transfer matrix , the components of which are given by the fluxes as
| (13) |
with normalization . The component of this stochastic matrix quantifies the fraction of particles in state that convert on average into state within the time interval . The eigenvalues of can be sorted, , with . The components of the corresponding right-hand-side eigenvectors fulfill
| (14) |
The product yields the average population a time later with . Applying the transfer matrix repeatedly describes an effective Markovian dynamics at fixed cluster size. Under this dynamics, the average population after a time has elapsed becomes
| (15) |
with implied time scales and coefficients . Hence, for , the system approaches a (quasi)-stationary average population given by . The relaxation time is determined by .
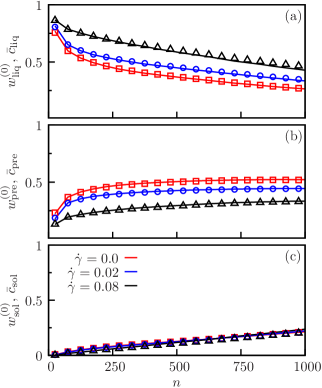
For a freely evolving suspension, the size of the largest cluster is of course not constrained to a fixed . Suppose there is a time-scale separation: After a change of the system relaxes into the quasi-stationary state before the cluster size changes again. Then the actual average populations of local structures measured in the simulations should be equal to the stationary eigenvector: . Indeed, as shown in Fig. 3, this is the case to a very good degree. Shown are the actual and quasi-stationary fractions of particles in a liquid, pre-structured, and solid local environment, where and sum the contributions of all crystalline particles. Deviations are small but increase with increasing strain rate/cluster size up to maximal at . This demonstrates that the growth of the cluster is a slow process and that the lag time is sufficient to sample the fast dynamics.
III Results
III.1 Crystallization rate
We first examine the overall effect of shear flow on the total time it takes a supersaturated suspension to crystallize. According to the protocol described above, we start with a supersaturated, fluid suspension and apply shear flow at . Once the largest cluster in the suspension has reached a size of , we stop the simulation and denote the elapsed time as . The stopping size is clearly larger than the critical nucleus size but small enough (compared to the total number of particles) to minimize finite-size effects due to the periodic boundaries. Averaging over independent runs for each strain rate, we obtain a non-monotonous dependence of on , see Fig. 4(a). For vanishing strain rate, the denser suspension takes longer to crystallize. Increasing the strain rate, decreases for both densities. For the larger density, however, the decrease is much stronger and drops even below the value for the less dense system. In both cases, we observe an optimal strain rate at which the crystallization process is fastest with and for and , respectively. At high strain rates, crystallization becomes rare. Already for and , for and , respectively, a significant part of the runs did not crystallize within time steps. We thus find an accelerated crystallization for small but nonvanishing strain rates, while for higher crystallization is more and more suppressed.
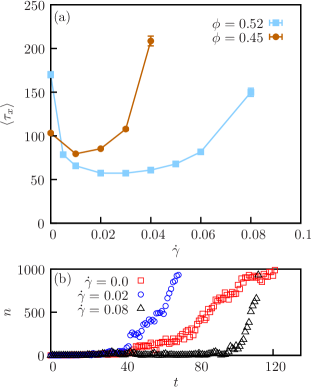
Following the development of the size of the largest cluster in the suspension in time, we find qualitative differences in the way the crystalline state is reached for different strain rates, see Fig. 4(b). Without shear flow, the system starts crystallizing quickly but the cluster grows slowly, whereas in the high-shear case, the system stays at a low for some time before crystallization is initiated. Afterwards, the largest cluster develops rapidly. Close to the optimal strain rate, we find features of both limiting cases. The crystallization process starts almost as early as without shear flow, but progresses more rapidly later on.
III.2 Shear flow suppresses nucleation
III.2.1 Growth rate
A pertinent quantity to study is the growth rate of the largest cluster
| (16) |
averaged at fixed , i. e., at a specific stage in the development of the largest cluster. The dot denotes the rate of change. In Fig. 5, we show this quantity for . For , the average growth rate is only marginally smaller than the one in the unsheared case. For , however, the growth is strongly suppressed in a broad range . This result could be due to a shear-induced inhibition of the formation, or due to a shear-induced destruction of small clusters. Either way, the likelihood for the formation of a critical cluster is strongly reduced. In the remainder of this subsection, we discuss the relevance of these mechanisms.
III.2.2 Effect on pre-structured liquid
Following the two-stage scenario for nucleation, a crystalline cluster is not likely to occur in the middle of an entirely random distribution of particles. Rather, in a region of the liquid which has already acquired a loosely ordered state, fluctuations transforming parts of this pre-structured liquid into a crystal are much more likely to occur. This scenario also holds in the system studied here: While the fraction of pre-structured particles transferring to a solid state is on the order of a few percent, , the corresponding fraction of particles converting directly from liquid to solid is smaller by more than three orders of magnitude, .
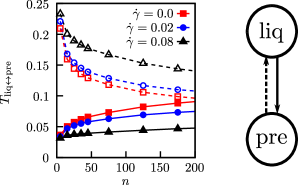
In order to study the effect of shear flow on the structure of the liquid, we record the transfer matrix components and corresponding backward component , see Fig. 6. Note that describes the fraction of particles in structure transferring on average to structure in the following time interval . Hence, the actual net current of particles changing from to depends as well on the population in these states. Hence, although , the net current of particles is still directed from liquid to pre-structured, as the liquid state contains much more particles than the pre-structured one at this early stage in the crystallization process. In Fig. 6, we show and for three different strain rates. We find that shear flow has a significant influence on the development of structure in the liquid. On the one hand, the establishment of bonds is inhibited, as can be seen from the reduced values for . On the other hand, structure in the liquid is destroyed, resulting in an enhanced value for . Consequently, compared to the unsheared case, we find a much smaller fraction of pre-structured particles both in the stationary and in the actual composition of the suspension for , see Fig. 3(b). In other words, shear flow prevents the liquid from developing a loose structure.
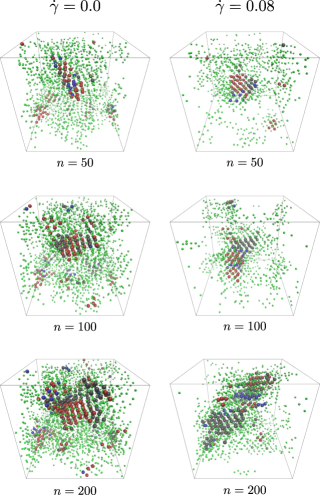
In Fig. 7, we follow the evolution of the largest crystalline cluster for strain rates and . Clearly, in both cases the crystallization process is dominated by a single cluster. Note that crystalline clusters (large spheres in blue, gray, and red) are composed of different local structures, but there seems to be no tendency for a certain structure type to form a core or surface (e.g., a core of fcc particles with a cluster-fluid interface formed by bcc particles). Crystalline clusters are surrounded by pre-structured particle (small green spheres). Although most prominent in the vicinity of solid clusters, this loose structure can be found throughout the suspension. In the strongly sheared case, however, we observe considerably less pre-structured particles than in the unsheared suspension, which indicates the shear-induced disruption of a loosely structured fluid.
III.2.3 From pre-structured to solid
Once a pre-structured but still amorphous environment has formed, the pre-structured liquid has yet to transform into a crystalline cluster. Hence, the next step is to focus on the influence of shear flow on the second part of the transition from liquid to crystal. We trace the transitions between pre-structured and the crystalline structures hcp, bcc, and fcc and show the corresponding transfer components in Fig. 8. Here, the influence of the shear flow is much smaller than for the transitions between liquid and pre-structured. The rates from the crystalline states to the pre-structured one describe the destruction of crystalline clusters. Interestingly, these are not enhanced by the shear flow but even somewhat reduced. Transitions into the different crystalline states are also barely affected by the shear flow. Hence, we find that the shear flow is not strong enough to actually destroy or shrink clusters once they have formed.
III.3 Shear flow enhances growth of clusters
III.3.1 Growth rate
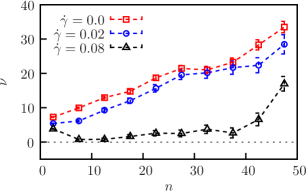
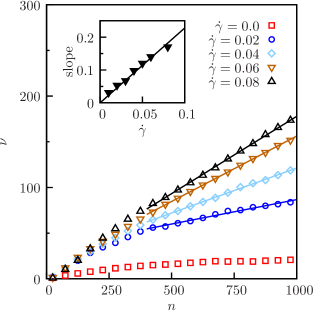
Complementary to Fig. 5, we now plot the growth rate Eq. (16) over a wider range of cluster sizes shown in Fig. 9. Note that for the larger clusters considered here, we need to increase the time interval over which the change in is evaluated to in order to separate the growth trend from the fluctuations. Compared to the unsheared case, the growth rate is enhanced significantly once the shear flow is switched on. Furthermore, for cluster sizes the growth rate is dominated by a linear term, the slopes of which themselves grow proportional with the strain rate, see inset in Fig. 9. We observe the same behavior for (data not shown). The dominant contribution of the shear flow to the growth rate for is thus a linear term of the form
| (17) |
where the proportionality constants for the slopes can be determined from least-square fits to the data. We find and for and , respectively. This strongly shear-dependent growth rate reflects the enhanced cluster growth for large times as shown in Fig. 4(b) on a more systematic level. We now discuss two possible mechanisms of how shear flow influences the growth stage of crystallization.
III.3.2 Mechanism I: Convection
A growth rate that is a linear function of might arise from convection, which can be understood as follows. We assume that particles in the vicinity of a crystalline nucleus are more likely to crystallize. Shear flow enhances the number of particles passing through this direct vicinity of the nucleus which we model as a sphere with radius . The particle current entering this sphere caused by the shear flow reads
| (18) |
with the surface of the sphere and the number density of particles in the liquid . The particle current is thus proportional to the size of the cluster, and proportional to the strain rate . Hence, we obtain the functional form of Eq. (17) where the free parameter takes into account deviations from the spherical shapes of the cluster and the probability with which particles become solid (attach to the cluster).
III.3.3 Mechanism II: bcc grows fastest
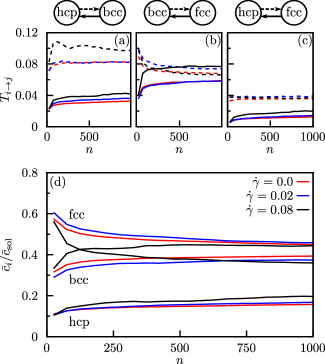
A second explanation for an enhanced growth rate might be that one of the local structures can be grown faster. In Fig. 10(a)-(c), we show the components of the transfer matrix for transitions between the three solid structures. The most prominent effect of the shear flow is that the largest strain rate strongly facilitates transitions towards the bcc structure. For the other transitions, the effect of the shear flow is weaker. The rates towards the hcp structure grow slightly with increasing and the optimal strain rate enhances transitions from bcc to fcc.
Fig. 10(d) shows the relative composition of all solid particles in the suspension as a function of cluster size . For small , most solid particles belong to fcc, which is the stable equilibrium structure. Interestingly, even in the unsheared case does the fraction of fcc particles slightly decrease as the cluster becomes bigger. In consistency with the shear dependence of the transition rates, at the optimal strain rate , the fraction of bcc particles is decreased and the number of fcc particles is increased, whereas the shear flow has almost no influence of the fraction of hcp particles. Quite in contrast, the bcc particles overtake the fcc particles at the higher strain rate and become the dominant structural type. As can be seen in the snapshots in Fig. 7, shear flow allows for much larger bcc domains. This can be interpreted as a consequence of the Ostwald step rule: in the unsheared case bcc is more easily formed but fcc is the more stable structure. Shear flow stabilizes bcc in relation to fcc and hcp, thus allowing for larger fractions of this structure type. If bcc is indeed the fastest growing structure, this mechanism would also lead to an enhanced crystalline growth.
IV Conclusions
We have performed Langevin dynamics simulations to investigate the overall effect of weak linear shear flow on the crystallization process in a model colloidal suspension. We found that the time it takes for the suspension to become solid exhibits a minimum at a finite strain rate. This can be explained as the result of two counteracting effects: at the early nucleation stage, the shear flow inhibits the formation of a critical nucleus, while at the later stage growth is enhanced. Both effects become manifest in the growth rate of the largest cluster, see Fig. 5 and Fig. 9. For larger strain rates the growth rate of small clusters is vanishingly small, whereas already small strain rates significantly speed up the growth process of the crystalline clusters after nucleation.
To gain further insight into the different mechanism, we have employed a discrete state model. The state space of this discrete model comprises the relevant local structural environments of a single particle. The microscopic environment of a particle might be fluid or solid. We further distinguish between the unordered liquid and a pre-structured liquid, which still is amorphous but where already a loose structure between neighbors has formed as determined from a bond criterion. The solid particles are classified according to their crystal structure as either fcc, bcc, or hcp; leading to a total of five discrete states. From the simulation data we can measure the populations, i.e., the fraction of particles that resides in each structure. Since the simulations advance from the initial liquid towards the full crystal, these populations change over time. We have found it convenient to calculate conditional averages with respect to the size of the largest cluster. Moreover, we have determined the fluxes between the discrete states, from which we built a transfer matrix. The quasi-stationary state of this transfer matrix agrees well with the measured actual populations.
Nucleation in our model system clearly proceeds from liquid through pre-structured to one of the crystalline structures. The effect of shear flow is to disrupt the formation of the pre-structured regions, see Fig. 6. Consequently, there are fewer pre-structured particles and the probability to form a critical nucleus is drastically lowered. On the other hand, once a critical droplet of solid particles has formed, the growth rate is enhanced by the shear flow. The emerging functional form (17) can be explained by convection alone: The flow field constantly changes the vicinity of crystalline clusters and is thus able to enhance the number of liquid particles under the “influence” of a crystalline cluster. However, the shear flow also influences the composition of the cluster, hinting at a second mechanism. We found that shear flow facilitates transitions towards the bcc structure and thus enhances the fraction of bcc particles in the cluster. The stable bulk structure is fcc and, therefore, there is a driving force towards fcc. Destabilizing fcc (or stabilizing bcc) allows for larger domains of bcc particles without the need to convert bcc, which in turn allows the cluster to grow faster.
Our data show that the depth of the minimum in the duration for the crystallization process is much smaller for a lower supersaturation. This point entails the question whether there is a lower bound on the density below which this minimum vanishes. How the existence and depth of this minimum depends on the supersaturation remains a topic for future investigation. Moreover, it would be interesting to study the influence of hydrodynamic interactions on the crystallization process Radu and Schilling (2013) under shear in general, and on the magnitude and the existence of such an optimal strain rate in particular. Beyond the insights we could gain for our specific model, we believe that the combination of techniques presented here will prove useful in the study of nucleation and related processes.
Acknowledgements.
We acknowledge financial support by Deutsche Forschungsgemeinschaft (Grant No. SE-1119/3).References
- Löwen (1994) H. Löwen, Phys. Rep. 237, 249 (1994).
- Becker and Döring (1935) R. Becker and W. Döring, Annalen der Physik 416, 719 (1935).
- Frenkel (1947) J. Frenkel, Kinetic theory of liquids (Clarendon Pr., Oxford, 1947).
- Das (2011) S. P. Das, Statistical Physics of Liquids at Freezing and Beyond (Cambridge Univ. Press, 2011).
- Onuki (1997) A. Onuki, J. Phys.: Condens. Matter 9, 6119 (1997).
- Vermant and Solomon (2005) J. Vermant and M. J. Solomon, J. Phys.: Condens. Matter 17, R187 (2005).
- Butler and Harrowell (2002) S. Butler and P. Harrowell, Nature 415, 1008 (2002).
- Butler and Harrowell (2003) S. Butler and P. Harrowell, J. Chem. Phys. 118, 4115 (2003).
- Ackerson and Pusey (1988) B. J. Ackerson and P. N. Pusey, Phys. Rev. Lett. 61, 1033 (1988).
- Yan et al. (1994) Y. D. Yan, J. K. G. Dhont, C. Smits, and H. N. W. Lekkerkerker, Physica A 202, 68 (1994).
- Haw et al. (1998) M. D. Haw, W. C. K. Poon, and P. N. Pusey, Phys. Rev. E 57, 6859 (1998).
- Amos et al. (2000) R. M. Amos, J. G. Rarity, P. R. Tapster, T. J. Shepherd, and S. C. Kitson, Phys. Rev. E 61, 2929 (2000).
- Panine et al. (2002) P. Panine, T. Naranyan, J. Vermant, and J. Mewis, Phys. Rev. E 66, 022401 (2002).
- Mokshin and Barrat (2008) A. V. Mokshin and J.-L. Barrat, Phys. Rev. E 77, 021505 (2008).
- Nikoubashman et al. (2011) A. Nikoubashman, G. Kahl, and C. N. Likos, Phys. Rev. Lett. 107, 068302 (2011).
- Palberg et al. (1995) T. Palberg, W. Mönch, J. Schwarz, and P. Leiderer, J. Chem. Phys. 102, 5082 (1995).
- Butler and Harrowell (1995) S. Butler and P. Harrowell, Phys. Rev. E 52, 6 (1995).
- Blaak et al. (2004) R. Blaak, S. Auer, D. Frenkel, and H. Löwen, Phys. Rev. Lett. 93 (2004).
- Holmqvist et al. (2005) P. Holmqvist, M. P. Lettinga, J. Buitenhuis, and J. K. G. Dhont, Langmuir 21, 10976 (2005).
- Wu et al. (2009) Y. L. Wu, D. Derks, A. van Blaaderen, and A. Imhof, Proc. Natl. Acad. Sci. U.S.A. 106, 10564 (2009).
- Penkova et al. (2006) A. Penkova, W. Pan, F. Hodjaouglu, and P. G. Vekilov, Ann. N. Y. Acad. Sci. 1077, 214 (2006).
- Cerdà et al. (2008) J. J. Cerdà, T. Sintes, C. Holm, C. M. Sorensen, and A. Chakrabarti, Phys. Rev. E 78, 031403 (2008).
- Allen et al. (2008) R. J. Allen, C. Valeriani, S. Tanase-Nicola, P. R. ten Wolde, and D. Frenkel, J. Chem. Phys. 129, 134704 (2008).
- Mokshin and Barrat (2010) A. V. Mokshin and J.-L. Barrat, Phys. Rev. E 82, 021505 (2010).
- Schätzel and Ackerson (1993) K. Schätzel and B. J. Ackerson, Phys. Rev. E 48, 3766 (1993).
- Harland and van Megen (1997) J. L. Harland and W. van Megen, Phys. Rev. E 55, 3054 (1997).
- Sinn et al. (2001) C. Sinn, A. Heymann, A. Stipp, and T. Palberg, Prog. Colloid Polym. Sci. 118, 266 (2001).
- Gasser et al. (2001) U. Gasser, E. R. Weeks, A. Schofield, P. N. Pusey, and D. A. Weitz, Science 292, 258 (2001).
- Gasser (2009) U. Gasser, J. Phys.: Condens. Matter 21, 203101 (2009).
- Yethiraj and van Blaaderen (2003) A. Yethiraj and A. van Blaaderen, Nature 421, 513 (2003).
- Dellago et al. (2002) C. Dellago, P. G. Bolhuis, and P. L. Geissler, Adv. Chem. Phys. 123, 1 (2002).
- Pan and Chandler (2004) A. C. Pan and D. Chandler, J. Phys. Chem. B 108, 19681 (2004).
- Allen et al. (2005) R. J. Allen, P. B. Warren, and P. R. ten Wolde, Phys. Rev. Lett. 94, 018104 (2005).
- Allen et al. (2009) R. J. Allen, C. Valeriani, and P. R. ten Wolde, J. Phys.: Condens. Matter 21, 463102 (2009).
- Torrie and Valleau (1977) G. M. Torrie and J. P. Valleau, J. Comput. Phys. 23, 187 (1977).
- Frenkel and Smit (2002) D. Frenkel and B. Smit, Understanding Molecular Simulation: From Algorithms to Applications (Academic Press, San Diego, 2002).
- Rastogi et al. (1996) S. R. Rastogi, N. J. Wagner, and S. R. Lustig, J. Chem. Phys. 104, 9234 (1996).
- Lutsko and Nicolis (2006) J. F. Lutsko and G. Nicolis, Phys. Rev. Lett. 96, 046102 (2006).
- Schilling et al. (2010) T. Schilling, H. J. Schöpe, M. Oettel, G. Opletal, and I. Snook, Phys. Rev. Lett. 105, 025701 (2010).
- Lechner et al. (2011) W. Lechner, C. Dellago, and P. G. Bolhuis, Phys. Rev. Lett. 106, 085701 (2011).
- Russo and Tanaka (2012) J. Russo and H. Tanaka, Sci. Rep. 2 (2012).
- Allen and Tildesley (1987) M. P. Allen and D. J. Tildesley, Computer Simulation of Liquids (Clarendon Press, Oxford, 1987).
- Robbins et al. (1988) M. O. Robbins, K. Kremer, and G. S. Grest, J. Chem. Phys. 88, 3286 (1988).
- Meijer and Frenkel (1991) E. J. Meijer and D. Frenkel, J. Chem. Phys. 94, 2269 (1991).
- Woodcock (1997) L. V. Woodcock, Nature 385, 141 (1997).
- Zhu et al. (1997) J. Zhu, M. Li, R. Rogers, W. Meyer, R. H. Ottewill, S.-. S. S. Crew, W. B. Russel, and P. M. Chaikin, Nature 387, 883 (1997).
- Ostwald (1897) W. Ostwald, Z. Phys. Chem. 22, 289 (1897).
- ten Wolde and Frenkel (1999) P. R. ten Wolde and D. Frenkel, Phys. Chem. Chem. Phys. 1, 2191 (1999).
- Steinhardt et al. (1983) P. J. Steinhardt, D. R. Nelson, and M. Ronchetti, Phys. Rev. B 28, 2 (1983).
- Lechner and Dellago (2008) W. Lechner and C. Dellago, J. Chem. Phys. 129, 114707 (2008).
- ten Wolde and Ruiz-Montero (1996) P. R. ten Wolde and M. J. Ruiz-Montero, J. Chem. Phys. 104, 9932 (1996).
- Radu and Schilling (2013) M. Radu and T. Schilling, arXiv:1301.5592 (2013).