Potassium in globular cluster stars: comparing normal clusters to the peculiar cluster NGC 241911affiliation: Based on data collected at the ESO telescopes under programmes 085.D-0205 and 165.L-0263, and at the McDonald 2.7 m telescope.
Abstract
Two independent studies recently uncovered two distinct populations among giants in the distant, massive globular cluster (GC) NGC 2419. One of these populations has normal magnesium (Mg) and potassium (K) abundances for halo stars: enhanced Mg and roughly solar K. The other population has extremely depleted Mg and very enhanced K. To better anchor the peculiar NGC 2419 chemical composition, we have investigated the behavior of K in a few red giant branch stars in NGC 6752, NGC 6121, NGC 1904, and Cen. To verify that the high K abundances are intrinsic and not due to some atmospheric features in giants, we also derived K abundances in less evolved turn-off and subgiant stars of clusters 47 Tuc, NGC 6752, NGC 6397, and NGC 7099. We normalized the K abundance as a function of the cluster metallicity using 21 field stars analyzed in a homogeneous manner. For all GCs of our sample, the stars lie in the K-Mg abundance plane on the same locus occupied by the Mg-normal population in NGC 2419 and by field stars. This holds both for giants and less evolved stars. At present, NGC 2419 seems unique among GCs.
Subject headings:
Globular clusters: general — Globular clusters: individual (NGC 6752, NGC 6121, NGC 1904, NGC 2419, NGC 6397, NGC 104, NGC 7099) — Stars: abundances — Stars: evolution — Stars: Population II1. Introduction
Galactic globular clusters (GCs) show distinctive chemical and photometric signatures that can vary over a large range from cluster to cluster. The complex chemical composition patterns of GCs are nearly non-existent among halo field stars of our Galaxy (Gratton et al., 2000) and in its satellites (Tolstoy et al., 2009). In most cases the basic nucleosynthesis is attributable to light-element proton-capture reactions in H-burning at high temperature, which leads eventually to large stellar surface variations in the abundances of C, N, O, Na, Al, and in carbon isotopic ratios. These variations can be most easily understood in terms of multiple populations within each cluster; see recent reviews by Gratton et al. (2012) and Piotto (2010) for more detailed discussion.
The most notable chemical signature of multiple populations, the Na-O anti-correlation (discovered by the Lick-Texas group, see Kraft 1994), was recently proposed as a definition of a genuine GC (Carretta et al., 2010a). Extensive surveys of light element abundances in GCs (see e.g. Carretta et al. 2006, 2010a) can be understood with a common series of evolutionary events: formation of a first stellar generation, pollution of intra-cluster medium by a fraction of the most massive stars of this generation, formation of a more spatially compact second generation, with the loss of most of the first stellar population (see e.g. D’Ercole et al. 2008; Decressin et al. 2008). These actions occurred in each GC in slightly different ways.
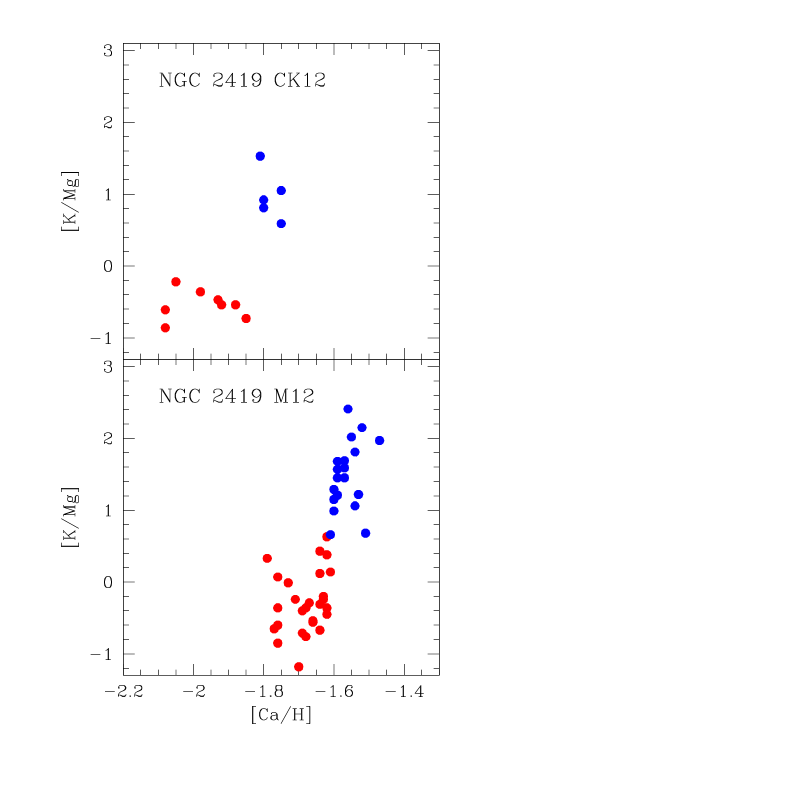
A notable example of GC abundance anomalies is NGC 2419. This is the third most massive cluster in our Galaxy (, Harris 1996). Unfortunately it is located at a very large distance (about 88 kpc, Di Criscienzo et al., 2011), and thus even its brightest members are faint ( 17) for high-resolution spectroscopy. Despite this daunting observational difficulty, the chemical compositions of many NGC 2419 red giants have been recently investigated by Cohen et al. (2010, 2011); Cohen and Kirby (2012) and Mucciarelli et al. (2012). Studies based on both medium-resolution DEIMOS (Mucciarelli et al., 2012) and high-resolution HIRES (Cohen and Kirby, 2012) spectra have revealed two populations of stars in this cluster that are characterized by large differences in magnesium and potassium abundances. One population is made of giants with normal low-metallicity overabundances of [Mg/Fe] and nearly solar [K/Fe] abundance ratios, and the other includes stars with large enhancements of K and huge depletions of Mg. Stars of the latter composition have not been observed to date in other GCs. The reality of this anti-correlation has been discussed thoroughly by Mucciarelli et al. (2012) and Cohen and Kirby (2012). Possible spurious effects due to the analysis (non-LTE corrections, contamination from telluric lines, strong velocity fields in the upper stellar atmosphere, uncertainties in the adopted atmospheric parameters) were thoroughly scrutinized in those papers, and disregarded as possible sources of this unusual Mg/K abundance pattern.
The findings by Cohen et al. and Mucciarelli et al. have stimulated theoretical studies on this peculiar cluster. In the framework of multiple populations in GCs, Ventura et al. (2012) propose that a Mg-K anti-correlation might be produced by the simultaneous activation of the Mg-Al-Si and Ar-K cycles in massive asymptotic giant branch (AGB) stars at the low metallicity of NGC 2419, provided that the relevant cross-sections and/or the efficiency of hot bottom burning are larger than commonly believed. Cohen and Kirby (2012) found a rather clear correlation between Na and Al abundances in NGC 2419, which likely results from the coupling of the NeNa and MgAl cycles that enhance Na and Al in typical GCs (e.g. Denisenkov and Denisenkova 1989; Langer et al. 1993, see also Carretta et al. 2009 for a large survey of GCs). However, they conclude that the K-Mg anti-correlation should have a different origin, because the Na-rich/Al-rich stars (the second-generation stars formed in normal GCs, see Carretta et al. 2010a) do not correspond to the stars with strongly depleted Mg and enhanced K abundances. Possibly this argument is not as conclusive as proposed by Cohen and Kirby (2012), since Ventura et al. (2012) show that stars that are extremely depleted in Mg (and K-rich) may be not very Al-rich, because at very high temperature Mg is almost entirely transformed into Si rather than Al.
More K abundances in GCs would be clearly welcome. We wish to confirm, using new data available to us, the growing evidence that NGC 2419 is really unique among the GCs in our Galaxy and discuss if the observed K-Mg anti-correlation should be included in the set of signatures typical of proton-capture burning in normal GCs. This second issue can be treated following various paths. First, to better understand the nucleosynthesis role of this poorly-studied element, it is important to derive its abundance in the same stars as those with the full set of light element (at least O, Na, Mg, Al) abundances. Takeda et al. (2009) measured the K abundance in five bright red giant branch (RGB) stars in each of the three clusters M 4, M 13 and M 15. Unfortunately, they did not provide abundances of Mg or other proton-capture elements. Their analysis only showed a remarkable small scatter in [K/Fe] ratios within each cluster, apart from one star in M 4 and one in M 13, whose peculiar abundances were explained as an effect of the increased velocity field in the upper atmospheric layers (the net result is to increase the strength of the already saturated K resonance lines). Note, however, that a reanalysis by Cohen and Kirby (2012) of the discrepant giant in M 13 found normal [Mg/Fe] and [K/Fe] values for that star. Recently, Roederer et al. (2011) measured the K abundance in six giants of M 22 (three for each sub-population in this peculiar cluster). The [K/Fe] ratio is higher in the Ca-rich, process rich group, but all six stars lie in the region populated by Mg-normal stars in NGC 2419. Second, even if found in other GCs, it would be important to verify that the K-Mg anti-correlation is a phenomenon not restricted to the photospheric abundances of giant stars only. Finding such a pattern also in relatively unevolved cluster stars would be a guarantee that no spurious (such as chromospheric activity) or evolutionary (like mixing) effects are at work.
To shed light on these issues we have looked for available observational material apt to derive accurate K abundances in (i) RGB stars, (ii) main sequence turn-off and subgiant stars of normal GCs, and (iii) field stars, both dwarfs and giants. We present K abundances in 25 red giants of four GCs (NGC 6752, NGC 6121, NGC 1904, and the most massive GC in the Galaxy, Cen), and in 17 turn-off and 35 subgiants in four GCs (NGC 6752, 47 Tuc, NGC 7099, and NGC 6397). With this wealth of data we increase the evidence that NGC 2419 is presently an unique object among GCs, and likely represents a case where proton-capture reactions occurred under very peculiar conditions, as advocated by Ventura et al. (2012). Moreover, we discuss the evidence that NGC 2419 is also different from the typical metal-poor population of dwarf galaxies.
2. Available datasets, observations and analysis
All K abundances discussed in the present paper are based on equivalent widths (EWs) of the resonance K i line at 7698.98 Å; the other observable resonance doublet transition at 7664.91 Å is heavily affected by strong absorption telluric lines. The relevant data are summarized in Table 1.
Spectra for RGB stars are mainly from our program (ESO 085.D-0.205) devoted to study Al abundances for a large sample of stars in selected GCs (see Carretta et al. 2012). We acquired fiber-fed UVES Red Arm high-resolution () spectra centered at 860 nm and covering the spectral range approximatively from 6730 to 10150 Å. From these spectra we only derive the K abundances for stars in NGC 6752, M 4, and NGC 1904; the abundances of the other elements discussed in the present paper for these giants were taken from Carretta et al. (2009) and Carretta et al. (2010c).
Spectra for six giants in Cen and for all the less-evolved stars are from the ESO Large Program 165.L-0263 (PI Gratton). Description of the observations can be found in Gratton et al. (2001); Pancino et al. (2002); Carretta et al. (2004, 2005). The spectra for M 30 were acquired with the same setup of the other clusters.
Spectra were reduced by the ESO personnel with the dedicated pipelines, by extracting one-dimensional, wavelength-calibrated spectra that were sky subtracted and shifted to zero radial velocity.
Abundances of K were also obtained for 21 field stars with metallicities [Fe/H] dex selected from the sample of stars with good parallaxes used by Gratton et al. (2000) to study the mixing episodes in low mass Pop II stars. For that project, high S/N ( 100), high resolution () spectra with very broad spectral coverage were obtained with the McDonald 2.7m telescope and Tull coudé echelle spectrograph (see Gratton et al. 2000 for further details).
Significant corrections for departures from the LTE assumption should be considered when deriving K abundances (e.g., Takeda et al., 2002, 2009). The corrections are a function of line strength, because strong lines form at shallower optical depths, where the non-LTE effects are larger. They increase with decreasing surface gravity (less frequent collisions) and increasing temperature (larger ionizing flux). Since our stars span a large range of parameters, appropriate corrections should be considered for each case. We adopted non-LTE abundance corrections which are function of temperature, gravity, metal abundance, and EW of the K i line from a multivariate interpolation through the about 900 models provided by Takeda et al. (2002)111. The same corrections were applied to the tabulated abundances of Cohen and Kirby (2012) and Mucciarelli et al. (2012). For the latter, we first corrected upward by 0.3 dex their tabulated values of [K/Fe] to recover the LTE values.
3. Results and discussion
3.1. Setting the stage: the normalization with field stars
The derived abundances for K in our program GCs are listed in Table 1, while in Table 2 we list the derived abundances for field stars. References for the adopted atmospheric parameters and abundances of the other elements are also listed. For each cluster, star-to-star errors were derived using the sensitivities of abundances to changes in the atmospheric parameters and the internal uncertainties in each parameter as listed in the original papers. For the giants in Cen we determined the sensitivities using the line list adopted in all our recent analyses (from Gratton et al. 2003), since they were not provided in Pancino et al. (2002). The [K/Fe] ratios in Tables 1 and 2 include the non-LTE corrections.
In Fig. 1 we show the run of the [K/Fe] ratio as a function of the metallicity for our program stars and the K-poor group in NGC 2419 from Cohen and Kirby (2012). The average value of [K/Fe] seems to be different from cluster to cluster, with a trend to have lower values in more metal-poor clusters. This trend is similar to what we found in field stars of our sample, regardless from the evolutionary state. The clear trend of our [K/Fe] with [Fe/H] persists even when the value for HD 2665 (one of the most metal-poor stars of our sample, with very low [K/Fe]) is excluded. The linear correlation coefficient is over 21 stars, which is highly significant. Once HD 2665 is dropped, the best fit linear regression line is . Note that while our mean value of [K/Fe]=0.10 (r.m.s.=0.12 dex) agrees fairly well with literature values from Takeda et al. (2002), Zhang et al. (2006), and Andrievsky et al. (2010), none of these studies seems to support a trend of [K/Fe] with [Fe/H]. To check if our trend is an artifact of our analysis, we examined stars in common with those previous works. We have no stars in common with the samples of Zhang et al. (2006) and Andrievsky et al. (2010), and only three stars in common with the sample by Takeda et al. (2002), listed in Table 3. Our measured s agree well with the values of Takeda et al. (2002). Moreover, using their Table 1, we verified that all the differences in the [K/Fe] ratio (even those as large as in the case of stars HD 103095 and HD 122956) can be explained by the differences in the atmospheric parameters, the NLTE corrections and, more importantly for dwarf stars, the treatment of damping. We defer a full discussion of K abundances in metal-poor field stars to a future study, where additional effects like the impact of 3-d model atmospheres will be treated in more detail. However, since they were obtained in homogeneous way, we may use present results as a reference against which K abundances in GCs are compared. Using the average [Fe/H] value of each cluster we derived an offset in [K/Fe] with respect to the linear fit of field stars. This offset was then applied to each individual value in the GC. Note that this is only a second order effect, aimed to obtain more uniform abundances of K, and does not affect in any significant way our main conclusions.
3.2. Results for globular clusters
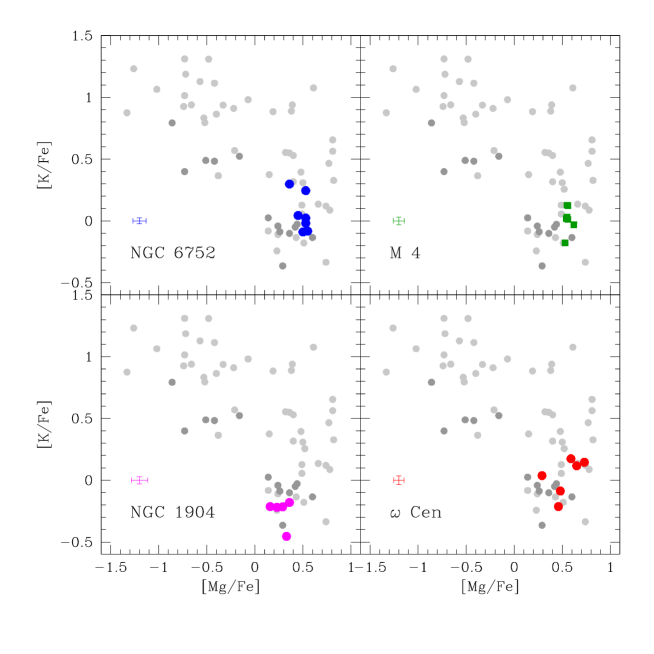
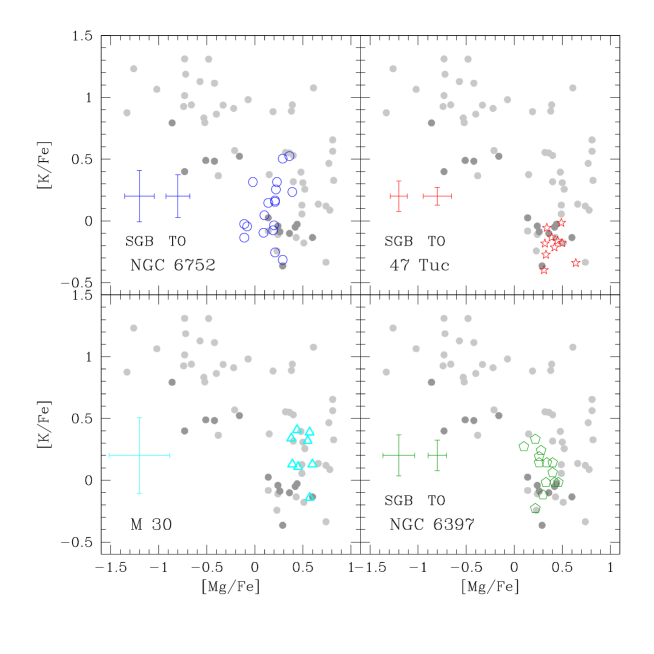
We focused on the star-to-star K abundance variations. The [K/Fe] ratios are plotted against [Mg/Fe] ratios in Fig.2 and Fig. 3. In Fig. 2 we show the abundances of giants in four clusters (NGC 6752, M 4, NGC 1904, and Cen) superimposed on these abundances for NGC 2419 from Cohen and Kirby (2012) and Mucciarelli et al. (2012). The K and Mg abundances derived for less evolved stars in NGC 6752, 47 Tuc, M 30 and NGC 6397 are in Fig. 3. Our basic result is that in all other GCs, stars occupy only the region where a population with canonical Mg overabundance and moderate K abundances lie in NGC 2419. None out of 77 stars in seven different GCs share the [Mg/Fe] and [K/Fe] ratios of the super Mg-poor/K-rich group observed in NGC 2419, not even those in Cen. This was expected for Mg (see Fig. 10 in Mucciarelli et al. 2012), but our study extends this knowledge also to K abundances222A scrutiny of unpublished K abundances was done in Cohen et al. (2011) (see their summary), who found no star similar to star S1131 in NGC 2419 in any other cluster. However, no further details are given.. Admittedly, our data show a hint of K-Mg anti-correlation in stars of NGC 6752; however the range of K abundances is very small and might be largely due to the possible offsets of the result we obtained for SGB stars with respect to TO and RGB stars. No trend is discernible for the remaining clusters (see e.g. the case of M 4, where our data confirm earlier analysis by Takeda et al. 2009), whatever evolutionary phase is considered.
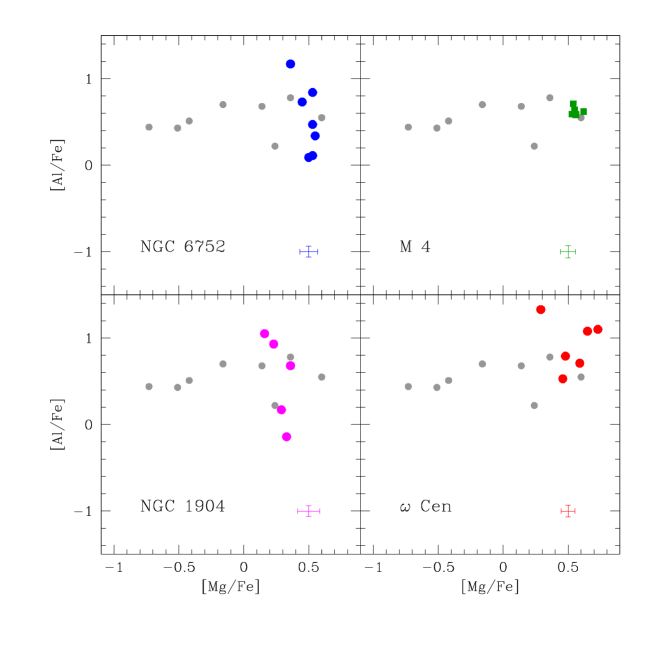
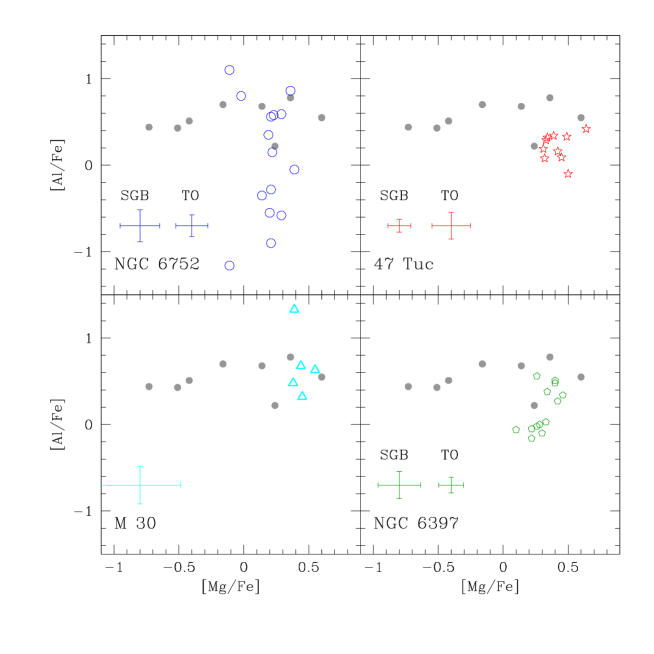
In the scenario proposed by Ventura et al. (2012), the Mg-K anti-correlation could be due to the simultaneous activation of the Mg-Al-Si and Ar-K cycles, so we might expect a corresponding large production of Al, although further capture on 27Al might transform it into 28Si (see Ventura et al. 2012). A comparison between the abundances of the elements involved in the two cycles is fundamental. The classical Al-Mg anti-correlation in our GCs is compared to the pattern in NGC 2419 in Fig. 4 and Fig. 5. Al-Mg anti-correlations of moderate extent are seen in normal clusters, most clearly in the more metal-poor GCs like NGC 6752 and NGC 1904. M 4 shows the well known small star-to-star variations in Al abundances (Ivans et al., 1999; Marino et al., 2008; Carretta et al., 2009). The present sample in Cen does not present such anti-correlation, but it is not representative of the whole cluster, because half of it was chosen by Pancino et al. (2002) to be on the metal-rich “RGB-a” branch. More extensive data shows that a clear Mg-Al anti-correlation is present in Cen (see e.g., Norris and Da Costa 1995a). For NGC 2419, Mucciarelli et al. (2012) did not measure Al abundances while Cohen and Kirby (2012) derived Al abundances for a subset of eight giants out of 13 in their sample. Al seems to be roughly constant, or even correlated to Mg, over the large range of Mg abundances in NGC 2419.
4. Is the chemical inventory in NGC 2419 really unique?
Our present results, as well as previous extensive studies of NGC 2419, obviously point to the fundamental question of why this peculiar chemical inventory is only found in this particular cluster. More massive clusters, like Cen, or GCs as metal-poor as NGC 2419 (like NGC 6397 or M 30), do not show the same extreme chemical pattern.
A possibility to be explored is that the pollution for the extreme and normal populations originated from two different sources. Let us assume that the Mg-rich population in NGC 2419 was polluted by classical core-collapse supernovae (SNe), and suppose as a working hypothesis that the part of the stellar population with low Mg abundances was instead contaminated by the ejecta of a single very peculiar SN. A possible example of this class could be the so called pair instability SN (PISN). This is a very rare event (Ren et al., 2012) theorized to end the life of a very massive population III star (see e.g. Heger and Woosley 2005). The extreme rarity of these events (Ren et al. 2012 identified 18 candidate stars possibly contaminated by PISNe over a sample of 12,300 stars with spectroscopy from SDSS) could explain why only a GC out of about 150 objects in the Galaxy shows this peculiar pattern. These stars are so massive () that one single explosion could well have provided all the of metals required for the proto-cluster from which NGC 2419 formed.
Since the majority of stars incorporating a dominant contribution from PISNs are predicted to show a strong overabundance of Ca with respect to iron, we can check this hypothesis by looking at the run of Ca and K as a function of Mg. If the scenario is correct, Ca should be enhanced and Mg depleted in the putative population contaminated by the PISN in NGC 2419. This is just what we observe (see Fig. 6) from the data of both Cohen and Kirby (2012) and Mucciarelli et al. (2012).
However, other predictions from the nucleosynthesis associated to PISN explosions clash with the observations for NGC 2419. A characteristic chemical signature associated to PISNe is a strong odd-even effect, which is clearly absent (Cohen and Kirby, 2012). Moreover, neutron-capture elements are present, while they are predicted to be absent in the ejecta of PISNs.
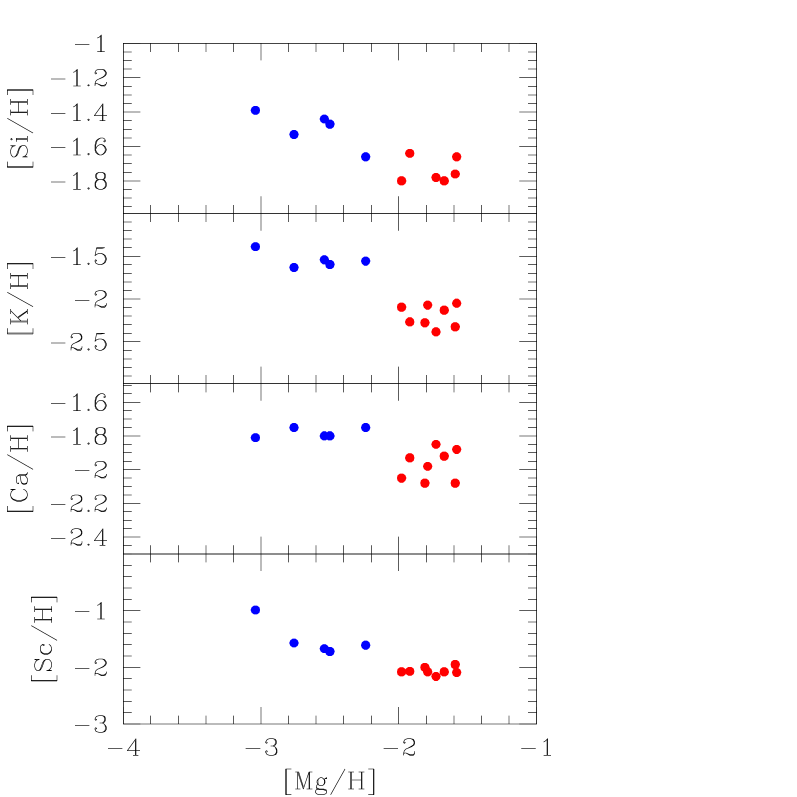
On the other hand, the relations plotted in Fig. 6 may be explained also by the hypothesis of proton-capture reactions occurring in a temperature range much higher than usually observed in more normal cluster stars (Ventura et al. 2012). In these particular circumstances, normal intermediate steps such as the production of Al from destruction of Mg are bypassed favoring the synthesis of heavier elements, and the production of K, Ca, and even Sc may be activated by p-captures on Ar nuclei. In this case, we should observe an anti-correlation between Mg and the elements enhanced in this burning, and this is just what observed in NGC 2419 from the large dataset of species analyzed by Cohen and Kirby (2012). As seen in Fig. 7, Si, K, Ca, and Sc are nicely anti-correlated with Mg. The magnitude of the effect is larger for K and Sc, but this might simply be due to Ca and Si being much more abundant species than K and Sc: transformation of even a small fraction of Ar is enough to produce large enhancements of these last elements. The scenario put forward by Ventura et al. (2012) agrees with the observations333On the other hand, in the data of M 22 (Roederer et al., 2011) K and Ca seem to be correlated. This simply corresponds to the evidence that the two populations in this cluster also differ in Ca, higher in the more metal-rich population (see Marino et al. 2011; Roederer et al. 2011). From the data of Roederer et al. (2011) we also found that K is higher in the group of stars with respect to the only stars, with the [K/Fe] ratio increasing when Sr, Y, Zr, Ba, La, Ce, Nd, and Pb (but not Eu) are more abundant..
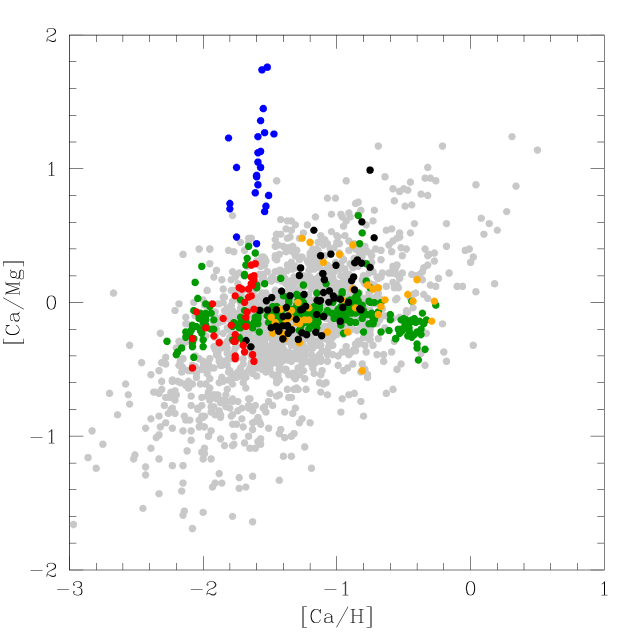
Of course, we still need to understand why the observed extreme processing is only observed in NGC 2419. This is likely not due to the small size of our sample. In fact, while there is still a paucity of determinations of K abundances, data for Ca and Mg are available for many more stars, and can then be used to check whether the products of the Ar-K-Ca cycle can be seen elsewhere. In Fig. 8 we compare the pattern observed in NGC 2419 (from the combined studies of Cohen and Kirby 2012 and Mucciarelli et al. 2012) with those of several old stellar populations. NGC 2419 stands out from both the other GCs and the dwarf spheroidals. While Cohen and Kirby (2012) suggested that being the nucleus of a disrupted dwarf galaxy could represent the explanation for the chemical signature of this cluster, no (present-day) dwarf presents Mg depletions as large as those observed in NGC 2419. On the other hand, such extremely Mg-poor stars are not observed even in the most massive GC in the Galaxy, Cen, whose Mg depletions are consistent with the pattern shown by dwarf spheroidals. Among the other GCs, only NGC 2808 shows three stars with very large Mg depletions (at [Ca/H] dex, see Fig. 8). These giants are likely the progeny of the most He-rich main-sequence population. We note, however, that not even these stars have comparably extreme [Ca/Mg] ratios as those observed in NGC 2419. The only star that resembles the Mg-poor population in NGC 2419 is one giant in M 54 (Carretta et al., 2010b), the second most massive cluster in the Milky Way, sitting in the nucleus of the disrupting dwarf galaxy Sagittarius. Unfortunately, no K abundance is available for stars in M 54; a dedicated survey in this cluster could reveal precious information.
In conclusion, more massive objects, as well as systems with similar metallicities, and stellar aggregates with different Galactocentric distances do not seem able to match the extreme chemistry shown by a sizable part of the stellar population of NGC 2419. It is possible that the peculiar combination of low metallicity, large mass, and large distance from the main parent Galaxy could explain the observed signatures of this object. More observations of K for large samples of stars, like those assembled as calibrators in Kirby et al. (2011), in a large number of GCs are required to properly explore the mass-metallicity-distance parameter space. Until then, NGC 2419 continues to be unique among GCs and old stellar systems.
References
- Andrievsky et al. (2010) Andrievsky, S.M., Spite, M., Korotin, S., et al. 2010, A&A, 509, 88
- Carretta et al. (2004) Carretta, E., Gratton R.G., Bragaglia, A., Bonifacio, P. & Pasquini, L. 2004, A&A, 416, 925
- Carretta et al. (2005) Carretta, E., Gratton R.G., Lucatello, S., Bragaglia, A., Bonifacio, P. 2005, A&A, 433, 597
- Carretta et al. (2006) Carretta, E., Bragaglia, A., Gratton R.G., Leone, F., Recio-Blanco, A., Lucatello, S. 2006, A&A, 450, 523
- Carretta et al. (2009) Carretta, E., Bragaglia, A., Gratton, R.G., Lucatello, S. 2009, A&A, 505, 139
- Carretta et al. (2010a) Carretta, E.,Bragaglia, A., Gratton, R.G., Recio-Blanco, A., Lucatello, S., D’Orazi, V., Cassisi, S. 2010a, A&A, 516, 55
- Carretta et al. (2010b) Carretta, E., Bragaglia, A., Gratton, R., Lucatello, S., Bellazzini, M., et al. 2010b, A&A, 520, 95
- Carretta et al. (2010c) Carretta, E., Bragaglia, A., Gratton, R., Lucatello, S., Bellazzini, M., D’Orazi, V. 2010c, ApJ, 712, L21
- Carretta et al. (2012) Carretta, E., Bragaglia, A., Gratton, R.G., Lucatello, S., D’Orazi, V. 2012, ApJ, 750, L14
- Cohen et al. (2010) Cohen, J.G., Kirby, E.N., Simon, J.D., Geha, M. 2010, ApJ, 725, 288
- Cohen et al. (2011) Cohen, J.G., Huang, W., Kirby, E.N. 2011, ApJ, 740, 60
- Cohen and Kirby (2012) Cohen, J.G., Kirby, E.N. 2012, ApJ, 760, 86
- Decressin et al. (2008) Decressin, T., Baumgardt, H., Kroupa, P. 2008, A&A, 492, 101
- Denisenkov and Denisenkova (1989) Denisenkov, P.A., Denisenkova, S.N. 1989, A.Tsir., 1538, 11
- D’Ercole et al. (2008) D’Ercole, A., Vesperini, E., D’Antona, F., McMillan, S.L.W., Recchi, S. 2008, MNRAS, 391, 825
- Di Criscienzo et al. (2011) Di Criscienzo, M., Greco, C., Ripepi, V. et al. 2011, AJ, 141, 81
- Gratton et al. (2000) Gratton, R.G., Sneden, C., Carretta, E., Bragaglia, A. 2000, A&A, 354, 169
- Gratton et al. (2001) Gratton, R.G. et al. 2001, A&A, 369, 87
- Gratton et al. (2012) Gratton, R.G., Carretta, E., Bragaglia, A. 2012, A&Rv, 20, 50
- Gratton et al. (2003) Gratton, R.G., Carretta, E., Claudi, R., Lucatello, S., & Barbieri, M. 2003, A&A, 404, 187
- Harris (1996) Harris, W. E. 1996, AJ, 112, 1487
- Heger and Woosley (2005) Heger, A., Woosley, S. 2005, IAU Symp. 228, 297
- Kirby et al. (2011) Kirby, E.N., Cohen, J.G., Smith, G.H., Majewski, S.R., Sohn, S.T., Guhathakurta, P. 2011, ApJ, 727, 79
- Kraft (1994) Kraft, R. P. 1994, PASP, 106, 553
- Ivans et al. (1999) Ivans, I.I., Sneden, C., Kraft, R.P., Suntzeff, N.B, Smith, V.V., Langer, G.E., Fulbright, J.P. 1999, AJ, 118, 1273
- Langer et al. (1993) Langer, G.E., Hoffman, R., & Sneden, C. 1993, PASP, 105, 301
- Marino et al. (2008) Marino, A.F., Villanova, S., Piotto, G., Milone, A.P., Momany, Y., Bedin, L.R., Medling, A.M. 2008, A&A, 490, 625
- Marino et al. (2011) Marino, A.F., Sneden, C., Kraft, R.P. et al. 2011, A&A, 532, A8
- Mucciarelli et al. (2012) Mucciarelli, A., Bellazzini, M., Ibata, R., Merle, T., Chapman, S.C., Dalessandro, E., Sollima, A. 2012
- Norris and Da Costa (1995a) Norris, J.E., & Da Costa, G.S. 1995a, ApJ, 447, 680
- Norris and Da Costa (1995b) Norris, J.E., & Da Costa, G.S. 1995b, ApJL, 441, L81
- Pancino et al. (2002) Pancino, E., Pasquini, L., Hill, V., Ferraro, F.R., Bellazzini, M. 2002, ApJ, 568, L101
- Piotto (2010) Piotto, G., 2010, PKAS, 25, 91
- Ren et al. (2012) Ren, J., Christlieb, N, Zhao, G. 2012, RAA, 12, 5
- Roederer et al. (2011) Roederer, I.U., Marino, A.F., Sneden, C. 2011, ApJ, 742, 37
- Takeda et al. (2002) Takeda, Y., Okhubo, M., Sadakane, K. 2002, PASJ, 54, 451
- Takeda et al. (2009) Takeda, Y., Kaneko, H., Matsumoto, N., Oshino, S., Ito, H., Shibuya, T. 2009, PASJ, 61, 562
- Tolstoy et al. (2009) Tolstoy, E., Hill, V., Tosi, M. 2009, ARA&A, 47, 371
- Ventura et al. (2012) Ventura, P., D’Antona, F., Di Criscienzo, M., Carini, R., D’Ercole, A., Vesperini, E. 2012, ApJ, 761, L30
- Zhang et al. (2006) Zhang, H.W., Gehren, T., Butler, K., Shi, J.R., Zhao, G. 2006, A&A, 457, 645

| star | GC. | evol. | S/N | Teff | logg | [Fe/H] | vt | EW7698 | [K/Fe] | [Mg/Fe] | [Al/Fe] | ref. | ref. |
|---|---|---|---|---|---|---|---|---|---|---|---|---|---|
| stage | K | dex | dex | km s-1 | mÅ | NLTE | dex | dex | par.atm. | abund. | |||
| 435 | NGC 0104 | SGB | 40 | 5190 | 3.84 | 0.63 | 0.00 | 118.2 | 0.07 | +0.31 | +0.19 | (a) | (1) |
| 456 | NGC 0104 | SGB | 40 | 5142 | 3.84 | 0.68 | 0.50 | 136.3 | +0.13 | +0.32 | +0.08 | (a) | (1) |
| 433 | NGC 0104 | SGB | 40 | 5106 | 3.84 | 0.74 | 1.05 | 158.2 | +0.28 | +0.49 | +0.33 | (a) | (1) |
| 478 | NGC 0104 | SGB | 30 | 5118 | 3.84 | 0.56 | 0.00 | 138.8 | +0.10 | 0.05 | (a) | (1) | |
| 201600 | NGC 0104 | SGB | 40 | 5160 | 3.84 | 0.61 | 0.70 | 136.3 | +0.06 | +0.33 | +0.29 | (a) | (1) |
| 429 | NGC 0104 | SGB | 35 | 5081 | 3.84 | 0.61 | 1.04 | 160.0 | +0.20 | +0.39 | +0.34 | (a) | (1) |
| 201075 | NGC 0104 | SGB | 40 | 5165 | 3.84 | 0.64 | 0.70 | 138.6 | +0.11 | +0.42 | +0.16 | (a) | (1) |
| 206415 | NGC 0104 | SGB | 40 | 5112 | 3.84 | 0.67 | 1.05 | 161.0 | +0.26 | +0.34 | +0.32 | (a) | (1) |
| 1012 | NGC 0104 | TO | 30 | 5832 | 4.05 | 0.65 | 1.07 | 119.6 | +0.16 | +0.45 | +0.09 | (a) | (1) |
| 1081 | NGC 0104 | TO | 45 | 5832 | 4.05 | 0.66 | 1.07 | 118.9 | +0.14 | +0.50 | 0.10 | (a) | (1) |
| 975 | NGC 0104 | TO | 40 | 5832 | 4.05 | 0.62 | 1.07 | 129.9 | +0.27 | 0.19 | (a) | (1) | |
| 482 | NGC 0104 | SGB | 45 | 5090 | 3.84 | 0.62 | 0.84 | 139.8 | 0.01 | +0.64 | +0.42 | (a) | (1) |
| 113 | NGC 1904 | RGB | 154 | 4430 | 1.34 | 1.54 | 1.66 | 137.0 | 0.15 | +0.16 | +1.05 | (b) | (2) |
| 185 | NGC 1904 | RGB | 119 | 4596 | 1.63 | 1.55 | 1.73 | 127.0 | 0.12 | +0.36 | +0.68 | (b) | (2) |
TO=turnoff; SGB=subgiant; RGB=red giant branch.
(a)=Carretta et al. (2004)
(b)=Carretta et al. (2009)
(c)=Pancino et al. (2002)
(d)=Gratton et al. (2001)
(e)=unpublished/this work.
(1)=Carretta et al. (2004: Mg, Al)
(2)=Carretta et al. (2009: Mg, Al)
(3)=Pancino et al. (2002: Fe)
(4)=this work (Mg, Al)
(5)=Gratton et al. (2001)
(6)=Carretta et al. (2005)
| star | Teff | logg | [Fe/H] | vt | EW7698 | [K/Fe] | evol. |
|---|---|---|---|---|---|---|---|
| K | dex | dex | km s-1 | mÅ | NLTE | stage | |
| HD 2665 | 5061 | 2.35 | 1.95 | 1.50 | 37.7 | -0.57 | RGB-bump |
| HD 19445 | 6047 | 4.51 | 1.97 | 0.80 | 21.0 | -0.09 | MS |
| HD 23439 | 5140 | 4.48 | 0.99 | 0.50 | 155.0 | 0.34 | MS |
| HD 25329 | 4840 | 4.85 | 1.69 | 0.50 | 121.0 | 0.20 | MS |
| HD 45282 | 5344 | 2.99 | 1.37 | 1.20 | 91.0 | 0.04 | lower-RGB |
| HD 64090 | 5530 | 4.70 | 1.51 | 0.20 | 59.0 | -0.09 | MS |
| HD 74462 | 4658 | 1.56 | 1.37 | 1.40 | 144.0 | 0.20 | upper-RGB |
| HD 83212 | 4533 | 1.45 | 1.41 | 1.80 | 161.0 | 0.07 | upper-RGB |
| HD 87140 | 5157 | 3.01 | 1.73 | 1.30 | 87.0 | 0.15 | lower-RGB |
| HD 94028 | 6061 | 4.34 | 1.40 | 1.10 | 64.0 | 0.06 | MS |
| HD 103095 | 5152 | 4.77 | 1.18 | 0.50 | 121.5 | 0.08 | MS |
| HD 105546 | 5147 | 2.45 | 1.47 | 1.60 | 113.0 | 0.15 | RHB |
| HD 110885 | 5382 | 2.54 | 1.45 | 1.90 | 107.0 | 0.05 | RHB |
| HD 111721 | 4995 | 2.52 | 1.27 | 1.30 | 122.0 | 0.16 | lower-RGB |
| HD 122956 | 4670 | 1.63 | 1.64 | 1.65 | 120.8 | -0.02 | upper-RGB |
| HD 141531 | 4335 | 1.11 | 1.63 | 1.50 | 152.0 | 0.09 | upper-RGB |
| HD 194598 | 6046 | 4.31 | 1.05 | 0.80 | 81.0 | 0.12 | MS |
| HD 201891 | 5991 | 4.30 | 1.04 | 1.10 | 101.0 | 0.30 | MS |
| LTT 10733 | 5757 | 4.37 | 0.92 | 1.10 | 115.0 | 0.23 | lower-RGB |
| LTT 11819 | 5399 | 3.33 | 2.00 | 1.00 | 42.0 | -0.12 | lower-RGB |
| BD +23 3912 | 5845 | 3.91 | 1.40 | 1.20 | 76.5 | 0.13 | MS |
| star (HD) | Teff | logg | [Fe/H] | vt | EW7698 | [K/Fe] | Teff | logg | [Fe/H] | vt | EW7698 | [K/Fe] |
|---|---|---|---|---|---|---|---|---|---|---|---|---|
| Takeda et al. | This work | |||||||||||
| 103095 | 5000 | 4.50 | 1.15 | 1.00 | 118.0 | 0.15 | 5152 | 4.77 | 1.18 | 0.50 | 121.5 | +0.08 |
| 122956 | 4660 | 1.75 | 1.93 | 1.70 | 120.8 | +0.57 | 4670 | 1.63 | 1.64 | 1.65 | 120.8 | 0.02 |
| 201891 | 5827 | 4.43 | 1.04 | 1.60 | 101.4 | +0.23 | 5991 | 4.30 | 1.04 | 1.10 | 101.0 | +0.30 |