In-plane optical spectroscopy study on FeSe epitaxial thin film grown on SrTiO3 substrate
Abstract
We perform in-plane optical spectroscopy measurement on (00l) FeSe thin-film grown on SrTiO3 substrate by pulsed laser deposition method. The study indicates that the low frequency conductivity consists of two Drude components, a broad one which takes up most of the spectral weight and a very narrow one roughly below 100-150 cm-1 . The narrow Drude component locates at so low frequencies that no such behavior was observed in iron pnictides. The overall plasma frequency is found to be smaller than the FeAs based compounds, suggesting a stronger correlation effect. Similar to iron pnictides, a temperature-induced spectral weight transfer is observed for FeSe. However, the relevant energy scale is lower. Additionally, different from a recent ARPES measurement which revealed a spin density wave (SDW) order at low temperature for FeSe thin films grown on SrTiO3 substrate, no signature of the band structure reconstruction arising from the formation of the SDW order is seen by optical measurement in the thick FeSe films.
pacs:
74.25.Gz, 74.70.XaThe binary -FeSe with the PbO structure is a key member of the family of high-Tc iron pnictide and chalcogenide superconductors. Its structure comprises stacks of edge-sharing FeSe4 tetrahedra, similar to that of FeAs layers in the family of the iron pnictide superconductors, but lacking charge-reservoir layers. FeSe is thus the simplest Fe-based superconductor. The undoped FeSe exhibits superconductivity with Tc=8 KMK Wu 11 . Upon applying pressure, Tc dramatically rises to 37 K 11 p . Recent studies on single layer FeSe thin film grown on SrTiO3 substrate by molecular beam epitaxy (MBE) method gave a hint that the Tc may even exceed 65 K QYWang ; 65-ARPES ; 65K ; SYTan . It is widely expected that investigation of binary FeSe will provide important clues to elucidate the superconducting mechanism of iron-based superconductors.
Theoretical calculations indicate that -FeSe has a two dimensional electronic structure similar to that of the Fe-pnictides with cylindrical electron sections at the zone corner and hole sections at the zone centerSubedi ; TX theory ; Moon . Therefore, a similar spin density wave (SDW) order with a collinear antiferromagnetic structure was predictedTX theory ; Moon . However, no experimental evidence for the presence of such SDW order was indicated in earlier experiments on polycrystalline samplesDJSingh . Single crystal growth of pure FeSe turns out to be difficult due to the very narrow phase formation rangeSB Zhang ; Cava2 ; MK3 ; Patel crystal 101 ; Petrovic 101 . The reported plate-like single crystals grown by using ACl (A=Li, Na, K) as flux usually contain secondary phase and quite often have a (101) surfacePetrovic 101 , making it very difficult to study the intrinsic in-plane properties. As a result, pure FeSe was far less studied than other Fe-based superconductors, particularly by spectroscopic techniques. On the other hand, recent studies indicate that the epitaxial growth of thin films on SrTiO3 substrate by MBE method could yield high quality (00l) FeSe samplesQYWang ; 65-ARPES ; 65K ; SYTan , making it ideal for studying in-plane properties. Interestingly, a very recent angle resolved photoemission spectroscopy (ARPES) measurement SYTan on such FeSe thin films indicated that, except for the single layered FeSe film, the band structure at low temperature is very similar to those observed for the parent compounds of FeAs-based systems, e.g. BaFe2As2 and NaFeAs in the SDW stateDL Feng 122split ; DL Feng 11SDW , yielding evidence for the formation of collinear antiferromagnetic structure. It was also found that the SDW order temperature decreases with increasing the thin film thickness, which was ascribed to the lattice relaxation effect. The thick thin films (over 35 monolayers) resemble the bulk samples but still have magnetic SDW ground state SYTan .
Optical spectroscopy is a powerful bulk technique to investigate charge dynamics and band structure of materials as it probes both free carriers and interband excitationsDressel . In particular, it yields direct information about formation of energy gaps. Infrared spectroscopy studies on the parent compounds of Fe-pnictides (including systems in 122, 1111, 111) provide clear evidence for the SDW gap formations in the ordered stateWZ Hu 122 ; T Dong ; WZ Hu 111 . It would be very interesting to investigate the charge dynamic of binary -FeSe to see if similar gap opening effect exists by bulk probe technique. It should be also very helpful to compare the charge dynamical properties of FeSe with other Fe-pnictide and chalcogenide superconductors. In this work, we present the first optical spectroscopy study on the in-plane properties of -FeSe thin film grown on SrTiO3 substrate.
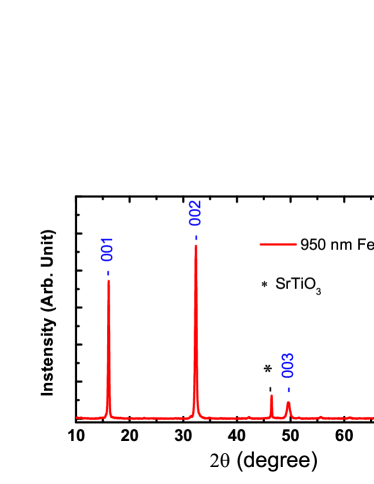
The thin film samples used in this study were obtained by the pulsed laser molecular beam epitaxy on a (001) SrTiO3 substrate. The advantage of this thin film growth technique is that it is easy to grow relatively thick films. The laser energy, repetition, substrate temperature and pressure are 250 mJ/pulse, 10 Hz, 4000C and 310-8 torr, respectively. The films had been deposited for 7 hours, resulting in a thickness of 950 nm. The epitaxy growth of the film is confirmed by the X-ray diffraction measurement, as shown in Fig. 1. Besides the diffractions lines from the SrTiO3 substrate, only FeSe (00l) diffraction peaks are present in the pattern. The pattern indicates that the film has an ab-plane surface. Note that the epitaxial growth of the film depends strongly on the substrate. If the film is grown on the MgO substrate, the film would have a (101) crystal surface MKfilm .
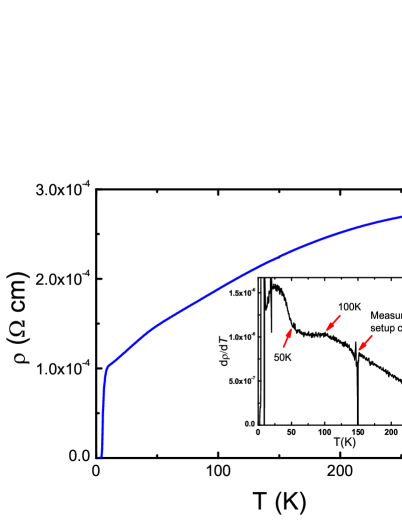
Figure 2 shows the in-plane resistivity measured in a Quantum Design PPMS system. The resistivity shows a superconducting transition temperature about 7 K, close to the bulk Tc. The inset shows the temperature dependent derivative of the resistivity. A kink feature could be observed near 100 K, being similar to the report on polycrystalline samples YJSong , which were usually linked with the weak structural distortion. A further increase of the slope is seen near 50 K, as evidenced more clearly from the derivative plot.
The optical reflectance measurements were performed on a combination of Bruker IFS 80v/s and 113v spectrometers in the frequency range from 20 to 25000 cm-1. An in situ gold and aluminium overcoating technique was used to get the reflectivity R(). The real part of conductivity is obtained by the Kramers-Kronig transformation of R().
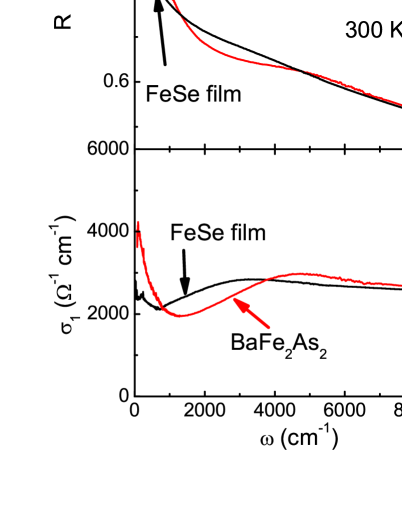
Figure 3 shows the room temperature optical reflectance R() (upper panel) and conductivity (lower panel). No leakage from the SrTiO3 substrate is detected. The overall spectral lineshapes are similar to iorn pnictides, e.g. BaFe2As2. As a comparison, we have included the room-temperature reflectance data of BaFe2As2 in the figure WZ Hu 122 . The reflectance drops quickly with frequency at low- region, then merges into the high values of a background contributed mostly from the incoherent carriers and interband transitions. However, a clear difference between FeSe and BaFe2As2 could be identified: the reflectance of FeSe at low frequency range (below 1200 cm-1 ) is apparently lower than that of BaFe2As2, but reversed at higher frequencies. This leads to smaller free carrier spectral weight but enhanced spectral weight in the frequency range between 1000 4000 cm-1 in .
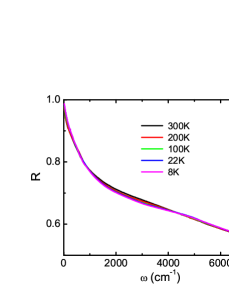
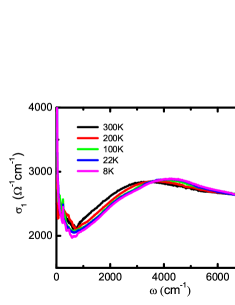
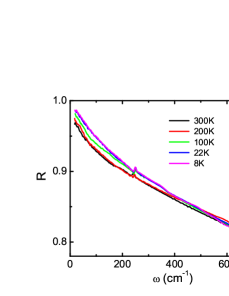
The temperature dependent optical reflectance R() and conductivity are shown in Fig. 4. The upper panels ((a) and (b)) show the spectra over broad frequencies (up to 8000 cm-1 , 1 eV), the lower panels ((c) and (d)) are the expanded plots at low frequencies. From the lower panels, we can see a phonon mode at 240 cm-1 at room temperature, which shifts slightly to higher frequency at low temperature (248 cm-1 at 8 K) and also becomes more visible. The phonon mode is commonly seen in the in-plane infrared measurement on FeAs(Se)-based single crystal samples and ascribed to the in-plane displacements of Fe-As(Se) atoms phonon 122 . The mode appears at higher frequency than that observed at 187 cm-1 for Fe1.03Te and 204 cm-1 for FeTe0.55Se0.45 samples homes 11 . This is due to the reduced mass of Se atom as compared with Te atom. For FeAs-based compounds, the mode appears at slightly higher energy scale, e.g. 253 cm-1 for BaFe2As2 at 300 K WZ Hu 122 ; phonon 122 . The clear observation of this in-plane phonon mode is an indication of good quality of the sample.
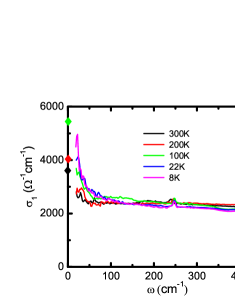
It is tempting to estimate the Drude weight or plasma frequency of the FeSe sample and compare it with other iron pnictides/chalcogenides. The spectrum shows very weak frequency-dependent behavior below roughly 700800 cm-1 . However, a sharp and narrow component develops below 100150 cm-1 (see Fig. 3 (d)). The spectra are more similar to FeTe or FeTe0.55Se0.45 single crystals GFChen ; homes 11 at low temperature than BaFe2As2 or other Fe-pnictides WZ Hu 122 ; phonon 122 ; T Dong ; WZ Hu 111 . If we consider only the sharp and narrow component below 100150 cm-1 as the Drude component, the slowly decreasing spectrum above it as incoherent, we may underestimate the plasma frequency. So we assume two components contribute to the Drude spectral weight: an extremely narrow one below 150 cm-1 and a broad one contribute to the rather slowly decreasing conductivity between 150 and 800 cm-1 . Then, we can analyze the data using a Drude-Lorentz model in a way similar to what we did for 122-type crystals, WZ Hu 122
| (1) |
where is the dielectric constant at high energy, and the middle and last terms are the Drude and Lorentz components, respectively.
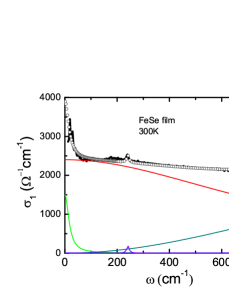

We find that the optical conductivity data could be reasonably reproduced by this approach. Figure 4 shows the data at 300 K together with the components in the Drude-Lorentz analysis. Panel (a) shows the spectral data at low frequencies, while panel (b) shows the data over broad frequencies up to 8000 cm-1 . The parameters of two Drude components are: =1300 cm-1 , =20 cm-1 , and =10900 cm-1 , =840 cm-1 at 300 K. At 8 K, those parameters become =2700 cm-1 , =16 cm-1 , and =10600 cm-1 , =830 cm-1 . Then, the overall plasma frequency could be calculated as =(+)1/211000 cm-1 (1.36 eV) for different temperatures. This value is somewhat smaller than that in BaFe2As2 (about 1.6 eV)WZ Hu 122 . In density functional calculations (DFT), the plasma frequency of FeSe is slightly higher than 3 eV ZPYin . In comparison with this value, we find the band renormalization factor / 5, which is larger than BaFe2As2. On the other hand, the value is close to that obtained by a combination of density functional theory and dynamical mean field theory where electron correlation effect has been properly taken into accountZPYin ; Ai theoretical . The agreement between experimentally obtained values and those from such theoretical calculations for Fe pnictides was already well documented ZPYin .
The plasma frequency could be alternatively estimated by summarizing the low- spectral weight, =8. The integration up to should cover all the spectrum contributed by the free carriers but still below the inter-band transition. Usually, one takes at the frequency where the shows a minimum, then we expect that there is a balance between the Drude component tail and the onset part of the interband transition. Taking 800 cm-1 , we get 8400 cm-1 . This value is smaller than the value obtained from the above two Drude component analysis. This is because the tail of the broad Drude component is not balanced by the onset part of the Lorentz component, as can be seen in Fig. 4 (b). Therefore, taking at the energy that shows a minimum in the present case still leads to an underestimation of plasma frequency.
Although presence of multiple Drude components appears to be the generic property of iron pnictides/chacolgenides, the development of narrow and sharp Drude component at such low frequencies were not seen in iron pnictide systems WZ Hu 122 ; phonon 122 ; T Dong ; WZ Hu 111 . It suggests that in certain peculiar band of FeSe the quasiparticles experience extremely small scattering at low temperature.
Another prominent feature in optical conductivity (Fig. 3 (b)) is that the low frequency spectral weight is transferred to the high energy region above 4000 cm-1 with decreasing temperature. Such spectral weight transfer feature was also observed in iron pnictides systems wang Hund ; Schafgans , and was referred to as a ”high-energy psuedogap” structure wang Hund . But the relevant energy scale is smaller for FeSe. For BaFe2As2, the spectral weight was transferred to region above 5000 cm-1 . The temperature induced spectral weight transfer was ascribed to the electron correlation effect, in particular, to the Hund’s coupling effect between itinerant Fe 3d electrons and localized Fe 3d electrons in different orbitals wang Hund ; Schafgans . So, the spectral weight transfer represents the redistribution of the spectral weight between different 3d bands. It is interesting to note that FeSe as well as other iron calcogenide compounds have stronger electron correlation effect, leading to larger local moment of 2 Gretarsson and higher band renormalization factor. However, the energy scale of temperature induced spectral weight transfer in optical conductivity appears to be smaller. This puzzling phenomenon reflects the complex interplay effect from correlations/Hund’s couplings and kinetic energy of electrons in FeSe(As) systems and needs to be further explored.
As we mentioned above, a recent ARPES measurement on (001) FeSe thin film SYTan indicated signature of SDW order, in a way very similar to the parent compound of Fe pnictides, e.g. BaFe2As2. It would be highly desirable to examine this possibility by optical measurement. From Fig. 4 (c), we find that the reflectance R() at low frequency shows a monotonous increase with decreasing temperature without showing any specific suppression arising from energy gap formation. At two lowest measurement temperatures 8 K and 22 K, the reflectance seems to develop a stronger upward curvature below the phonon mode frequency, being consistent with the even faster decrease of the dc resistivity below 50 K. Nevertheless, no any energy gap signature could be identified from the reflectance spectra. As a result, in the spectra, we observe a further narrowing of Drude component at low temperature. Since the infrared measurement is a bulk detection technique and infrared experiments on all parent compounds of iron pnictides (including 122, 111, 1111 systems) revealed clearly formation of energy gaps in the SDW state or even below the structural distortion, our measurement indicates that the superconducting bulk FeSe film is not in the SDW state.
It is worth remarking that an earlier pump-probe experiment on (101) FeSe film also indicated a gapped relaxation of excited quasiparticles below roughly 100 K MKfilm . However, the extraction of an energy gap from this technique is indirect. The quasiparticles were excited by the pump laser (3.1 eV) to states far above the Fermi level, then the transient reflection was probed at the energy of 1.55 eV on those excited quasiparticles in the relaxation process towards their equilibrium state. The probe is different from the optical measurement in the equilibrium state. Anyhow, our measurement can not rule out that such films or those grown on SrTiO3 substrate with thickness of a few tens of monolayers have SDW orders at low temperature.
In summary, we have investigated the ab-plane optical properties of FeSe films grown on SrTiO3 substrate and compared with Fe pnictides, e.g. BaFe2As2. The low frequency conductivity spectrum consists of two components: a broad one which takes up most of the spectral weight and a narrow one roughly below 100-150 cm-1 . The narrow Drude component locates at so low frequencies that no such behavior was observed in iron pnictide systems. The study revealed a smaller plasma frequency and enhanced renormalization effect in FeSe. Furthermore, different from the recent ARPES measurement which revealed a SDW order at low temperature for relatively thick thin films grown on SrTiO3 substrate, the present optical measurement does not yield any sign of the energy gap formation in the thick film.
Acknowledgements.
This work was supported by the National Science Foundation of China, and the 973 project of the Ministry of Science and Technology of China (2011CB921701,2012CB821403).References
- (1) Fong-Chi Hsu et al., Proc. Natl. Acad. Sci. 105, 14262 (2008).
- (2) S. Medvedev et al., Nat. Mater. 8, 630 (2009).
- (3) Q. Y. Wang et al., Chin. Phys. Lett. 29, 037402 (2012).
- (4) Liu, D.F et al., Nat. Commun 3, 931 (2012).
- (5) S. He et al., arXiv:1207.6823v1 (2012).
- (6) S. Y. Tan et al., arXiv:1301.2748 (2013)
- (7) A. Subedi et al., Phys. Rew. B 78, 134514 (2008).
- (8) Fengjie Ma et al., Phys. Rew. Lett. 102, 177003 (2009).
- (9) C. Y. Moon and H. J. Choi, Phys. Rew. Lett. 104, 057003 (2010).
- (10) For a review, please see D. J. Singh, Sci. Technol. Adv. Mater. 13, 054304 (2012).
- (11) S. B. Zhang et al., Supercond. Sci. Technol 22, 015020 (2008).
- (12) T. M. McQueen et al., Phys. Rev. B 79 014522 (2009).
- (13) M. K. Wu et al., Physica. C. 469, 340-349 (2009).
- (14) U. Patel et al., Appl. Phys. Lett. 94, 082508 (2009).
- (15) R. Hu et al., Phys. Rev. B 83, 224502 (2011).
- (16) Yang, L. X. et al., Phys. Rev. Lett. 102, 107002 (2009).
- (17) S. Y. Tan et al., arXiv:1301.2748 (2013).
- (18) M. Dressel and G. Gruner, Electrodynamics of Solids, Cambridge University Press, Cambridge, UK (2002).
- (19) W. Z. Hu et al., Phys. Rev. Lett. 101, 257005 (2008).
- (20) Dong, T. et al.V Phys. Rev. B 82, 054522 (2010).
- (21) Hu, W. Z. et al., Phys. Rev. B 80, 100507 (2009).
- (22) Y. C. Wen et al., Phys. Rev. Lett. 108, 267002 (2012).
- (23) Y. J. Song et al., J. of Korean Phys. Soc. 59, 312 (2011).
- (24) Akrap, A. et al., Phys. Rew. B 80, 180502 (2009).
- (25) C. C. Homes et al., Phys. Rew. B 81, 180508 (2010).
- (26) G. F. Chen et al., Phys. Rew. B 79, 140509(R) (2009).
- (27) Z. P. Yin, K. Haule and G. Kotliar, Nature Mater. 10, 1932-935 (2011) and supplementary Information.
- (28) M. Aichhorn et al., Phys. Rew. B 82, 064504 (2010).
- (29) N. L. Wang et al., J. Phys.: Condens. Matter 24, 294202 (2012).
- (30) A. A. Schafgans et al., Phys. Rev. Lett. 108, 147002 (2012).
- (31) H. Gretarsson et al., Phys. Rew. B 84, 100509(R) (2011).