The hard X-ray spectrum of NGC 1365: scattered light, not black hole spin
Abstract
Active Galactic Nuclei (AGN) show excess X-ray emission above 10 keV compared with extrapolation of spectra from lower energies. Risaliti et al. have recently attempted to model the hard X-ray excess in the type 1.8 AGN NGC 1365, concluding that the hard excess most likely arises from Compton-scattered reflection of X-rays from an inner accretion disk close to the black hole. Their analysis disfavored a model in which the hard excess arises from a high column density of circumnuclear gas partially covering a primary X-ray source, despite such components being required in the NGC 1365 data below 10 keV. Using a Monte Carlo radiative transfer approach, we demonstrate that this conclusion is invalidated by (i) use of slab absorption models, which have unrealistic transmission spectra for partial covering gas, (ii) neglect of the effect of Compton scattering on transmitted spectra and (iii) inadequate modeling of the spectrum of scattered X-rays. The scattered spectrum is geometry dependent and, for high global covering factors, may dominate above 10 keV. We further show that, in models of circumnuclear gas, the suppression of the observed hard X-ray flux by reprocessing may be no larger than required by the ‘light bending’ model invoked for inner disk reflection, and the expected emission line strengths lie within the observed range. We conclude that the time-invariant ‘red wing’ in AGN X-ray spectra is probably caused by continuum transmitted through and scattered from circumnuclear gas, not by highly redshifted line emission, and that measurement of black hole spin is not possible.
1 Introduction
Observations of AGN reveal evidence for absorbing gas surrounding an accreting black hole system at both X-ray (see Turner & Miller, 2009, for a review) and UV wavelengths (e.g. Crenshaw et al., 2003). High column density outflowing gas may be seen in up to 40% of type 1 AGN (e.g. Cappi et al., 2009; Tombesi et al., 2012). A recent Suzaku study (Tatum et al., 2013) of a hard X-ray selected sample of type 1 AGN has shown luminosities above 10 keV to be much higher than expected from extrapolation of models from the 0.5–10 keV band. This ‘hard excess’ is ubiquitous in local type 1 AGN and, owing to the sharp absorption edges associated with the hardest source spectra, cannot be explained other than by the presence of a Compton-thick layer of low-ionization absorbing gas, covering a large fraction of the continuum source (Tatum et al., 2013).
Partial-covering absorption by gas below the Compton-thick limit has long been known in type 1 AGN (Piro et al., 2005; Miller et al., 2008) and changes in the absorber may explain X-ray spectral variability on long timescales. The Tatum et al. (2013) analysis extends the paradigm into the Compton-thick regime.
It has also long been claimed that X-ray spectra show features caused by Compton scattering and absorption (known as ‘reflection’) from an inner accretion disk, blurred by relativistic effects. Spectral curvature over the 2–8 keV band may be fit with a model that convolves reflection spectra (Ross & Fabian, 2005) with general relativistic effects (c.f. Laor, 1991).
However, it is difficult to distinguish absorption and reflection signatures by fitting individual X-ray spectra, because Compton scattering and absorption shape both models, leading to similarities in overall shape. Consideration of AGN variability can help, and perhaps the biggest problem for the blurred reflection-dominated picture is the lack of any clear correlation between continuum and reflection flux in variable AGN (section 4).
A particularly interesting case is the type 1.8 AGN NGC 1365 (catalog ), which has been observed extensively at 0.5–10 keV (Risaliti et al., 2000, 2005a, 2005b, 2007, 2009b, 2009c) and higher energies (Risaliti et al., 2009a, 2013). These observations have shown spectral variability on timescales as short as a few hours, attributed to changes in the X-ray absorber.
Risaliti et al. (2013) present simultaneous XMM-Newton and NuSTAR data for NGC 1365 (catalog ), covering 0.5–79 keV. The authors claim that the data show relativistic disk features: broad Fe K line emission and Compton scattering excess above 10 keV. Risaliti et al. claim that the reflected component arises within 2.5 gravitational radii of a rapidly spinning black hole and that absorption-dominated models that do not include relativistic disk reflection can be ruled out. As this is a very strong assertion, we investigate here the assumptions upon which it is based.
There are two key processes that shape AGN X-ray spectra: Compton scattering and photoelectric absorption. At the high energies observed by NuSTAR, and for Compton-thick gas, it is crucial to include both effects. Risaliti et al. (2013) created models representing slabs of ionized absorbing gas. However, those models fitted to NGC 1365 (catalog ) required column density . Such gas would be Compton-thick, but current ionized absorption models do not include Compton scattering. The circumnuclear gas also results in production of a scattered X-ray component which is highly dependent on the geometry of the scattering region.
In this paper we present Monte Carlo simulations that demonstrate the importance of the inclusion of Compton scattering for the column density regime applicable to NGC 1365 (catalog ). We also demonstrate the strong geometry-dependence of the predictions for both transmitted and scattered X-rays and discuss the implications for modeling and interpretation of AGN X-ray spectra.
2 Absorption and scattering by a spherical cloud
2.1 The importance of geometry
In this section, we consider a single cloud of constant density, absorbing photons from a distant source, to demonstrate the key effects that must be taken into account. The gas is assumed to be cold, with solar abundances (Anders & Grevesse, 1989) and cross-sections of Verner et al. (1996). We first consider the effect of cloud geometry alone, omitting the effects of Compton scattering, for a cloud with column density cm-2, as found by Risaliti et al. (2013). The cloud is illuminated by a power-law of photon index and has a normalization, that would be seen by the observer in the absence of absorption, of unity at 1 keV. Fig. 1 plots the transmitted spectrum , for photon energy and energy spectral flux density . The lowest dashed curve shows the standard calculation obtained for a plane slab of uniform density, where the transmitted flux for photoelectric absorption cross-section per hydrogen atom .
However, a plane slab is an unlikely choice for a clumpy distribution of gas that partially covers the source. The distribution of column density is likely to be complex, and it is instructive to compare with a uniform spherical cloud. Now, there is a distribution of column density associated with the cloud, for , where is the maximum column density through the cloud. Integrating over this distribution, and in the absence of Compton scattering, we expect transmitted flux
The upper dashed line in Fig. 1 shows the results for a cloud with mean density the same as the slab and for which is 3/2 times the mean column density. At high optical depths the transmitted flux , and since has an approximately power-law form, a hard, powerlaw spectrum develops. In this regime, the dominant contribution to the transmitted flux comes from the periphery of the cloud.
The spherical cloud has a significantly different transmitted spectrum from the slab. Such a cloud model has the same number of model parameters as the slab, and is likely to be a better representation of a partial-covering cloud. This calculation alone demonstrates how careful one must be when fitting absorption models to AGN X-ray spectra.
2.2 The effect of Compton scattering
At high column densities, incident radiation is Compton scattered out of the line of sight. To model the transmitted and scattered spectra, we carried out a Monte Carlo radiative transfer simulation, following Miller et al. (2009). Multiple scatterings were allowed, and when photons were absorbed by a K shell of Fe, an Fe K line photon could be produced. Angle-dependent Klein-Nishina Compton scattering was calculated. The Monte Carlo spectra have been smoothed with a gaussian of FWHM , appropriate for the resolution of typical CCD spectral data around Fe K.
The transmitted spectrum is shown by the lower, solid, red line in Fig. 1. At high energies the transmitted flux is significantly attenuated by Compton scattering. However, the spectrum is significantly different from either the slab or sphere when Compton scattering is neglected. At low energies, the transmitted flux is again dominated by light leaking through the periphery of the cloud, so that the spectrum tends towards the same form as the spherical, non-scattering cloud.
However, the light that is lost due to Compton scattering reappears in the scattered spectrum, shown in Fig. 1 by the upper solid curve. The spectrum has been integrated over all solid angles, so that the normalization is such that this is the scattered spectrum that would be measured by an observer if the primary source were fully surrounded by such clouds, but neglecting the effect of radiation being reabsorbed or scattered by other clouds (which will be discussed in section 3). If instead only some fraction of lines of sight are intercepted by clouds, the normalization should be multiplied by the global covering factor. For any global covering factor , the scattered spectrum dominates over the transmitted spectrum, and both spectra have considerably different shapes from the non-scattering slab and sphere. It is worth noting the low equivalent width of the Fe K emission line (Miller et al., 2009; Yaqoob et al., 2010).
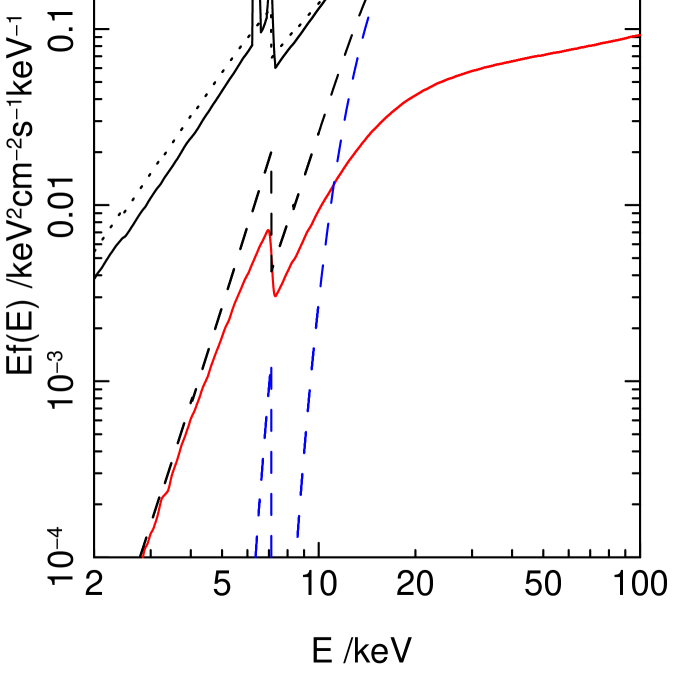
Finally, Fig. 1 shows a comparison with reflection from a plane, neutral, optically-thick slab as calculated by the pexrav model (Magdziarz & Zdziarski, 1995) within xspec (Arnaud, 1996), without calculation of the emission line strength. The normalization and shape of the pexrav spectrum varies with inclination: the curve shows the case for , which matches most closely the cloud scattered spectrum around 10 keV. The pexrav spectrum is qualitatively similar to the cloud spectrum, although there are differences in shape, especially above 20 keV when the cloud spectrum has a less pronounced ‘Compton hump’. Given also the significant differences in the transmitted spectra, we cannot expect to model even simple Compton-thick clouds with combinations of absorption by plane slabs and planar reflection. We shall see in the next section that, in models with a high covering factor of clumpy circumnuclear gas, the scattered spectrum shows much larger departures from the pexrav model. The importance of geometry for the observed spectrum has previously been demonstrated by Murphy & Yaqoob (2009) for a smooth toroidal reprocessor.
3 Scattering and absorption by a complex distribution of circumnuclear gas
In this section we consider the case of a high global covering factor of clumpy gas, when scattering of photons between clouds cannot be ignored (Nandra & George 1994, see also Merloni et al. 2006). As in Tatum et al. (2013), a simple, clumpy distribution was created by placing 1000 spherical clouds of equal radius between inner and outer radii and from a central X-ray source. Gas was placed inside each cloud with a uniform density (the density was not increased within overlapping clouds). For illustration, we chose cm-2 per unit cloud radius, chosen to approximately maximize the hard excess. In order to simulate the effect that in type 2 AGN we might be looking through a denser distribution of clouds than in type 1 AGN, the number density of clouds increased towards the equatorial plane as , where is the polar angle of observation. In Fig. 2 we show two models: model A has , in units of the cloud radius; model B has , . The fraction of sightlines that were empty of gas was at , decreasing to for in model A, and at decreasing to for in model B. We emphasize that these are simplified models of circumnuclear material, designed to illustrate the radiative transfer effects, and are not to be taken as a proposal for the actual gas distribution.
Spectra were created using input quanta with energy keV. The input spectrum was a powerlaw of photon index , as inferred for NGC 1365 (catalog ) (e.g. Risaliti et al., 2009a). It was assumed that photons that propagated through the equatorial plane were absorbed by an accretion disk and, to avoid possible confusion with disk reflection, the disk did not re-emit photons. As in section 2 the gas was assumed cold and angle-dependent Klein-Nishina Compton scattering was calculated. Spectra can be accumulated only by averaging over finite solid angle, and here we adopted a solid angle corresponding to that subtended from the central source by a cloud at . A point source was placed at the center of the cloud distribution, but the averaging of photons over solid angle has the effect of mimicking the partial covering of an extended source of comparable size to a cloud.
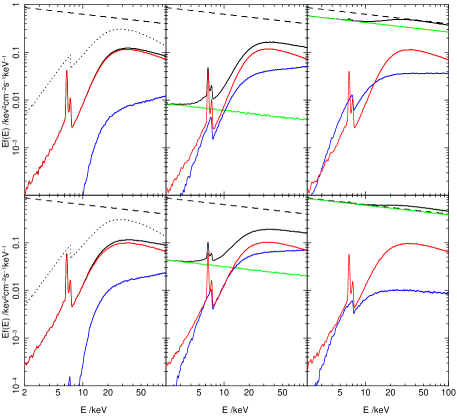
Fig. 2 shows example spectra obtained for models A and B, viewed at polar angle , for three azimuthal angles. The spectra have been smoothed as in section 2, but Monte Carlo noise is visible at low flux values. The spectra cover a range similar to that observed in the AGN population, from ‘reflection dominated’, through intermediate states where primary continuum is visible, to high states where the primary continuum dominates. All states have significant hard excesses above 20 keV. Unobscured sightlines have total light at high energy that exceeds the input continuum amplitude. The panels show the contributions from various components: photons that pass through the holes in the distribution, photons that pass through clouds but are not scattered, and scattered photons, including Fe K and Fe K line emission. The incident continuum is also shown as a dashed line. The chief results are as follows.
-
(i)
The transmitted, unscattered spectrum (blue curves) is variable and does not look like the spectrum expected from transmission through a slab model (section 2).
-
(ii)
The scattered radiation is different from that calculated in either the isolated cloud or pexrav models (the left panels of Fig. 2 shows a pexrav model for photon index and ). The hardness of the scattered spectrum increases with global covering factor.
-
(iii)
Within each model, the scattered radiation is invariant with azimuthal viewing angle, because it does not depend on whether the primary source happens to be covered, or not, along any one sightline.
-
(iv)
In all but the highest flux states, the scattered light is the dominant spectral component above 20 keV, where the total amplitude is only a factor 3–4 below the incident continuum, even in this regime where the keV continuum may be suppressed by much larger factors.
-
(v)
The line flux of Fe K is low, as expected (Miller et al., 2009; Yaqoob et al., 2010). Equivalent widths vary from 1500 eV in the reflection-dominated state down to 10 eV in the highest state. The equivalent width of Fe K found in the three Suzaku observations of NGC 1365 (catalog ) is 330–520 eV (Tatum et al., in preparation).
4 Discussion
4.1 The ‘red wing’ in AGN spectra
The results of section 3 show that, on long timescales where spectral variability may be dominated by variations in observer covering fraction, there should be a spectrum of largely invariant scattered light that creates an apparent ‘red wing’ at energies below the Fe K edge. Such an invariant red wing is well known (e.g. Fabian & Vaughan, 2003), and using principal components analysis, Miller et al. (2007, 2008, 2010) showed that there is an approximately invariant ‘offset’ component in AGN spectra. The effect leads to a problem with the explanation of the red wing as reflection by the inner accretion disk. If the disk is close to the primary X-ray source, its flux variations should be closely tracked by the reflected light, but apparently they are not. Fabian & Vaughan (2003), Miniutti et al. (2003) and subsequent papers proposed a ‘light bending’ model in which a compact, primary source near the black hole moves towards or away from the disk, such that bending of light causes an apparent variation in flux from the primary source, but not from the reflected light. This model has to be finely tuned to obtain invariant reflected flux (Miniutti & Fabian, 2004).
Such an a posteriori model is not required if the red wing arises from a combination of transmitted and scattered continua, as suggested by Turner et al. (2007), and not from highly redshifted line emission. Merloni et al. (2006) have also suggested this explanation in the context of scattered light arising in a model of an inhomogeneous accretion flow.
4.2 Modeling the spectrum of NGC 1365
In modeling the spectrum of NGC 1365 (catalog ), Risaliti et al. (2013) recognize that partial covering absorption is required, regardless of whether there is also a component of blurred reflection. In an initial comparison (Fig. 3 of Risaliti et al. 2013), a model of blurred reflection plus one absorber component was compared against a model of two absorber components. The models were only fit to the XMM-Newton data below 10 keV, and it was then seen how well each model extrapolated to higher energy. However, the blurred reflection included Compton scattering, but the two-absorber model did not. Hence it is no surprise that the first model extrapolated better above 10 keV. In a subsequent test, Risaliti et al. (2013) fit also to the hard X-ray NuSTAR data and claimed that the blurred model is statistically better. But the transmitted and scattered light components were modeled with non-scattering, slab absorbers plus a pexrav component, so such a test is invalid. Point (ii) above demonstrates that existing models such as pexrav cannot accurately account for reprocessing by a complex circumnuclear gas distribution.
Estimates of the continuum suppression arising from Compton scattering require proper inclusion
of light scattered back into the line of sight by circumnuclear gas.
Risaliti et al. (2013) considered the expected effect for Compton optical depth , using the plcabs model (Yaqoob, 1997), and inferred that the intrinsic continuum would be a factor 8 larger than the observed continuum. The problems with this approach are:
(i) the assumed Compton depth was obtained from fitting slab absorption models,
which is likely to be incorrect and thus lead to a significant error in the Compton loss estimate;
(ii) the approximations used in plcabs are not valid above 10 keV for high column density
(Yaqoob, 1997);
(iii) the plcabs model assumes full covering by a spherical shell,
and we do not expect this to yield the same scattered light spectrum as clumpy, partial
covering gas - our Monte Carlo simulations supersede the use of plcabs
in this context.
In our models, the Compton loss correction is only a factor 3–4
at high energy, comparable to that
in the ‘light bending’ model of inner disk reflection,
where up to 75% of light is lost (Miniutti & Fabian, 2004).
The scattering models presented here also show that the expected equivalent width of Fe K covers a wide range that includes the observed range for NGC 1365. Finally, Tatum et al. (2013) argue that all type 1 AGN are affected by high-column, partial covering gas distributions, so the ratio of X-ray to infrared or optical line emission for NGC 1365 would not be expected to appear anomalous.
4.3 On the difficulty of measuring black hole spin
It has been claimed that black hole spin can be measured from the shape of the “red wing”, whose profile varies as a function of spin parameter , which requires red wing measurement down to energies keV, free from the effects of other modifications to the continuum. Even in the absence of circumnuclear reprocessing, is difficult to measure free from degeneracies with other parameters (Dovčiak et al., 2004). Given that in AGN such as NGC 1365, Mrk 766 (Miller et al., 2007) and MCG–6-30-15 (Miller et al., 2008) the entire red wing may be modeled as scattered and absorbed continuum, and given that complex absorption must be present (e.g. NGC 1365, Risaliti et al., 2013), it is not possible to unambiguously identify and measure any alleged blurred red wing component with sufficient accuracy to determine spin in any of the AGN that have been subject to detailed study to date.
5 Conclusions
AGN spectra may contain significant levels of transmitted and scattered continua from partially-covering circumnuclear gas, producing the time-invariant ‘red wing’ below the Fe K edge and modifying the spectrum above 10 keV. Such gas is already known in NGC 1365. Geometry-dependent Compton scattering must be taken into account, using 3D radiative transfer calculations, when making spectral models and when accounting for the source total luminosity. The expected red wing, low Fe K equivalent width and high energy excess may be easily confused with ‘reflection’ from an accretion disk, and spectral analyses to date have not established that there is any requirement for inner-disk reflection. Improved models of clumpy, ionized circumnuclear gas are required to achieve a full understanding of AGN X-ray spectra.
References
- (1)
- Anders & Grevesse (1989) Anders, E., & Grevesse, N. 1989, Geochim. Cosmochim. Acta, 53, 197
- Arnaud (1996) Arnaud, K. A. 1996, in Astronomical Society of the Pacific Conference Series, Vol. 101, Astronomical Data Analysis Software and Systems V, ed. G. H. Jacoby & J. Barnes, 17–+
- Cappi et al. (2009) Cappi, M., Tombesi, F., Bianchi, S., et al. 2009, A&A, 504, 401
- Crenshaw et al. (2003) Crenshaw, D. M., Kraemer, S. B., & George, I. M. 2003, ARA&A, 41, 117
- Dovčiak et al. (2004) Dovčiak, M., Karas, V., & Yaqoob, T. 2004, ApJS, 153, 205
- Fabian & Vaughan (2003) Fabian, A. C., & Vaughan, S. 2003, MNRAS, 340, L28
- Laor (1991) Laor, A. 1991, ApJ, 376, 90
- Magdziarz & Zdziarski (1995) Magdziarz, P., & Zdziarski, A. A. 1995, MNRAS, 273, 837
- Merloni et al. (2006) Merloni, A., Malzac, J., Fabian, A. C., & Ross, R. R. 2006, MNRAS, 370, 1699
- Miller et al. (2008) Miller, L., Turner, T. J., & Reeves, J. N. 2008, A&A, 483, 437
- Miller et al. (2009) —. 2009, MNRAS, 399, L69
- Miller et al. (2007) Miller, L., Turner, T. J., Reeves, J. N., et al. 2007, A&A, 463, 131
- Miller et al. (2010) —. 2010, MNRAS, 403, 196
- Miniutti & Fabian (2004) Miniutti, G., & Fabian, A. C. 2004, MNRAS, 349, 1435
- Miniutti et al. (2003) Miniutti, G., Fabian, A. C., Goyder, R., & Lasenby, A. N. 2003, MNRAS, 344, L22
- Murphy & Yaqoob (2009) Murphy, K. D., & Yaqoob, T. 2009, MNRAS, 397, 1549
- Nandra & George (1994) Nandra, K., & George, I. M. 1994, MNRAS, 267, 974
- Piro et al. (2005) Piro, L., de Rosa, A., Matt, G., & Perola, G. C. 2005, A&A, 441, L13
- Risaliti et al. (2005a) Risaliti, G., Bianchi, S., Matt, G., et al. 2005a, ApJ, 630, L129
- Risaliti et al. (2005b) Risaliti, G., Elvis, M., Fabbiano, G., Baldi, A., & Zezas, A. 2005b, ApJ, 623, L93
- Risaliti et al. (2007) Risaliti, G., Elvis, M., Fabbiano, G., et al. 2007, ApJ, 659, L111
- Risaliti et al. (2000) Risaliti, G., Maiolino, R., & Bassani, L. 2000, A&A, 356, 33
- Risaliti et al. (2009a) Risaliti, G., Braito, V., Laparola, V., et al. 2009a, ApJ, 705, L1
- Risaliti et al. (2009b) Risaliti, G., Salvati, M., Elvis, M., et al. 2009b, MNRAS, 393, L1
- Risaliti et al. (2009c) Risaliti, G., Miniutti, G., Elvis, M., et al. 2009c, ApJ, 696, 160
- Risaliti et al. (2013) Risaliti, G., Harrison, F. A., Madsen, K. K., et al. 2013, Nature, 494, 449
- Ross & Fabian (2005) Ross, R. R., & Fabian, A. C. 2005, MNRAS, 358, 211
- Tatum et al. (2013) Tatum, M. M., Turner, T. J., Miller, L., & Reeves, J. N. 2013, ApJ, 762, 80
- Tombesi et al. (2012) Tombesi, F., Cappi, M., Reeves, J. N., & Braito, V. 2012, MNRAS, 422, L1
- Turner & Miller (2009) Turner, T. J., & Miller, L. 2009, A&A Rev., 17, 47
- Turner et al. (2007) Turner, T. J., Miller, L., Reeves, J. N., & Kraemer, S. B. 2007, A&A, 475, 121
- Verner et al. (1996) Verner, D. A., Ferland, G. J., Korista, K. T., & Yakovlev, D. G. 1996, ApJ, 465, 487
- Yaqoob (1997) Yaqoob, T. 1997, ApJ, 479, 184
- Yaqoob et al. (2010) Yaqoob, T., Murphy, K. D., Miller, L., & Turner, T. J. 2010, MNRAS, 401, 411