11email: ducci@astro.uni-tuebingen.de 22institutetext: Max-Planck-Institut für Extraterrestrische Physik, Giessenbachstraße, 85741 Garching, Germany
X-ray source population study of the starburst galaxy M 83 with XMM-Newton ††thanks: Based on observations obtained with XMM-Newton, an ESA science mission with instruments and contributions directly funded by ESA Member States and NASA.,††thanks: Appendix A is available in electronic form at http://www.aanda.org,††thanks: Tables LABEL:Tab._source_list and LABEL:Tab._source_list_classification are only available in electronic form at the CDS via anonymous ftp to cdsarc.u-strasbg.fr (130.79.128.5) or via http://cdsweb.u-strasbg.fr/cgi-bin/qcat?J/A+A/
Abstract
Aims. We present the results obtained from the analysis of three XMM-Newton observations of M 83. The aims of the paper are studying the X-ray source populations in M 83 and calculating the X-ray luminosity functions of X-ray binaries for different regions of the galaxy.
Methods. We detected 189 sources in the XMM-Newton field of view in the energy range of keV. We constrained their nature by means of spectral analysis, hardness ratios, studies of the X-ray variability, and cross-correlations with catalogues in X-ray, optical, infrared, and radio wavelengths.
Results. We identified and classified 12 background objects, five foreground stars, two X-ray binaries, one supernova remnant candidate, one super-soft source candidate and one ultra-luminous X-ray source. Among these sources, we classified for the first time three active galactic nuclei (AGN) candidates. We derived X-ray luminosity functions of the X-ray sources in M 83 in the keV energy range, within and outside the ellipse, correcting the total X-ray luminosity function for incompleteness and subtracting the AGN contribution. The X-ray luminosity function inside the ellipse is consistent with that previously observed by Chandra. The Kolmogorov-Smirnov test shows that the X-ray luminosity function of the outer disc and the AGN luminosity distribution are uncorrelated with a probability of %. We also found that the X-ray sources detected outside the ellipse and the uniform spatial distribution of AGNs are spatially uncorrelated with a significance of 99.5%. We interpret these results as an indication that part of the observed X-ray sources are X-ray binaries in the outer disc of M 83.
Key Words.:
galaxies: individual; M 83 X-rays: galaxies1 Introduction
M 83 (NGC 5236) is a grand-design barred spiral galaxy (SAB(s)c; de Vaucouleurs et al. 1992) located at Mpc from the Milky Way (Thim et al., 2003). M 83 is oriented nearly face-on (; Rogstad et al. 1974) and shows a galactic disc spanning ( kpc kpc; Wofford et al. 2011).
M83 is experiencing a starburst activity with a present-day star formation rate (SFR) of M⊙ yr-1 (Boissier et al., 2005) in three regions: the nuclear region (galactocentric distance pc; Harris et al. 2001), the inner disc ( pc kpc), and the outer disc ( kpc kpc; Dong et al. 2008). Ultraviolet (UV) images of M 83 obtained with the Galaxy Evolution Explorer (GALEX) satellite revealed a population of young stars ( Myr) in the outer disc of M 83 (Thilker et al., 2005). Although this would indicate recent star-forming activity, using Spitzer and GALEX data, Dong et al. (2008) discovered that the star formation in the outer disc started at least 1 Gyr ago. These results are confirmed by the study of AGB stars of Davidge (2010). Bigiel et al. (2010) compared the HI data from the National Radio Astronomy Observatory (NRAO) Very Large Array (VLA) and far-ultraviolet (FUV) data from GALEX in the outer disc of M 83, and discovered that the star formation traced by the FUV emission and HI are spatially correlated out to almost four optical radii. Bigiel et al. (2010) also found that the star formation rate in the outer disc ( M⊙ yr-1; Bresolin et al. 2009) implies that the star formation activity is not completely consuming the HI reservoir, which will be available as fuel for star formation in the inner disc.
M 83 was observed in the X-ray bands by Einstein in 1979-1981 (Trinchieri et al., 1985), Ginga in 1987 (Ohashi et al., 1990), ROSAT in 1992-1994 (Ehle et al. 1998; Immler et al. 1999), ASCA in 1994 (Okada et al., 1997), and Chandra in 2000 (Soria & Wu 2002; Soria & Wu 2003, SW03 hereafter). SW03 identified 127 discrete sources near the centre of M 83 () and resolved for the first time the nuclear region in X-rays. The diffuse X-ray emission of M 83 has been studied by Owen & Warwick (2009) with an XMM-Newton observation performed in January 27, 2003 (obsid 0110910201). They obtained a good fit to the spectrum assuming a two-temperature thermal model, which is typical of the diffuse emission in normal and starburst galaxies. They also found that the soft X-ray emission mainly overlaps with the inner spiral arm, and shows a strong correlation with the distribution of UV emission, indicative of a correlation between X-ray emission and recent star formation.
The recent high star formation activity experienced by the nucleus and the spiral arms of M 83 provided an unusually large number of supernova remnants (SNRs). In fact, the optical survey performed at the Cerro Tololo Inter-American Observatory in Chile by Blair & Long (2004) identified 71 sources as SNR candidates, the Hubble Space Telescope (HST) observations of the nuclear region of M 83 (Dopita et al., 2010) provided the identification of 60 SNR candidates, and the Magellan I survey 271 SNR candidates (Blair et al., 2012).
In a normal galaxy such as M 83, X-ray binaries (XRBs) are the most prominent class of X-ray sources. XRBs show X-ray luminosities ranging from erg s-1 to the Eddington luminosity, and sometimes they can exceed this limit (see e.g. White & Carpenter 1978). They are composed of a compact object (a neutron star or a black hole) and a companion star, which can be a main-sequence, giant, or supergiant star, and in some cases a white dwarf (e.g. van Paradijs 1998). The strong X-ray emission is produced by the accretion of matter from the companion star onto the compact object. XRBs are usually divided into two classes: low mass X-ray binaries (LMXBs), and high mass X-ray binaries (HMXBs). The companion stars of LMXBs have masses lower than M⊙. The lifetime of an LMXB is determined by the nuclear evolution time-scale of the companion star to yr (e.g. Tauris & van den Heuvel 2006), and their number is correlated to the total stellar mass of a galaxy (Gilfanov, 2004). The companion star of LMXBs usually tranfers mass by Roche-lobe overflow, and the compact object accretes from an accretion disc (e.g. van Paradijs 1998). The donors in HMXBs have masses M⊙, and their typical lifetime does not exceed yr. Therefore, the presence of HMXBs in a particular region of a galaxy is associated with a relatively recent star formation event (e.g. Fabbiano 2006). The X-ray emission from HMXBs is usually explained with the accretion of a fraction of the stellar wind ejected by the donor star onto the compact object, or through mass transfer via Roche-lobe overflow (see e.g. Treves et al. 1988 and references therein). As a first approximation, two standard models are commonly used to describe the X-ray spectra of XRBs in nearby galaxies: an absorbed disc-blackbody model, with temperatures ranging from to keV (e.g. Makishima et al. 1986), or an absorbed powerlaw model. X-ray spectra of LMXBs below 10 keV are described by absorbed powerlaw with photon indices . HMXBs usually show harder X-ray spectra in the energy range keV, with photon indices and a high intrinsic absorption (White et al., 1995). Within each of these classes, the properties of the X-ray spectra can also depend on the type of the accreting compact object. Accreting black holes can show states of high luminosity (e.g. Jones 1977), with very soft spectra, with slopes steeper than those shown by accreting neutron stars (see e.g. White & Marshall 1984). Given the wide variety of spectral shapes shown by XRBs, they can be confused with background AGNs, whose X-ray spectra have roughly a powerlaw shape, with indices ranging from 1.6 to 2.5 (see e.g. Walter & Fink 1993; Vignali et al. 1999; Turner et al. 1991).
In this paper we report the results obtained from a study of the X-ray source populations of M 83, using three XMM-Newton observations covering both the inner and outer disc regions. The higher spatial resolution and sensitivity of XMM-Newton compared to the previous observations of ROSAT and Einstein allowed an increase of the number of detected sources in M 83. While the spatial coverage of the Chandra observation was limited to a region located at the centre of M 83 with a size of (the ACIS S3 field of view), the XMM-Newton observations allowed us to obtain a complete coverage of M 83, and to study also the outer parts of the galaxy, which in total provided us with a more representative sample of X-ray sources in M 83.
The paper is organised as follows: in Sect. 2 we describe the data reduction and analysis of XMM-Newton observations. In Sect. 3 we show the astrometrical corrections that have been applied. In Sect. 4 we present the techniques adopted to classify the X-ray sources (X-ray variability, spectral analysis, and hardness ratios). In Sect. 5 we describe the properties and classification of the detected sources. In Sect. 6 we derive the X-ray luminosity functions (XLFs) of X-ray binaries within and outside the ellipse, after correcting them for incompleteness and subtracting the AGN contribution, and we discuss our results. We examine in detail the properties of the sources that have been identified and classified in this work in Appendix A.
| Obs. ID. | Date | Pointing direction | EPIC PN | EPIC MOS1 | EPIC MOS2 | Mode | ||||||
|---|---|---|---|---|---|---|---|---|---|---|---|---|
| RA | Dec | filter | filter | filter | PN | MOS | ||||||
| 1 | 0110910201 | 2003-01-27 | 13:37:05.16 | -29:51:46.1 | thin | 21.2 | medium | 24.6 | medium | 24.6 | EFF | FF |
| 2 | 0503230101 | 2008-01-16 | 13:37:01.09 | -30:03:49.9 | medium | 15.4 | medium | 19.0 | medium | 19.0 | EFF | FF |
| 3 | 0552080101 | 2008-08-16 | 13:36:50.87 | -30:03:55.2 | medium | 25.0 | medium | 28.8 | medium | 28.8 | EFF | FF |
2 Reduction and data analysis
We analysed the public archival XMM-Newton data of M 83 (PIs: M. Watson, K.D. Kuntz). Table 1 lists the three observations that we analysed, one pointing at the centre of the galaxy (obs. 1) and two in the south, which covered the outer arms with a young population of stars discovered with GALEX. The data analysis was performed using the XMM-Newton Science Analysis System (SAS) 12.0. For each pointing we produced PN, MOS1, and MOS2 event files. We excluded times of high background due to soft proton flares as follows. For each observation and instrument, we created background lightcurves (with sources removed) in the 715 keV energy band. Good time intervals (GTIs) were determined by selecting count rates lower than 8 cts ks-1 arcmin-2 and 2.5 cts ks-1 arcmin-2 for PN and MOS, respectively.
For each observation, data were divided into five energy bands:
-
•
R1: 0.2–0.5 keV;
-
•
R2: 0.5–1 keV;
-
•
R3: 1–2 keV;
-
•
R4: 2–4.5 keV;
-
•
R5: 4.5–12 keV.
For the PN data we used single-pixel events (PATTERN=0) in the first energy band and for the other energy bands single- and double-pixel events (PATTERN4) were selected. For the MOS data, single-pixel to quadruple-pixel events (PATTERN12) were used for all five bands.
We ran the source detection procedure separately for images of each observation, and simultaneously for five energy bands and three instruments with the SAS task edetect_chain. The source detection consists of three steps. The first step provides a list of source positions used to create the background maps. We adopted a minimum-detection likelihood111The detection likelihood is defined by the relationship , where is the probability that a Poissonian fluctuation in the background is detected as a spurious source. of 7 to obtain this list of sources. After removing the sources, a two-dimensional spline with 20 nodes was fitted to the exposure-corrected image. In the second step the background maps are used to improve the detection sensitivity and hence to create a new source list, assuming a minimum-detection likelihood of 4. In the last step, a maximum-likelihood point-spread function (PSF) fit to the source count distribution is performed simultaneously in all energy bands and each EPIC instrument, from the input list of source positions obtained in the previous step (a description of this algorithm is given by Cruddace et al. 1988). For each observation we generated the final source list adopting a lower threshold for the maximum-detection likelihood of 6, which corresponds to a detection probability of %. The source detection gives several parameters for each source, such as the coordinates, count rates, and likelihood of detection (see Table LABEL:Tab._source_list in the appendix B). As mentioned above, 20 nodes (more than the default 16) for the background spline map were used to better follow the central diffuse emission and to minimise false detections. We removed the remaining false detections due to diffuse emission structures by visual inspection.
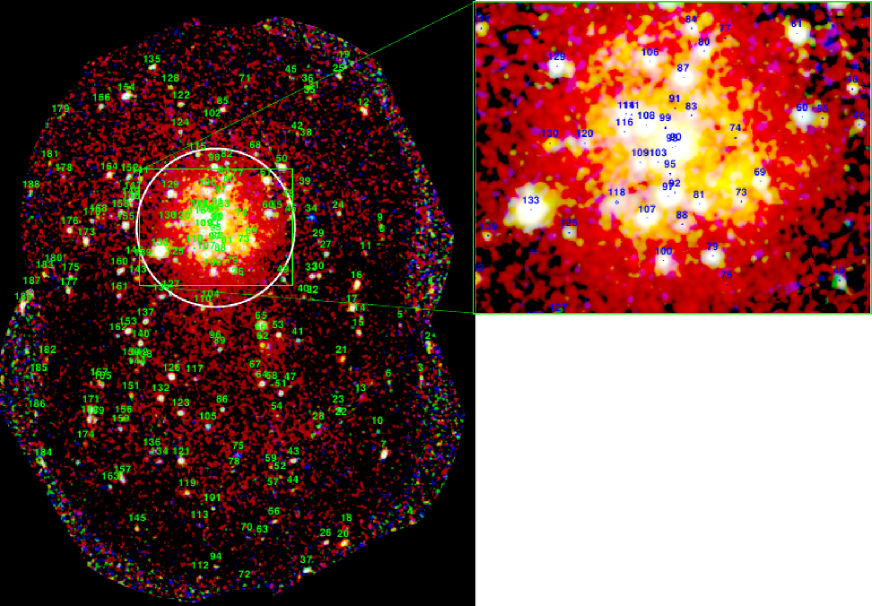
Fig. 1 shows the combined PN, MOS1, and MOS2 three-colour mosaic image obtained from the three observations. The numbers of the detected sources are overplotted on the image. The red, green, and blue colours represent the keV, keV, and keV energy bands.


| Detector | Filter | R1 | R2 | R3 | R4 | R5 |
|---|---|---|---|---|---|---|
| EPIC | erg cm-2 ct-1 | |||||
| PN | Thin | 0.8850 | 1.091 | 1.731 | 5.020 | 17.97 |
| Medium | 1.055 | 1.110 | 1.730 | 4.977 | 17.47 | |
| MOS | Medium | 6.796 | 5.582 | 5.189 | 13.71 | 69.63 |
3 Astrometrical corrections
3.1 Corrections between XMM-Newton observations
We calculated the RA and Dec offsets of the three XMM-Newton observations using position of the sources detected in at least two observations. Sources were considered as detections in at least two different observations if their position was closer than the combined statistical positional errors. We calculated the offsets of observations 2 and 3 with respect to the reference observation 1 as the weighted mean of RA and Dec of all sources, then recalculated all X-ray positions correcting for the shifts relative to the observation 1.
3.2 Correcting the position of the detected sources using X-ray and optical observations
We also applied the cross-correlation procedure described above to determine the systematic errors in the X-ray positions of the XMM-Newton observations by calculating the offsets in the X-ray positions of the XMM-Newton sources with respect to the X-ray sources observed by SW03 with Chandra. The offset between the XMM-Newton and Chandra positions (given as the weighted mean of RA and Dec in arcsec) is RA, Dec. We point out that SW03 corrected the Chandra positions using only the position of the infrared nucleus of M 83 deduced from HST/WFPC2 observations. Therefore, to obtain more accurate positions from possible optical counterparts, we cross-correlated the XMM-Newton list of sources with the optical catalogue of the United States Naval Observatory USNO-B1 (Monet et al., 2003). For this calculation we were interested in associations between X-ray sources and foreground stars. As discussed in Sect. 5.1, we classified five sources as foreground star candidates. The offset between the X-ray positions and optical positions corrected for proper motion (given as the weighted mean of RA and Dec in arcsec) is RA, Dec. The measured offset in RA agrees with the expected precision of the XMM-Newton Attitude Measurement System (Guainazzi, 2012). We used these systematic offsets to correct the position of all detected sources.
4 Analysis
| XMM-Newton: | |||||||||
| Source | flux max. | error | Source | flux max. | error | ||||
| 2 | 3.0 | 0.6 | 1.2 | 104 | 1.9 | 0.6 | 1.0 | ||
| 3 | 3.1 | 0.2 | 2.9 | 107 | 1.97 | 0.12 | 5.1 | ||
| 4 | 1.7 | 0.4 | 1.2 | 108 | 1.44 | 0.10 | 3.3 | ||
| 7 | 7.16 | 0.09 | 9.4 | 109 | 2.0 | 0.4 | 2.4 | ||
| 9 | 1.5 | 0.3 | 1.1 | 110 | 2.3 | 0.4 | 2.1 | ||
| 12 | 3.95 | 0.14 | 5.0 | 111 | 6.4 | 0.2 | 3.9 | ||
| 15 | 3.1 | 0.2 | 4.4 | 113 | 3.0 | 0.6 | 1.2 | ||
| 16 | 10.6 | 0.3 | 9.5 | 114 | 2.39 | 0.18 | 4.1 | ||
| 17 | 2.1 | 0.2 | 3.3 | 116 | 2.63 | 0.15 | 4.0 | ||
| 19 | 1.9 | 0.3 | 1.4 | 118 | 3.6 | 0.4 | 2.0 | ||
| 20 | 3.3 | 0.2 | 3.3 | 119 | 1.70 | 0.17 | 2.4 | ||
| 25 | 1.8 | 0.3 | 1.4 | 121 | 1.76 | 0.17 | 2.4 | ||
| 26 | 1.8 | 0.3 | 1.4 | 122 | 1.62 | 0.17 | 2.2 | ||
| 33 | 1.4 | 0.3 | 1.1 | 123 | 1.8 | 0.3 | 2.1 | ||
| 37 | 8.58 | 0.11 | 7.9 | 126 | 1.4 | 0.2 | 1.4 | ||
| 40 | 1.7 | 0.5 | 1.2 | 129 | 3.94 | 0.11 | 6.4 | ||
| 41 | 2.4 | 0.4 | 2.0 | 131 | 2.2 | 0.4 | 2.1 | ||
| 50 | 2.77 | 0.14 | 4.4 | 133 | 2.24 | 0.06 | 12.4 | ||
| 51 | 1.8 | 0.3 | 2.0 | 135 | 3.8 | 0.2 | 3.0 | ||
| 53 | 1.5 | 0.3 | 1.3 | 136 | 1.9 | 0.5 | 1.2 | ||
| 55 | 2.5 | 0.3 | 2.0 | 140 | 1.4 | 0.3 | 1.1 | ||
| 56 | 2.2 | 0.3 | 1.7 | 143 | 2.0 | 0.3 | 1.9 | ||
| 60 | 1.46 | 0.19 | 1.8 | 144 | 2.6 | 0.8 | 1.2 | ||
| 61 | 4.28 | 0.08 | 8.6 | 145 | 2.0 | 0.3 | 1.7 | ||
| 62 | 1.7 | 0.3 | 1.6 | 153 | 1.6 | 0.2 | 1.9 | ||
| 64 | 2.5 | 0.4 | 1.9 | 154 | 6.41 | 0.11 | 7.5 | ||
| 65 | 3.90 | 0.15 | 7.8 | 155 | 3.61 | 0.12 | 5.7 | ||
| 67 | 2.4 | 0.5 | 1.6 | 157 | 3.46 | 0.19 | 3.6 | ||
| 69 | 3.13 | 0.13 | 5.1 | 160 | 12.4 | 0.4 | 6.4 | ||
| 75 | 1.7 | 0.5 | 1.1 | 162 | 2.3 | 0.5 | 1.7 | ||
| 79 | 1.4 | 0.2 | 1.5 | 163 | 1.6 | 0.4 | 1.1 | ||
| 80 | 1.53 | 0.11 | 2.9 | 166 | 1.68 | 0.19 | 2.0 | ||
| 81 | 2.5 | 0.3 | 3.0 | 171 | 3.74 | 0.13 | 5.3 | ||
| 87 | 1.31 | 0.13 | 1.9 | 172 | 2.1 | 0.2 | 2.5 | ||
| 89 | 2.1 | 0.5 | 1.8 | 173 | 3.13 | 0.13 | 4.9 | ||
| 90 | 1.35 | 0.03 | 8.1 | 177 | 2.2 | 0.4 | 2.6 | ||
| 93 | 16.42 | 0.06 | 15.6 | 183 | 1.9 | 0.2 | 2.1 | ||
| 94 | 1.9 | 0.3 | 1.4 | 184 | 1.6 | 0.2 | 1.8 | ||
| 98 | 3.18 | 0.12 | 5.4 | 186 | 2.1 | 0.3 | 1.7 | ||
| 99 | 15.29 | 0.18 | 5.0 | 187 | 1.7 | 0.4 | 1.2 | ||
| 103 | 12.78 | 0.12 | 7.2 | 189 | 8.58 | 0.11 | 7.9 | ||
| Chandra and XMM-Newton: | |||||||||
| Source | flux max. | error | Source | flux max. | error | ||||
| 55 | 3.3 | 0.3 | 2.3 | 97 | 2.79 | 0.10 | 6.6 | ||
| 60 | 2.35 | 0.16 | 3.8 | 98 | 3.18 | 0.12 | 5.4 | ||
| 69 | 3.13 | 0.13 | 5.1 | 99 | 15.29 | 0.18 | 5.0 | ||
| 76 | 4.5 | 0.5 | 1.7 | 106 | 1.28 | 0.13 | 1.7 | ||
| 79 | 1.4 | 0.2 | 1.5 | 107 | 1.97 | 0.12 | 5.1 | ||
| 80 | 1.53 | 0.11 | 2.9 | 108 | 1.44 | 0.10 | 3.3 | ||
| 81 | 2.5 | 0.3 | 3.0 | 109 | 4.02 | 0.14 | 7.4 | ||
| 84 | 2.7 | 0.3 | 2.8 | 114 | 2.39 | 0.18 | 4.1 | ||
| 87 | 1.35 | 0.11 | 2.2 | 116 | 20.8 | 0.3 | 6.2 | ||
| 88 | 4.6 | 0.4 | 2.5 | 125 | 5.3 | 0.5 | 2.2 | ||
| 92 | 2.7 | 0.4 | 4.3 | 129 | 3.94 | 0.11 | 6.4 | ||
| 95 | 1.9 | 0.2 | 2.0 | ||||||
4.1 Variability of the sources
4.1.1 Short-term variability
For each XMM-Newton observation, we searched for pulsations of the brightest sources (counts ) on time scales between s and the time duration of each observation. After extracting the event files, we applied both a Fourier transform and a analysis (Buccheri et al., 1983). No statistically significant variability from the analysed sources was detected.
4.1.2 Long-term variability
To study the long-term time variability of sources observable at least in two different observations, we calculated the average flux (or the upper limit in case of non-detection) at the source position in each observation. We considered fluxes in the keV energy band because, as Pietsch et al. (2004) noted, the band keV has a lower sensitivity and is contaminated by hard background. We calculated the fluxes with the energy conversion factors (ECFs) reported in Table 2. Then, we searched for variable sources by comparing their fluxes (or upper limits) in different observations. We measured the X-ray variability of each source by its variability factor , where and are the maximum and minimum (or upper-limit) fluxes. To estimate the significance of the variability between different observations, we calculated the significance parameter , where and are the errors of the maximum and minimum flux (Primini et al., 1993).
We also studied the X-ray variability considering the Chandra observation of M 83. We converted the Chandra counts ( keV) of SW03 to keV fluxes with the conversion factor calculated by SW03 and the distance of M 83 ( Mpc) assumed in this work. The conversion factor erg s-1 counts-1 was calculated by SW03 assuming an absorbed powerlaw spectrum with , cm-2, and a distance of Mpc. For each Chandra source, we obtained the flux in the energy range keV correcting the luminosity counts by the absorption column density, the galaxy distance, and the energy range. The results are reported in Table 3.
Fig. 2 shows the variability factor plotted versus the maximum detected flux and the hardness ratio (R2-R1)/(R1+R2) (see section 4.3) for each source. The left column shows the variability factors calculated for sources observed in at least two XMM-Newton observations. The right column shows the variability factors calculated for sources observed with Chandra and in at least one XMM-Newton observation.
Applying a variability significance threshold of , we found 35 variable sources. Like XRBs and AGNs, SSSs can show high variability, and because of their soft spectrum (see section 5.6), they can be distinguished from the other sources: in Fig. 2 (lower panels), SSSs candidates should appear on the left-hand side, while XRBs (characterized by a much harder spectrum) are expected to appear on the right-hand side.
4.2 Spectral analysis
We extracted the X-ray spectra of sources with counts in the energy range keV. For each source, we fitted all three EPIC spectra simultaneously with different models: powerlaw, disc-blackbody, thermal plasma model (APEC Smith et al. 2001), and blackbody, using XSPEC (ver. 12.7.0, Arnaud 1996). For the absorption we used the PHABS model.
A good fit with one of the above-mentioned spectral models can be used to classify the sources into one of the following classes of sources:
-
•
X-ray binaries;
-
•
supernova remnants;
-
•
super-soft sources.
In total, we fitted the spectra of 12 sources (see section A).
For sources that are not bright enough for spectral modelling, we only calculated their hardness ratios, as described in section 4.3.
4.3 Hardness-ratio diagrams
We used the hardness-ratio diagrams to separate different classes of sources according to their X-ray properties. They are especially helpful for sources that are too faint, for which spectral fitting is not possible. For each source, we computed four hardness ratios, defined as
| (1) |
where are the net source counts in five energy bands. To obtain the best statistics we combined the hardness-ratios of all three instruments.
When a source was detected in more than one observation, we considered the observation with the highest number of counts. Some sources can exhibit different spectral states (which can be correlated with the X-ray flux), resulting in hardness-ratio changes between different observations (see e.g. Done et al. 2007). Therefore, for some of these sources we only considered a state by adopting the highest number of counts when determining the hardness ratio. This approach allowed us to obtain the hardness ratios with small uncertainties for bright sources in their bright states. However, one has to be aware that if a source changes its state, the hardness-ratio may change as well. For fainter sources (with hardness ratio uncertainties ), the hardness ratios are not sensitive to changes of the state of the source within uncertainties. The hardness ratios calculated for each source are reported in Table LABEL:Tab._source_list.
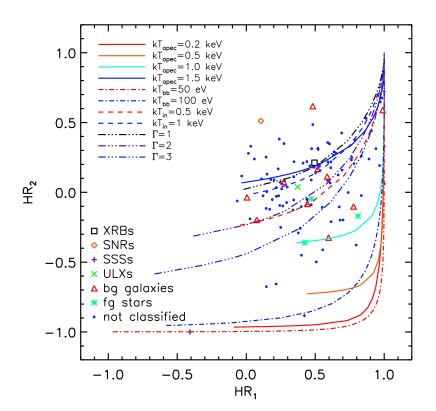
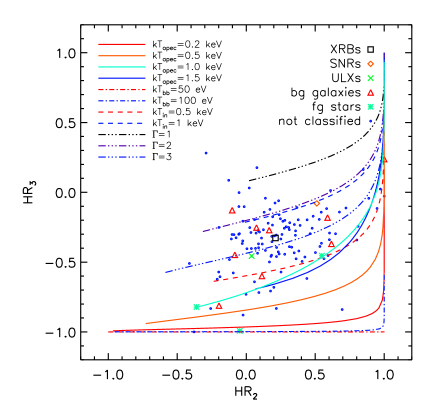
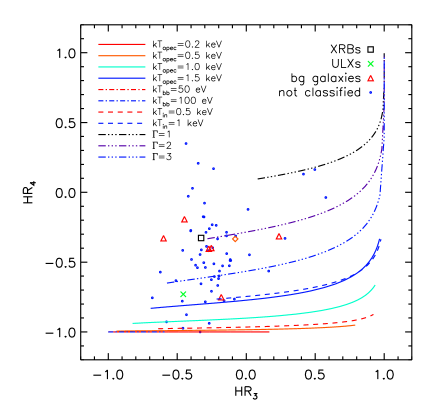
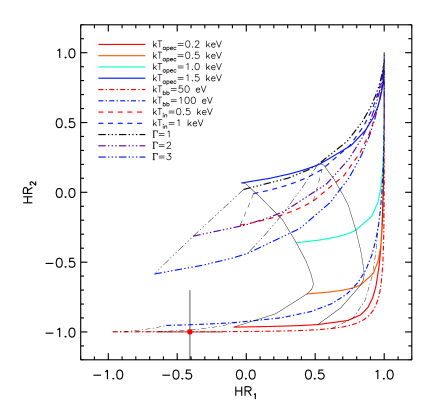
Fig. 3 shows the hardness ratios of sources with errors smaller than , detected in the field of view of M 83. We plotted sources classified as XRBs, SNRs, SSSs, ultra-luminous X-ray sources (ULXs), foreground stars, and background objects (see section 5) with different symbols. On the same plot we also overlaid grids of hardness ratios calculated for different spectral models: three absorbed powerlaws with photon-index , , (XRBs in hard state), two absorbed disc-blackbody models with temperatures at the inner disc radius of and keV (XRBs in soft state), four thermal plasma models APEC with temperatures , , , keV (SNRs), and two blackbody models with temperatures and eV (SSSs, see section 5.6). The column densities range from cm-2 to cm-2.
5 Source classification
We cross-correlated the list of sources observed with XMM-Newton with existing catalogues. For this purpose we used X-ray (Trinchieri et al. 1985; Ehle et al. 1998; Immler et al. 1999; SW03; Di Stefano & Kong 2003), optical (Blair & Long 2004; Dopita et al. 2010; Jones et al. 2004; Rumstay & Kaufman 1983; USNO-B1, Monet et al. 2003), radio (Maddox et al. 2006; Cowan et al. 1994; Condon et al. 1998), and infrared (2MASS, Skrutskie et al. 2006) catalogues.
We considered two sources as associated to each other if their positions were closer than the combined statistical errors. The optical counterparts of several X-ray sources cannot be determined uniquely. In such cases we assumed as counterpart the brightest optical object within the error circle. The cross-correlations are reported in Table LABEL:Tab._source_list_classification in appendix B.
We used the previous classifications in X-rays and other wavelengths and the methods of classification described in sections 4.1 (X-ray variability), 4.2 (spectral analysis), and 4.3 (hardness ratios), to identify and classify sources as background objects, foreground stars, XRBs, SNRs, SSSs, and ULXs.
In this section we describe the observational properties for each class of sources and define the classification criteria.
5.1 Foreground stars
X-ray observations of nearby galaxies are contaminated by foreground stars, which have X-ray luminosities ranging from to erg s-1 for stars of spectral type F to M, and to erg s-1 for stars of spectral types O and B (Vaiana et al. 1981; Rosner et al. 1985). Stars of spectral classes F to M emit X-rays because of the intense magnetic fields that form a corona, in which the plasma is heated to temperatures of about K (e.g. Güdel 2002). A mechanism proposed to explain the X-ray emission from stars of spectral types O-B is the formation of shocks in the coronal regions due to the instability of the wind-driven mechanism (see Puls et al. 2008 and references therein). In A-type stars, none of the above mechanisms for X-ray emission can operate efficiently. Therefore, A-type stars are expected to be weak X-ray sources (Schröder & Schmitt, 2007) and only very few have been observed in X-rays (see e.g. Robrade & Schmitt 2010; Schröder et al. 2008).
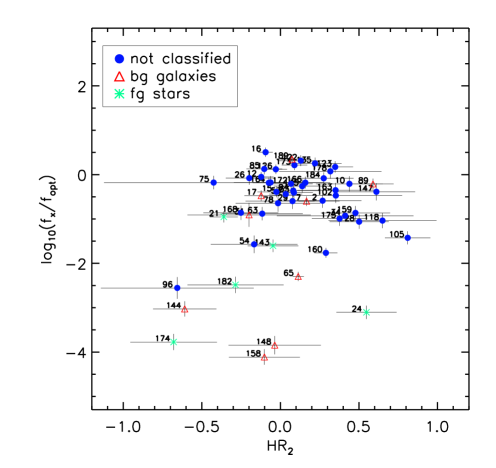
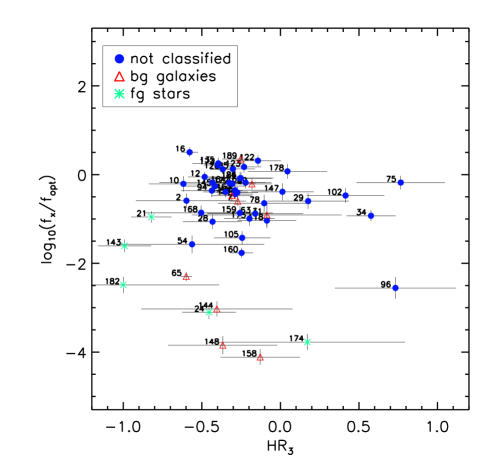
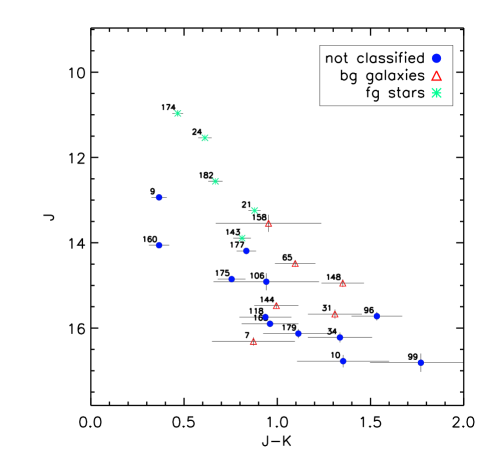
The X-ray spectra of foreground stars are relatively soft and can be described by models of optically thin plasma in collisional equilibrium (e.g. Raymond & Smith 1977) with temperatures ranging from to K. A common method to distinguish stars from other X-ray sources is comparing the X-ray-to-optical flux ratio, as suggested by Maccacaro et al. (1988):
| (2) |
where is the visual magnitude . In the USNO-B1 catalogue the red and blue magnitudes are given, thus we assumed . We used the blue magnitude as magnitude when the red magnitude was not available.
For each X-ray source with an optical counterpart, we distinguished foreground stars from other sources by plotting X-ray-to-optical flux ratios over the hardness ratios and (Fig. 5). The X-ray-to-optical flux ratios and the hardness ratios differ significantly between different classes of sources.
The soft X-ray flux of early-type stars (OB type) scales with (Kudritzki & Puls 2000 and references therein), while the ratio of late-type stars (F to M) usually ranges from to (e.g. Krautter et al. 1999). In contrast, sources such as SNRs, SSSs, and XRBs radiate mainly in X-rays.
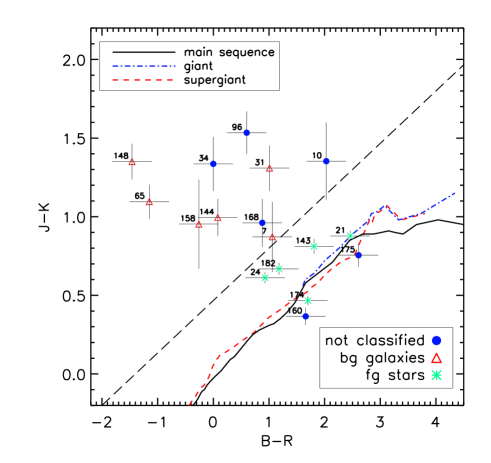
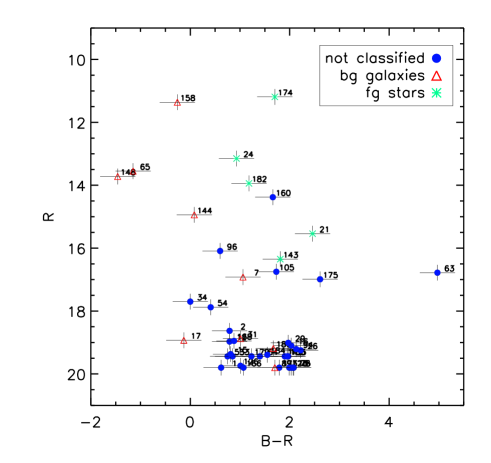
We also used optical and near-infared magnitudes and colours to classify foreground stars (Figs. 4 and 6). Fig. 4 is the colour-colour diagram for XMM-Newton sources with optical (USNO-B1) and infrared (2MASS) counterparts. Lines show the expected and colours for main-sequence, giant, and supergiant stars belonging to the Milky Way. We obtained these lines using intrinsic colours calculated by Johnson (1966). Stars located at the Galactic latitude of M 83 () have on average a colour excess per kiloparsec of mag kpc-1 (Gottlieb & Upson, 1969). Therefore, the colour excesses and are negligible compared to the optical and infrared magnitude uncertainties (Schild, 1977).
Figs. 4 and 6 allow to separate foreground stars from other classes of sources. Foreground stars are brighter in than background objects or members of M 83, and sources with and are most likely foreground stars.
From previous considerations, we classified foreground stars when these conditions were met:
-
•
;
-
•
;
-
•
;
-
•
;
-
•
.
The five sources classified as foreground star candidates are reported in Table 4. A detailed discussion of the identification and classification of foreground stars is provided in sections A.1 and A.2.
| No. | RA | Dec | USNO-B1 | B mag. | R mag. |
|---|---|---|---|---|---|
| (J2000) | (J2000) | ||||
| 21 | 13 36 18.73 | -30 01 38.1 | 0599-0299962 | 18.0 | 15.5 |
| 24 | 13 36 19.95 | -29 51 08.3 | 0601-0298625 | 14.1 | 13.2 |
| 143 | 13 37 27.29 | -29 55 45.5 | 0600-0300561 | 18.2 | 16.4 |
| 174 | 13 37 44.79 | -30 07 49.2 | 0598-0301638 | 12.9 | 11.2 |
| 182 | 13 37 57.77 | -30 01 40.6 | 0599-0300696 | 15.1 | 13.9 |
5.2 Background objects
The identification of AGNs, normal galaxies, and galaxy clusters is based on SIMBAD and NED correlations, and is confirmed if there is an optical counterpart in the 2nd Digitized Sky Survey (DSS2) image. New classifications are based on the radio counterpart and hardness ratio (Pietsch et al., 2004).
We identified nine sources as background galaxies and AGNs (sources No. 7, 17, 31, 65, 83, 89, 144, 148, 158, see Table 5). We found radio counterparts of the sources No. 20, 37, 189 and classified them as AGN candidates for the first time (see section A.3). Based on the calculated by Cappelluti et al. (2009) (see section 6.2), about observed sources (with a keV flux erg cm-2 s-1) are expected to be background objects in each XMM-Newton observation of Table 1. From a comparison with other works (e.g. Misanovic et al. 2006), we expect a large difference between the predicted number of background objects from background surveys and the number of identified/classified background objects in an XMM-Newton observation. This difference is due to the difficulty in classifying sources which, because of their distance, are too faint (and therefore provide little information) to be classified with the methods at our disposal.
| No. | RA | Dec | Name |
|---|---|---|---|
| (J2000) | (J2000) | (SIMBAD) | |
| Identifications: | |||
| 7 | 13 36 04.66 | -30 08 30.8 | QSO B1333298 |
| 17 | 13 36 15.42 | -29 57 58.2 | [I1999] 53 |
| 31 | 13 36 28.13 | -29 42 27.9 | 2MASS 133628212942266 |
| 65 | 13 36 45.78 | -29 59 13.0 | 6dFGS gJ133645.8295913 |
| 83 | 13 36 58.26 | -29 51 04.3 | [MCK2006] 281 |
| 89 | 13 36 59.68 | -30 00 58.8 | [BRK2009] 72 |
| 144 | 13 37 27.46 | -30 02 28.3 | 6dFGS gJ133727.5300228 |
| 148 | 13 37 29.36 | -29 50 27.4 | 6dFGS gJ133729.5295028 |
| 158 | 13 37 32.94 | -29 51 01.2 | ESO 44485 |
| New classifications: | |||
| 20 | 13 36 18.21 | -30 15 00.5 | NVSS J133618301459 |
| 37 | 13 36 30.53 | -30 16 57.0 | NVSS J133630301651 |
| 189 | 13 38 05.57 | -29 57 45.4 | NVSS J133805295748 |
5.3 Nuclear sources
We detected two bright sources in the nuclear region of M 83 with the source detection procedure: sources No. 92 and No. 95. They are separated by and are the brightest sources detected with XMM-Newton in M 83 ( erg cm-2 s-1; erg cm-2 s-1; keV, assuming an absorbed powerlaw spectrum with index 1.8 and a foreground Galactic absorption of cm-2). The two nuclear sources coincide with Chandra sources and the bright diffuse emission of the starburst nucleus, not resolved by XMM-Newton because of its high PSF, which causes source confusion in crowded regions, such as the nuclear region of M 83.
5.4 X-ray binaries
We classified sources as XRBs if the X-ray spectra or hardness ratios were compatible with the typical spectra of XRBs and we detected a flux periodicity.
We identified two X-ray binaries (Nos. 81 and 120), previously classified by SW03 using Chandra observations (section A.4).
5.5 Supernova remnants
We assume that the X-ray spectra of SNRs are well described by the thermal plasma model APEC (Smith et al., 2001), with temperatures ranging from to keV. At this distance we are unable to resolve an SNR or to verify a more detailed spectral model assuming, e.g., a non-equilibrium ionisation.
We classified an X-ray source as SNR if , , the source was not a foreground star, and did not show a significant variability (Pietsch et al., 2004).
We identified the source No. 79 as source [SW03] 27, classified as a young SNR candidate by SW03 (section A.5).
SN1957D
Long et al. (2012) reported the first detection of SN1957D in X-rays with Chandra. The source shows a luminosity of erg cm-2 s-1 ( Mpc, Saha et al. 2006; keV), and the spectrum is well modelled with an absorbed powerlaw with an index , a foreground Galactic absorption of cm-2 and an intrinsic column density of cm-2. We did not detect SN1957D in the XMM-Newton observations. In observation 1 the source is located near to the centre of the field of view, and in the other two observations the source is located at the edge of the field of view. Assuming the spectral parameters found by Long et al. (2012), we calculated a upper-limit in observation 1 of erg cm-2 s-1 ( keV), corresponding to a luminosity of erg s-1, well above the luminosity detected by Long et al. (2012).
5.6 Super-soft sources
Super-soft sources are a class of sources that are believed to be binary systems containing a white dwarf. The white dwarf accretes matter from a Roche-lobe-filling companion at high rates ( M⊙ yr-1), which leads to quasi-steady nuclear burning on its surface (see e.g. van den Heuvel et al. 1992). SSSs show soft spectra with blackbody temperatures of eV and X-ray luminosities ranging from erg s-1 to erg s-1 (Di Stefano & Kong 2003; Kahabka & van den Heuvel 1997). An additional harder component, due to interactions of the radiation with matter near to the white dwarf or wind interactions can be observed (Di Stefano & Kong, 2003). Moreover, SSSs are often observed as transient X-ray sources (see Greiner 2000). Other classes of sources with soft spectra can be confused with SSSs. For example, some X-ray pulsars observed outside the beam of the pulsed radiation can show a soft ( eV) component (Hughes 1994; Di Stefano & Kong 2003). Moreover, stripped cores of giant stars can be classified as SSSs (Di Stefano et al., 2001).
As our classification criteria, we assumed blackbody temperatures of eV (in agreement with the selection procedure proposed by Di Stefano & Kong 2003) and hardness ratios that do not overlap with those of other classes of sources. These criteria are an and . We classified a source as SSS only if both criteria are fulfilled.
5.7 Hard sources
Hard sources show hard X-ray spectra (or hard HRs, see Table 5 in Pietsch et al. 2004). Using their spectral properties and hardness ratios, we classified five hard sources (Nos. 16, 61, 103, 126, and 153; see section A.8.1) and we identified 11 hard sources (Nos. 60, 80, 92, 97, 99, 106, 107, 108, 114, 116, 129; see section A.8.2).
5.8 Ultra-luminous X-ray sources
ULXs are pointlike non-nuclear sources with X-ray luminosities in excess of the Eddington limit ( erg s-1) for a stellar mass black-hole (see e.g. Feng & Soria 2011). They are usually located in active star-forming environments (Miller & Colbert, 2004), and their nature is still unclear; recent studies indicate that ULXs are a heterogeneous sample of objects (e.g. Gladstone 2011).
Several models have been proposed to explain the high X-ray luminosity of ULXs, but there are three models that are often used for this class of sources. The first model requires that ULXs are intermediate-mass black-hole systems (IMBHs) with masses M⊙, accreting at sub-Eddington rates (e.g. Colbert & Mushotzky 1999). The other models assume that ULXs are stellar-mass black holes (with masses M⊙) in a super-Eddington accretion regime (Poutanen et al., 2007) or with beamed radiation (see e.g. King 2009).
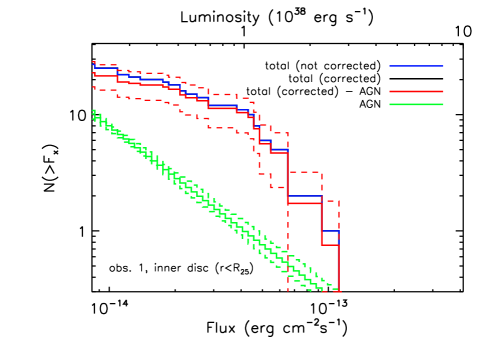
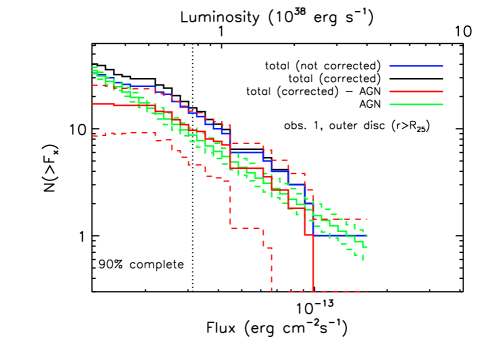
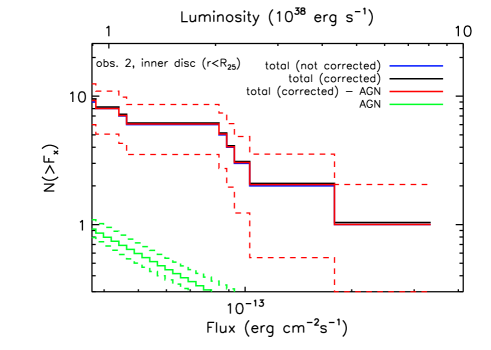
6 X-ray luminosity functions
For each observation, we calculated the XLFs in the energy range keV excluding the softer bands to reduce the effect of incompleteness of the observed source sample due to absorption. Moreover, from an XLF calculated in this energy band, it is possible to easily subtract the contribution of the of the AGNs, which was calculated from several surveys performed by XMM-Newton and Chandra (see section 6.2).
We considered for XLFs only sources with a detection likelihood greater than 6 in the energy range keV. For each source, we converted the count rates to the keV fluxes using the ECFs of Table 2 for the energy bands R4 and R5.
We excluded the region inside a circle centred on the nuclear region of M 83 with radius from the XLF calculation, where the large PSF of EPIC in a crowded region causes source confusion effects (see section 5.3). Since we were interested in obtaining XLFs of XRBs, we also excluded the sources previously classified as SNRs, SSSs, ULXs, and foreground stars (section 5). For each observation, we calculated the XLFs of sources detected within two regions of M 83: the inner disc inside the ellipse, and the outer disc outside the ellipse.
6.1 XLFs corrected for incompleteness

The sensitivity of the EPIC instruments depends on the exposure, background, and PSF, which are not uniform across the FOV. Indeed, the exposure time is relatively high at the centre of the FOV and decreases with increasing off-axis angle (vignetting effect). The background, modelled by the task esplinemap, decreases with increasing angular distance from the nuclear region of M 83 (due to the diffuse emission in the disc of M 83), and the optical properties of the X-ray telescope introduce a degradation of the PSF with increasing off-axis angle. Therefore, the sensitivity also varies across the observed area, allowing the detection of the brightest sources across the entire observed area, whereas the effective area for the detection of faint sources is smaller. This effect leads to an underestimation of the number of sources observed at the faintest flux levels.
We corrected the XLFs by taking into account the incompleteness effect described above by calculating the sky coverage function, which is the effective area covered by the observation as a function of flux. For each observation, we first created the combined sensitivity maps of PN, MOS1, and MOS2 with the SAS task esensmap, which requires as input files the exposure maps, the background images, and the detection masks created by the source detection procedure. We used the sensitivity maps to calculate the sky coverage function for each observation (Fig. 7). The cumulative XLF corrected for incompleteness is given by
| (3) |
where is the number of sources with a flux higher than , weighted by the fraction of the surveyed area over which sources with flux can be detected; is the total area of the sky observed by EPIC, is the sky coverage (Fig. 7), and is the total number of the detected sources. Therefore, with equation (3), every source is weighted with a factor correcting for incompleteness at its flux. The variance of the source number counts is defined as
| (4) |
6.2 AGN-corrected XLFs
The XLFs obtained in section 6.1 consist of sources belonging to M 83 (XRBs) and AGNs. We subtracted the AGN contribution using the AGN XLF of Cappelluti et al. 2009, who derived the XLFs from the 2 deg2 of the XMM-COSMOS survey (Scoville et al., 2007). These authors found that the XLF of AGNs in the energy range keV is described by a broken powerlaw:
| (5) |
where is the normalisation, , , erg cm-2 s-1, and .
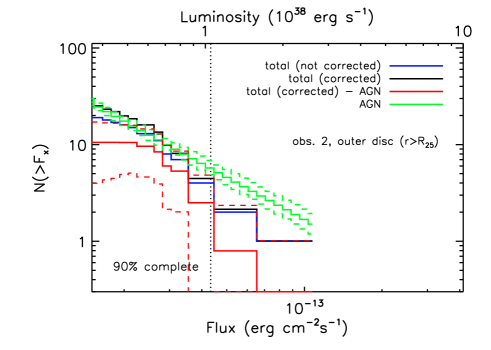
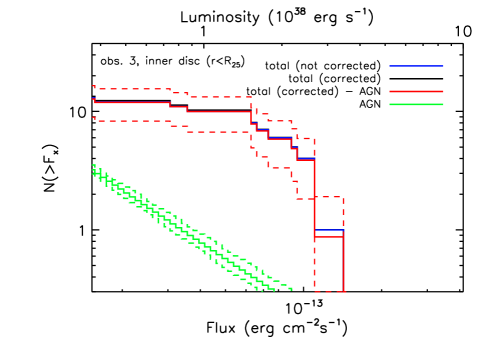
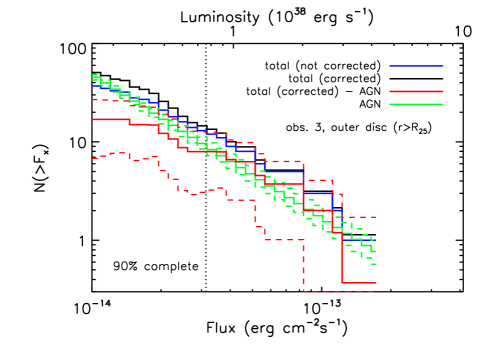
Fig. 8 shows the XLFs of sources detected within the ellipse and outside, calculated for each XMM-Newton observation. Blue lines are the observed XLFs, and black lines are the XLFs corrected for incompleteness. Solid green lines are the AGN XLFs of equation (5) with relative uncertainties (dashed green lines). Solid red lines show the XLFs corrected for incompleteness and AGN-subtracted, and dashed red lines are the 90% confidence errors, obtained from equation (4) and the 90% confidence errors of the AGN distribution.
6.3 Fit
We fitted the differential XLFs corrected for incompleteness and AGN-subtracted with a powerlaw:
| (6) |
where is the normalisation and the powerlaw index.
We also fitted the differential XLFs with a broken powerlaw:
| (7) |
where is the break point. The resulting parameters obtained from the fit are reported in Table 6.
6.3.1 Inner disc
From Chandra observation, SW03 calculated the XLFs of sources located in the inner region (distance from the nucleus) and outer region () of the optical disc. They found that the inner region sources have a powerlaw luminosity distribution with an differential index of , while the luminosity distribution of the outer region sources shows a lack of bright sources above erg s-1. These authors modelled the XLF of these sources with a broken powerlaw with a break around erg s-1 and differential indices of and . They explained the XLF of the inner region sources in terms of current starburst activity, while the XLF of the outer region may result from an older population of disc sources mixing with a younger population.
We recall that we cannot study the innermost region because of poor spatial resolution of XMM-Newton compared to Chandra. We compared the best-fitting parameters of the XLF of the outer region sources () obtained by SW03 with those obtained from the XMM-Newton analysis (Table 6). In particular, we considered the broken powerlaw fit of sources detected in observation 1. Only during this observation was the whole optical disc of M 83 observed. We found that the indices , and the break of equation 7 agree within the uncertainties with the parameters found by SW03.
Grimm et al. (2003) studied the XLFs of a sample of galaxies and found the probable existence of a universal HMXB XLF (in the luminosity range erg s-1), described by a powerlaw with differential slope of . They found that the number of HMXBs with erg s-1 in a star-forming galaxy is directly proportional to the SFR, and proposed that the number and the total X-ray luminosity of HMXBs can be used to measure the star formation rate of a galaxy. Based on a much larger sample of galaxies, Mineo et al. (2012) found that the properties of populations of HMXBs and their relation with the SFR agree with those obtained by Grimm et al. (2003). We estimated the SFR in the optical disc of M 83 using the SFR relation of Mineo et al. (2012):
| (8) |
We assumed that the XLF we used for this calculation provides a good approximation of the HXMB XLF in M 83. The contribution of LMXBs to the XLF is negligible for a starburst galaxy such as M 83 when erg s-1 (Grimm et al., 2003). Moreover, the contribution of LMXBs to the XLF is minimized by excluding the nuclear region of the galaxy, from which a strong contribution to the total number of LMXBs is expected. Using the XLF of sources detected in observation 1 within the ellipse, from equation 8 we found an SFR M⊙ yr-1, in agreement with the SFR estimates obtained from observations in other wavelengths (see e.g. Boissier et al. 2005; Dong et al. 2008; Grimm et al. 2003 and references therein).
6.3.2 Outer disc
The XLFs of the outer disc () show an excess of sources (with respect to the expected number of AGNs) in the luminosity range to erg s-1 (Fig. 8).
We are interested in calculating the probability of the luminosity distribution of the observed sources to be consistent with the luminosity distribution of equation (5) which represents the AGN distribution. Therefore, we compared for each observation the luminosity distribution of the sources detected in the outer disc () that was not corrected for incompleteness (see section 6) with a distribution of simulated sources over the EPIC FOV obtained from a uniform spatial distribution of sources with a luminosity distribution given by equation (5), filtered to exclude sources with a flux below the detection threshold calculated at the position of each source in the sensitivity map. The Kolmogorov-Smirnov test applied to these source samples showed that the probabilities that the luminosity distributions of the observed sources are consistent with the luminosity distribution of AGNs (equation 5) are almost zero, being % in observation 1, % in observation 2, and % in observation 3.

To quantify the probability that the set of X-ray sources located outside the ellipse are AGNs (which are expected to be uniformly distributed across the sky) or XRBs (whose distribution should not be uniform, because the position of XRBs should correlate with the arms extending out of the optical disc), we performed a two-dimensional Kolmogorov-Smirnov test (Fasano & Franceschini 1987; Peacock 1983). This test is based on the statistic , which in the unidimensional Kolmogorov-Smirnov test represents the largest difference between two cumulative distributions. We applied this test to two data samples:
-
1.
all X-ray sources detected in observation 1 that are located outside the ellipse. The number of these sources is ;
-
2.
a distribution of simulated sources in the EPIC FOV of observation 1, obtained from a uniform spatial distribution of sources (which represents the uniform spatial distribution of AGNs) modified to take into account the incompleteness effect described in section 6.1. We obtained this spatial distribution of sources as follows. We first generated a uniform spatial distribution of sources with fluxes given by the XLF of AGNs described in section 6.2. Then, we selected sources with flux higher than that corresponding to the position of each source in the sensitivity map. We additionally selected sources with luminosity erg s-1 in the energy range keV that are located outside the ellipse. With this method, we generated a sample of coordinate pairs (RA, Dec) of sources (see Fig. 9).
From the number of data points and of the two data sets, the significance level was calculated from the probability distribution of the quantity
| (9) |
where . The analytical formula for calculating of the probability that the two data samples come from the same distribution is accurate enough for large data sets with (Fasano & Franceschini, 1987). Since in our case , we needed to use Monte Carlo simulations. We generated many synthetic data samples simulating the uniformly distributed AGNs with the same method previously used to calculate sample 2; each of the synthetic data samples has the same number of sources as the observed data set 1 (). For each data set we applied the 2D Kolmogorov-Smirnov test by comparing the synthetic data set with the set of sources distributed across the EPIC FOV previously described, then we calculated the quantity using equation (9). The probability of the observed is given by the fraction of the times the simulated are larger than the observed .
Applying this statistical method to our data, we found a probability of % that the observed sample 1 and the simulated homogeneously distributed sample 2 are significantly different, which suggests a non-uniform distribution of the observed X-ray sources and therefore a possible correlation between the positions of these sources and the extended arms of M 83.
The incompleteness correction given by equation (3) is based on the hypothesis that sources are uniformly distributed. However, we have demonstrated that the X-ray sources located outside the ellipse have a non-uniform distribution, hence the associated XLFs corrected for incompleteness of Fig. 8 (right column) are not reliable at low luminosities. Therefore we only considered the part of the XLFs with luminosities higher than the level at which the survey is 90% complete (to the right of the vertical black lines in Fig. 8). We found that the 90% complete XLFs of observations 1 and 3 (for which we have enough data points to find a good fit) are well fitted with a powerlaw with differential slopes (observation 1), and (observation 3), which are consistent with each other within errors. These are also consistent with the AGN slope of Cappelluti et al. (2009).
Assuming that the spatial distribution of AGNs and their number density are not subject to strong fluctuations on small angular scales corresponding to different directions in the M 83 field, the observed excess of sources (with respect to the AGN distribution) in the luminosity range to erg s-1 (Fig. 8) can probably be ascribed to a population of XRBs located in the outer disc of M 83. The recent star-forming activity discovered by GALEX in this region indicates that a large portion of the observed X-ray sources are HMXBs. However, the observed XLF slope is steeper than the slope of the universal HMXB XLF inferred by Grimm et al. (2003). A possible explanation for the difference between the two slopes could be that the observed XLFs are the result of a mix of XRB populations formed after starbursts of different ages. An alternative explanation is that the mass distribution of the population of stars in the low-density regions of the outer disc of M 83 is described by a truncated initial mass function (IMF), whose existence was proposed to explain the production of fewer high-mass stars (compared to the standard IMF) in low-density environments (see e.g. Krumholz & McKee 2008; Meurer et al. 2009). The universality of the IMF is still a matter of debate (Bastian et al., 2010); in this context, a recent Subaru H observation of the outer disc of M 83 revealed O stars even in small clusters ( M⊙), which supports the hypothesis that the IMF is not truncated in low-density environments (Koda et al., 2012).
7 Summary
We presented an analysis of three XMM-Newton observations of M 83. We performed the source detection procedure separately for images of each observation, and we obtained a catalogue containing 189 sources.
Based on cross-correlations with other catalogues we identified counterparts for 103 sources, 12 of which were identified or classified as background objects and 5 as foreground stars (one as candidate CV). We performed spectral analysis of the sources with the largest number of counts, as well as studies of the X-ray variability and the hardness ratio diagrams. The spectral analysis of ULX No. 133 in observations 2 and 3 showed good fits with the standard IMBHs model as well as with accreting stellar-mass black-hole model, in agreement with the results obtained by Stobbart et al. (2006) from observation 1.
In Sect. 6 we presented the XLFs of sources in the keV energy band, within and outside the ellipse. We corrected the XLFs for incompleteness and subtracted the contribution of background AGNs from the total XLF to obtain the XLFs of XRBs. The XLF of the optical disc is well fitted with a powerlaw or a broken powerlaw, while the XLF of the outer disc is well fitted with a simple powerlaw. The broken powerlaw fit parameters agree (within the uncertainties) with the parameters found by SW03 with Chandra. From the XMM-Newton XLF, we obtained an SFR M⊙ yr-1 in the optical disc of M 83, which agree with previous estimates obtained in other wavelengths.
The XLFs of these sources show an excess of sources (compared to the AGNs distribution) in the luminosity range to erg s-1. The application of the Kolmogorov-Smirnov test to the X-ray sources detected outside the ellipse allowed us to find that this population of sources is significantly different from the population of background AGNs, which is supposed to have a homogeneous distribution. These results led us to suggest that a part of the X-ray sources observed outside the ellipse belongs to the outer disc of M 83. The 90% complete XLFs of the outer disc are well fitted with a simple powerlaw with differential slope (observation 1), and (observation 3) steeper than the universal HMXB XLF discovered by Grimm et al. (2003). We proposed as a possible origin for the steep slope of the observed XLF that the observed XLFs are the result of a mix of XRB populations of different ages, or, as an alternative explanation, that the IMF in the low-density regions of the outer disc of M 83 is truncated, as previously suggested by e.g. Krumholz & McKee (2008) and Meurer et al. (2009) to explain the low production of high-mass stars in low-density environments. Additional X-rays and UV observations of the outer disc of M 83, analysed with most effective methods such as the one used by Bodaghee et al. (2012) to measure the spatial cross-correlation of HMXBs and OB star-forming complexes in the Milky-Way, will be fundamental to confirm our hypothesis.
Acknowledgements.
We thank the referee Eric M. Schlegel for constructive comments, which helped to improve the manuscript. This research is funded by the Deutsche Forschungsgemeinschaft through the Emmy Noether Research Grant SA 2131/1. This research has made use of the SIMBAD database, operated at CDS, Strasbourg, France, and of the NASA/IPAC Extragalactic Database (NED), which is operated by the Jet Propulsion Laboratory, California Institute of Technology, under contract with the National Aeronautics and Space Administration. This publication has made use of data products from the Two Micron All Sky Survey, which is a joint project of the University of Massachusetts and the Infrared Processing and Analysis Center, funded by the National Aeronautics and Space Administration and the National Science Foundation. This research has made use of SAOImage DS9, developed by Smithsonian Astrophysical Observatory.References
- Arnaud (1996) Arnaud, K. A. 1996, in Astronomical Society of the Pacific Conference Series, Vol. 101, Astronomical Data Analysis Software and Systems V, ed. G. H. Jacoby & J. Barnes, 17
- Bastian et al. (2010) Bastian, N., Covey, K. R., & Meyer, M. R. 2010, ARA&A, 48, 339
- Bigiel et al. (2010) Bigiel, F., Leroy, A., Seibert, M., et al. 2010, ApJ, 720, L31
- Blair & Long (2004) Blair, W. P. & Long, K. S. 2004, ApJS, 155, 101
- Blair et al. (2012) Blair, W. P., Winkler, P. F., & Long, K. S. 2012, ApJS, 203, 8
- Bodaghee et al. (2012) Bodaghee, A., Tomsick, J. A., Rodriguez, J., & James, J. B. 2012, ApJ, 744, 108
- Boissier et al. (2005) Boissier, S., Gil de Paz, A., Madore, B. F., et al. 2005, ApJ, 619, L83
- Bresolin et al. (2009) Bresolin, F., Ryan-Weber, E., Kennicutt, R. C., & Goddard, Q. 2009, ApJ, 695, 580
- Buccheri et al. (1983) Buccheri, R., Bennett, K., Bignami, G. F., et al. 1983, A&A, 128, 245
- Cappelluti et al. (2009) Cappelluti, N., Brusa, M., Hasinger, G., et al. 2009, A&A, 497, 635
- Colbert & Mushotzky (1999) Colbert, E. J. M. & Mushotzky, R. F. 1999, ApJ, 519, 89
- Condon et al. (1998) Condon, J. J., Cotton, W. D., Greisen, E. W., et al. 1998, AJ, 115, 1693
- Cowan et al. (1994) Cowan, J. J., Roberts, D. A., & Branch, D. 1994, ApJ, 434, 128
- Cruddace et al. (1988) Cruddace, R. G., Hasinger, G. R., & Schmitt, J. H. 1988, in European Southern Observatory Conference and Workshop Proceedings, Vol. 28, European Southern Observatory Conference and Workshop Proceedings, ed. F. Murtagh, A. Heck, & P. Benvenuti, 177–182
- Davidge (2010) Davidge, T. J. 2010, ApJ, 718, 1428
- de Vaucouleurs et al. (1992) de Vaucouleurs, G., de Vaucouleurs, A., Corwin, Jr., H. G., et al. 1992, VizieR Online Data Catalog, 7137, 0
- Di Stefano et al. (2001) Di Stefano, R., Greiner, J., Murray, S., & Garcia, M. 2001, ApJ, 551, L37
- Di Stefano & Kong (2003) Di Stefano, R. & Kong, A. K. H. 2003, ApJ, 592, 884
- Done et al. (2007) Done, C., Gierliński, M., & Kubota, A. 2007, A&A Rev., 15, 1
- Dong et al. (2008) Dong, H., Calzetti, D., Regan, M., et al. 2008, AJ, 136, 479
- Dopita et al. (2010) Dopita, M. A., Blair, W. P., Long, K. S., et al. 2010, ApJ, 710, 964
- Ehle et al. (1998) Ehle, M., Pietsch, W., Beck, R., & Klein, U. 1998, A&A, 329, 39
- Fabbiano (2006) Fabbiano, G. 2006, ARA&A, 44, 323
- Fasano & Franceschini (1987) Fasano, G. & Franceschini, A. 1987, MNRAS, 225, 155
- Feng & Soria (2011) Feng, H. & Soria, R. 2011, New A Rev., 55, 166
- Gilfanov (2004) Gilfanov, M. 2004, MNRAS, 349, 146
- Gladstone (2011) Gladstone, J. C. 2011, ArXiv e-prints
- Gottlieb & Upson (1969) Gottlieb, D. M. & Upson, II, W. L. 1969, ApJ, 157, 611
- Greiner (2000) Greiner, J. 2000, New A, 5, 137
- Grimm et al. (2003) Grimm, H.-J., Gilfanov, M., & Sunyaev, R. 2003, MNRAS, 339, 793
- Guainazzi (2012) Guainazzi, M. 2012, XMM-Newton Calibration Technical Note; XMM-SOC-CAL-TN-0018
- Güdel (2002) Güdel, M. 2002, Royal Society of London Philosophical Transactions Series A, 360, 1935
- Harris et al. (2001) Harris, J., Calzetti, D., Gallagher, III, J. S., Conselice, C. J., & Smith, D. A. 2001, AJ, 122, 3046
- Hughes (1994) Hughes, J. P. 1994, ApJ, 427, L25
- Immler et al. (1999) Immler, S., Vogler, A., Ehle, M., & Pietsch, W. 1999, A&A, 352, 415
- Irwin et al. (1994) Irwin, M., Maddox, S., & McMahon, R. 1994, IEEE Spectrum, 2, 14
- Johnson (1966) Johnson, H. L. 1966, ARA&A, 4, 193
- Jones (1977) Jones, C. 1977, ApJ, 214, 856
- Jones et al. (2004) Jones, D. H., Saunders, W., Colless, M., et al. 2004, MNRAS, 355, 747
- Kahabka & van den Heuvel (1997) Kahabka, P. & van den Heuvel, E. P. J. 1997, ARA&A, 35, 69
- King (2009) King, A. R. 2009, MNRAS, 393, L41
- Koda et al. (2012) Koda, J., Yagi, M., Boissier, S., et al. 2012, ApJ, 749, 20
- Krautter et al. (1999) Krautter, J., Zickgraf, F.-J., Appenzeller, I., et al. 1999, A&A, 350, 743
- Krumholz & McKee (2008) Krumholz, M. R. & McKee, C. F. 2008, Nature, 451, 1082
- Kudritzki & Puls (2000) Kudritzki, R.-P. & Puls, J. 2000, ARA&A, 38, 613
- Long et al. (2012) Long, K. S., Blair, W. P., Godfrey, L. E. H., et al. 2012, ApJ, 756, 18
- Maccacaro et al. (1988) Maccacaro, T., Gioia, I. M., Wolter, A., Zamorani, G., & Stocke, J. T. 1988, ApJ, 326, 680
- Maddox et al. (2006) Maddox, L. A., Cowan, J. J., Kilgard, R. E., et al. 2006, AJ, 132, 310
- Makishima et al. (1986) Makishima, K., Maejima, Y., Mitsuda, K., et al. 1986, ApJ, 308, 635
- Meurer et al. (2009) Meurer, G. R., Wong, O. I., Kim, J. H., et al. 2009, ApJ, 695, 765
- Miller & Colbert (2004) Miller, M. C. & Colbert, E. J. M. 2004, International Journal of Modern Physics D, 13, 1
- Mineo et al. (2012) Mineo, S., Gilfanov, M., & Sunyaev, R. 2012, MNRAS, 419, 2095
- Misanovic et al. (2006) Misanovic, Z., Pietsch, W., Haberl, F., et al. 2006, A&A, 448, 1247
- Monet et al. (2003) Monet, D. G., Levine, S. E., Canzian, B., et al. 2003, AJ, 125, 984
- Ohashi et al. (1990) Ohashi, T., Makishima, K., Tsuru, T., et al. 1990, ApJ, 365, 180
- Okada et al. (1997) Okada, K., Mitsuda, K., & Dotani, T. 1997, PASJ, 49, 653
- Owen & Warwick (2009) Owen, R. A. & Warwick, R. S. 2009, MNRAS, 394, 1741
- Peacock (1983) Peacock, J. A. 1983, MNRAS, 202, 615
- Pietsch et al. (2004) Pietsch, W., Misanovic, Z., Haberl, F., et al. 2004, A&A, 426, 11
- Poutanen et al. (2007) Poutanen, J., Lipunova, G., Fabrika, S., Butkevich, A. G., & Abolmasov, P. 2007, MNRAS, 377, 1187
- Primini et al. (1993) Primini, F. A., Forman, W., & Jones, C. 1993, ApJ, 410, 615
- Puls et al. (2008) Puls, J., Vink, J. S., & Najarro, F. 2008, A&A Rev., 16, 209
- Raymond & Smith (1977) Raymond, J. C. & Smith, B. W. 1977, ApJS, 35, 419
- Roberts et al. (2008) Roberts, T. P., Levan, A. J., & Goad, M. R. 2008, MNRAS, 387, 73
- Roberts et al. (2005) Roberts, T. P., Warwick, R. S., Ward, M. J., Goad, M. R., & Jenkins, L. P. 2005, MNRAS, 357, 1363
- Robrade & Schmitt (2010) Robrade, J. & Schmitt, J. H. M. M. 2010, A&A, 516, A38
- Rogstad et al. (1974) Rogstad, D. H., Lockhart, I. A., & Wright, M. C. H. 1974, ApJ, 193, 309
- Rosner et al. (1985) Rosner, R., Golub, L., & Vaiana, G. S. 1985, ARA&A, 23, 413
- Rumstay & Kaufman (1983) Rumstay, K. S. & Kaufman, M. 1983, ApJ, 274, 611
- Saha et al. (2006) Saha, A., Thim, F., Tammann, G. A., Reindl, B., & Sandage, A. 2006, ApJS, 165, 108
- Sako et al. (1999) Sako, M., Liedahl, D. A., Kahn, S. M., & Paerels, F. 1999, ApJ, 525, 921
- Schild (1977) Schild, R. E. 1977, AJ, 82, 337
- Schröder et al. (2008) Schröder, C., Hubrig, S., & Schmitt, J. H. M. M. 2008, A&A, 484, 479
- Schröder & Schmitt (2007) Schröder, C. & Schmitt, J. H. M. M. 2007, A&A, 475, 677
- Scoville et al. (2007) Scoville, N., Aussel, H., Brusa, M., et al. 2007, ApJS, 172, 1
- Skrutskie et al. (2006) Skrutskie, M. F., Cutri, R. M., Stiening, R., et al. 2006, AJ, 131, 1163
- Smith et al. (2001) Smith, R. K., Brickhouse, N. S., Liedahl, D. A., & Raymond, J. C. 2001, ApJ, 556, L91
- Soria et al. (2012) Soria, R., Kuntz, K. D., Winkler, P. F., et al. 2012, ArXiv e-prints
- Soria et al. (2010) Soria, R., Long, K. S., Bianchi, L., et al. 2010, The Astronomer’s Telegram, 3092, 1
- Soria & Wu (2002) Soria, R. & Wu, K. 2002, A&A, 384, 99
- Soria & Wu (2003) Soria, R. & Wu, K. 2003, A&A, 410, 53
- Stobbart et al. (2006) Stobbart, A.-M., Roberts, T. P., & Wilms, J. 2006, MNRAS, 368, 397
- Tauris & van den Heuvel (2006) Tauris, T. M. & van den Heuvel, E. P. J. 2006, Formation and evolution of compact stellar X-ray sources, ed. Lewin, W. H. G. and van der Klis, M., 623–665
- Thilker et al. (2005) Thilker, D. A., Bianchi, L., Boissier, S., et al. 2005, ApJ, 619, L79
- Thim et al. (2003) Thim, F., Tammann, G. A., Saha, A., et al. 2003, ApJ, 590, 256
- Tilanus & Allen (1993) Tilanus, R. P. J. & Allen, R. J. 1993, A&A, 274, 707
- Treves et al. (1988) Treves, A., Maraschi, L., & Abramowicz, M. 1988, PASP, 100, 427
- Trinchieri et al. (1985) Trinchieri, G., Fabbiano, G., & Palumbo, G. G. C. 1985, ApJ, 290, 96
- Tully (1988) Tully, R. B. 1988, Nearby galaxies catalog
- Turner et al. (1991) Turner, T. J., Weaver, K. A., Mushotzky, R. F., Holt, S. S., & Madejski, G. M. 1991, ApJ, 381, 85
- Vaiana et al. (1981) Vaiana, G. S., Cassinelli, J. P., Fabbiano, G., et al. 1981, ApJ, 245, 163
- van den Heuvel et al. (1992) van den Heuvel, E. P. J., Bhattacharya, D., Nomoto, K., & Rappaport, S. A. 1992, A&A, 262, 97
- van Paradijs (1998) van Paradijs, J. 1998, in NATO ASIC Proc. 515: The Many Faces of Neutron Stars., ed. R. Buccheri, J. van Paradijs, & A. Alpar, 279
- Vaughan et al. (1994) Vaughan, B. A., van der Klis, M., Wood, K. S., et al. 1994, ApJ, 435, 362
- Vignali et al. (1999) Vignali, C., Comastri, A., Cappi, M., et al. 1999, ApJ, 516, 582
- Walter & Fink (1993) Walter, R. & Fink, H. H. 1993, A&A, 274, 105
- White & Carpenter (1978) White, N. E. & Carpenter, G. F. 1978, MNRAS, 183, 11P
- White & Marshall (1984) White, N. E. & Marshall, F. E. 1984, ApJ, 281, 354
- White et al. (1995) White, N. E., Nagase, F., & Parmar, A. N. 1995, X-ray Binaries, 1
- Wofford et al. (2011) Wofford, A., Leitherer, C., & Chandar, R. 2011, ApJ, 727, 100
Appendix A Classification and identification of the XMM-Newton sources
A.1 Foreground stars
Sources No. 21, 143, 182, and 174
Using the criteria in Sect. 5.1, we classified sources No. 21, 143, 182, and 174 as foreground stars according to their optical and infrared properties (Figs. 4, 6), and their optical-to-X-ray ratios as a function of the hardness ratios (Fig. 5). Although the hardness ratio criterion of source No. 174 is not fulfilled, we classified this source as a foreground star because of the large uncertainty of the hardness ratio (see Fig. 5).
Source No. 24
has optical and infrared counterparts and , but violates the hardness ratio criterion (see Fig. 5). The optical counterpart is bright (), and the and colours are consistent with those of foreground stars (Figs. 4 and 6), thus this source most likely belongs to the Milky Way. It has been detected in observations 1 and 2 in all three EPIC cameras. In all cases, source No. 24 shows hard HR2 (Fig. 5, left panel), inconsistent with the expected X-ray spectra of foreground stars. The properties of the optical companion and the hard X-ray spectra may indicate a cataclysmic-variable nature for this source. This class of sources can show short- and long-term time variability, therefore we produced the X-ray lightcurve in the energy range keV to give more evidence for this identification. However, the resulting X-ray lightcurve (with a bin-time of 2000 s) shows neither short- nor long-term variability.
A.2 Sources that are not foreground stars
Sources No. 12, 137, 164, and 189
coincide with ROSAT sources H2, H31, H34 and H36. They were classified by Immler et al. (1999) as foreground stars based on positional coincidences with optical sources of the APM Northern Sky Catalogue (Irwin et al. 1994). We found possible optical counterparts in the USNO-B1 catalogue for source No. 164 (USNOB1 ) and source No. 12 (USNOB1 ). However, their X-ray-to-optical flux ratios (equation 2) are and respectively ( of both sources was calculated using visual magnitude), hence the foreground star classification for these sources is ruled out. The refined positions of sources Nos. 137 and 189 obtained with XMM-Newton, allowed us to exclude their association with the optical counterparts proposed by Immler et al. (1999). Source No. 189 can be associated with a new optical counterpart, USNOB1 , which is orders of magnitude fainter than the previous one (USNOB1 ). However, the new X-ray-to-optical flux ratio is ( was calculated using visual magnitude), too high for a foreground star (see Sect. A.3). Hardness ratios of sources No. 164 and 137 are consistent with a powerlaw or disk-blackbody spectrum. Therefore, the spectra of these sources are too hard to be classified as foreground stars.
A.3 Background objects
We found radio counterparts of the sources No. 20, 37, and 189 and classified them as AGN candidates for the first time.
Source No. 20
is located outside the ellipse (; Tully 1988) at from the centre of the galaxy. It coincides with the radio source NVSS J133618301459. We detected this source with XMM-Newton in observations 2 and 3 in the outer disc of M 83. Source No. 20 shows a significant long-term variability (Table 3), and the hardness ratios are roughly consistent with a spectrum described by an APEC model with a temperature of keV (; ). Therefore, source No. 20 can be classified as an AGN candidate (with a soft spectral component) or an SNR candidate. The distance of this source from the nuclear region of M 83 of kpc rather indicates that source No. 20 does not belong to the galaxy, therefore it is more likely an AGN than an SNR candidate.
Sources No. 37 and 189
coincide with the radio sources NVSS J133630301651 and NVSS J133805295748, respectively. Source No. 189 was previously classified as a foreground star by Immler et al. (1999) (see Sect. A.2). We detected these sources with XMM-Newton in observation 3. Their hardness ratios are consistent with a spectrum described with a powerlaw or disc-blackbody model (No. 37: ; ; No. 189: ; ). Therefore, they can be classified as AGN candidates.
A.4 X-ray binaries
Source No. 81
coincides with the Chandra source [SW03] 33, classified as an accreting X-ray pulsar, with a hard spectrum () and a spin period of 174.9 s.
We observed source No. 81 in all XMM-Newton observations. The hardness ratios are consistent with an absorbed powerlaw spectrum, and this source shows a significant long-term X-ray variability (, , Table 3). We applied a Fourier transform periodicity search and a Z analysis (section 4.1), which did not reveal any significant periodicity. We calculated the upper-limit on the pulsed fraction (defined as the semi-amplitude of the sinusoidal modulation divided by the mean count rate) using the procedure described by Vaughan et al. (1994). The upper limit on the pulsed fraction obtained from the combined PN and MOS events of observation 1 is 16% at the 99% confidence level. This upper limit is marginally compatible with the pulsed fraction of % of source [SW03] 33.
Source No. 120
corresponds to the X-ray source [SW03] 113. Using the spectral properties and the 201.5 s periodicity detected with Chandra, SW03 classified source [SW03] 113 as an XRB in a soft state.
We observed source No. 120 with XMM-Newton in observations 1 and 3. The hardness ratios of this source are consistent with an absorbed powerlaw spectrum with cm-2 and . Similarly to source No. 81, a Fourier transform periodicity search and a analysis did not reveal any significant periodicity. At the 99% confidence level, the upper limit on the pulsed-fraction of source No. 120 derived from the MOS events is 49%. This upper limit is compatible with the % pulsed fraction of [SW03] 113.
A.5 Supernova remnant candidates
Source No. 79
The position of this source corresponds to the position of the ROSAT source H15 (Immler et al. 1999) and the Chandra source [SW03] 27. The Chandra spectrum shows emission lines, suggesting the possibility of emission from optically thin thermal plasma, and has been fitted by SW03 with an absorbed powerlaw with and cm-2. SW03 classified this source as a young SNR candidate. Another possible explanation for the hard powerlaw spectrum with superposition of emission lines of [SW03] 27 is that the source is an XRB surrounded by a photoionised nebula (SW03). However, XRBs showing these spectral properties usually have a higher absorbing column density than that of [SW03] 27 (see e.g. Sako et al. 1999).
The XMM-Newton hardness ratios of source No. 79 below 2 keV are consistent with an APEC model with temperature keV, while at higher energies the hardness ratios are consistent with a powerlaw with photon index . The spectral shape of source No. 79 derived from XMM-Newton hardness-ratio diagrams agrees with the X-ray spectrum of [SW03] 27 presented by SW03 (see Figure 6 in SW03) and can be interpreted as an SNR exhibiting both a thin-thermal emission (below keV) and an additional hard component, which dominates at energies above keV. Also, source No. 79 does not show any significant long-term variability (see Table 3).
A.6 Super-soft source candidates
Source No. 91
coincides with Einstein source 3 (Trinchieri et al. 1985) and Chandra source [SW03] 55 classified by Di Stefano & Kong (2003) as an SSS candidate (source M83-50 in Di Stefano & Kong 2003). Di Stefano & Kong (2003) fitted the X-ray spectrum of M83-50 with an absorbed blackbody with a temperature of eV, a column density of cm-2, and a luminosity of erg s-1 ( keV, Mpc).
We detected source No. 91 in observation 1, where the hardness ratios are consistent with a blackbody spectrum (with column density in the range cm-2) and marginally compatible with an APEC spectrum with temperature in the range keV (Fig. 10). Source No. 91 has a keV luminosity of erg s-1 and does not show any significant variability compared to the Chandra observation.
A.7 Ultra-luminous X-ray sources
| obs. 2 | obs. 3 | ||
| model | powerlaw + diskbb | bbody + diskbb | powerlaw |
| ( cm-2) | |||
| or (keV) | |||
| norm. | |||
| (keV) | |||
| norm. | |||
| (d.o.f.) | 0.946 (184) | 0.994 (184) | 0.918 (62) |
| ( keV, erg cm-2 s-1) | |||
| ( Mpc, erg s-1) | |||
Two ULXs have been discovered in M 83: H2 (Trinchieri et al. 1985), and a transient ULX discovered with Chandra on 23 December 2010 with a luminosity of erg s-1 ( keV) by Soria et al. (2010), and classified as an accretion-powered black hole with mass M⊙ (Soria et al. 2012). This ULX has not been detected in the XMM-Newton data. Soria et al. (2012) measured an upper limit to the X-ray luminosity of erg s-1 ( keV) from the three XMM-Newton observations.
Source No. 133
We observed the ULX as source No. 133 in all XMM-Newton observations. Ehle et al. (1998) and Immler et al. (1999) found a faint extended optical source within the error circle of the ROSAT source position. Roberts et al. (2008) used HST images in three Advanced Camera for Survey (ACS) filters to find the counterparts to six ULXs in different galaxies. For the ULX in M 83, they compared the optical position with the X-ray position from a Chandra High Resolution Camera for Imaging (HRC-I) observation. They detected a counterpart to the ULX with magnitudes , . They also noticed that the ULX is located at from the centre of a background galaxy, and although the latter is outside the error circle, Roberts et al. (2008) did not completely rule out a possible association between the ULX and the background galaxy.
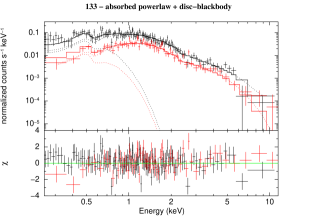
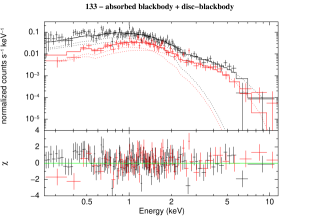
Stobbart et al. (2006) reported the XMM-Newton spectral analysis of source No. 133 during observation 1. They found that the X-ray spectrum is well fitted with a cool disc-blackbody ( keV) plus a powerlaw (), or with a cool blackbody ( keV) plus a warm disc-blackbody ( keV). The first spectral model is the standard IMBH model, where the low disc temperature is due to a black hole with mass of M⊙, while the origin of the powerlaw component is still not clear (see Roberts et al. 2005). Instead, the spectral parameters obtained with the second spectral model suggest that No. 133 is a stellar-mass black hole accreting close to the Eddington limit. In this model, the cool blackbody component represents the optically thick wind from the stellar-mass black-hole accreting at or above the Eddington limit, while the high temperature of the disc follows the standard trend shown by the Galactic stellar-mass black-hole binaries.
We analysed all XMM-Newton observations of the ULX No. 133 and fitted the PN, MOS1 and MOS2 spectra simultaneously with a model assuming an IMBH (phabs*[diskbb + powerlaw] in XSPEC), and a model assuming a stellar-mass BH (phabs*[bbody + diskbb]). We used two absorption components: the Galactic absorption column density ( cm-2) and the absorption within M 83 plus the intrinsic column density of the ULX. In all fits we obtained a good fit with both spectral models with the resulting spectral parameters in agreement with those obtained by Stobbart et al. (2006) from observation 1. However, the spectral parameters in observation 3 are only poorly constrained due to the poor statistics (only MOS1 and MOS2 data were available for this observation). Therefore, we fitted the spectrum of observation 3 with a single component model and found that an absorbed powerlaw can adequately fit the data (Fig. 11, Table 7).
A.8 Hard sources
A.8.1 New classifications
| Source | Parameters | Analysed data | ||||||
| norm. | (d.o.f.) | obs. | instrument | |||||
| ( cm-2) | (erg cm-2 s-1) | (erg s-1) | ||||||
| 16 | 1 | PN,MOS1,MOS2 | ||||||
| 61 | 1 | PN,MOS1,MOS2 | ||||||
| 103 | 1 | PN,MOS2 | ||||||
| 126 | 2 | PN,MOS1,MOS2 | ||||||
| 153 | 1 | PN,MOS1,MOS2 | ||||||
Source No. 16
coincides with the ROSAT source H3 discovered by Immler et al. (1999). This source is located outside the optical disc of M 83, and its position overlaps with the outer disc of M 83 observed by GALEX (e.g. Thilker et al. 2005).
We detected source No. 16 in all XMM-Newton observations, but only in observation 1 was it bright enough to allow spectral analysis. The spectrum can be well fitted with an absorbed powerlaw with , compatible with that of an XRB or an AGN (see Table 8). Source No. 16 shows a significant long-term variability () with a variability factor of (Table 3). It also shows a significant variability within observation 1, with a variability factor of and significance .
Source No. 61
is in the field of view of XMM-Newton during observation 1, where it shows an X-ray luminosity of erg s-1 (see Table 8). It has not been previously detected in X-ray, optical, radio, infrared, or UV. The X-ray spectrum is well fitted with an absorbed powerlaw with or a disc-blackbody model with temperature keV (Table 8). Source No. 61 shows a significant long-term variability () with a variability factor of (Table 3).
Source No. 103
is located at a distance of from a radio source (6 in Cowan et al. 1994, 36 in Maddox et al. 2006), and at from the Chandra source [SW03] 84, which shows hardness ratios compatible with a powerlaw or a disc-blackbody spectrum.
We detected source No. 103 only in the XMM-Newton observation 2, with a flux of erg cm-2 s-1 ( keV). The X-ray spectrum is well fitted with an absorbed powerlaw with (Table 8). We did not detect source No. 103 in observations 1 and 3, thus we calculated the flux upper-limits and we found a significant () long-term variability, with a variability factor of (Table 3, Fig. 2).
Source No. 126
coincides with X-ray source 30 (Ehle et al. 1998) discovered with ROSAT. Source No. 126 also cross-correlates with the optical counterpart USNO-B1 , but the ratio does not match the criteria previously specified to classify foreground stars. Source No. 126 is located outside the optical disc of M 83, and its position overlaps with an extended arm of the galaxy.
Source No. 153
is detected in all XMM-Newton observations, and has not been previously detected in X-rays, optical, radio, infrared, or UV bands. It is located in the extended arms observed by GALEX, away from the nuclear region of M 83.
The spectra extracted from each observation can be well fitted with an absorbed powerlaw with , suggesting an XRB nature for this source (see Table 8).
A.8.2 Identifications
| Source | Parameters | Analysed data | ||||||
| norm. | (d.o.f.) | obs. | instrument | |||||
| ( cm-2) | (erg cm-2 s-1) | (erg s-1) | ||||||
| 97 | 1 | PN,MOS2 | ||||||
| 106 | 1 | PN,MOS1,MOS2 | ||||||
| 107 | 1 | PN,MOS1,MOS2 | ||||||
| 108 | 1 | PN,MOS1 | ||||||
| 114 | 1 | PN,MOS1,MOS2 | ||||||
| 129 | 1 | PN,MOS1 | ||||||
Source No. 60
correlates with the Chandra source [SW03] 5 SW03 suggested that this source is an XRB candidate.
We observed source No. 60 in all XMM-Newton observations. The source shows a significant long-term variability (, , Table 3) with respect to the Chandra observation. X-ray colours of No. 60 are consistent with a powerlaw or disc-blackbody spectrum, in agreement with the spectral analysis of SW03.
Source No. 80
correlates with the Chandra source [SW03] 31. From the spectral properties, SW03 suggested that [SW03] 31 is an XRB candidate.
We observed source No. 80 with XMM-Newton in observation 1. The hardness ratios are consistent with a powerlaw or disc-blackbody spectrum with column density of cm-2
Source No. 92
coincides with the Chandra source [SW03] 60. SW03 suggested that No. 92 is a XRB candidate because of its hard spectrum ().
We observed source No. 92 with XMM-Newton in observation 1. The hardness ratios are consistent with a spectrum described by an absorbed powerlaw model with . Source No. 92 also shows a high long-term variability by a factor of , with a variability significance of (see Table 3).
Source No. 97
coincides with the Chandra source [SW03] 72 and with a ROSAT source (source 7 in Ehle et al. 1998 and source H20 in Immler et al. 1999).
We observed source No. 97 in all XMM-Newton observations. The spectra extracted from each observation can be well fitted with an absorbed powerlaw or a disc-blackbody model (Table 9), with spectral parameters in agreement with the spectral analysis of SW03. Source No. 97 shows a significant long-term variability between XMM-Newton and Chandra observations (, ; Table 3). Within observation 1 we found a variability of with a significance of .
Source No. 99
coincides with the Chandra source [SW03] 73, and it is associated with the radio source MCK 34 (Maddox et al. 2006). located in a HII region (RK 137, Rumstay & Kaufman 1983). From a spectral study, SW03 proposed that [SW03] 73 is more likely an XRB than a young SNR.
We observed source No. 99 with XMM-Newton in observations 2 and 3. The source shows a significant variability (), with a variability factor of (Table 3). and the hardness ratios are consistent with an absorbed powerlaw or disk-blackbody spectrum.
Source No. 106
corresponds to the X-ray source H25 observed by Immler et al. (1999) in a ROSAT observation and the Chandra source [SW03] 85.
We observed source No. 106 in all the observations. During observation 1 the source was bright enough to allow spectral analysis. The spectrum can be well fitted with an absorbed powerlaw (see Table 9), with spectral parameters in agreement with those previously obtained by SW03.
Source No. 107
was detected by Ehle et al. (1998) (source 9) and Immler et al. (1999) (source H26) in ROSAT (PSPC and HRI) observations. Immler et al. (1999) found that H26 coincides with a compact radio source (source 8 in Cowan et al. 1994), and with a giant HII region (Rumstay & Kaufman 1983). Hence, they classified this source as an SNR candidate. Moreover, also the observation of H and H emission anti-coincident with HI emission (Tilanus & Allen 1993) supports the SNR hypothesis. Source No. 107 was also observed in 2000 April 29 by Chandra (source [SW03] 86). From a spectral analysis, SW03 proposed that No. 110 is more likely an XRB (BH candidate) than an SNR.
We detected source No. 107 in all XMM-Newton observations with a luminosity of erg s-1. In observations 1 and 3 the source was bright enough to allow spectral analysis. The spectra can be well fitted with an absorbed powerlaw or a disc-blackbody (see Table 9). The obtained spectral parameters are consistent with those previously found by SW03 with Chandra. Source No. 107 shows a significant long-term variability between XMM-Newton observations (, ).
Source No. 108
was first detected in X-rays by Trinchieri et al. (1985) (source 4) with the Einstein satellite and by Ehle et al. (1998) (source 8) and Immler et al. (1999) (source H27) with ROSAT. It also coincides with the Chandra source [SW03] 88.
We observed source No. 108 in all XMM-Newton observations. During observation 1 source No. 108 was in the centre of the field of view, providing enough statistic to allow spectral analysis. We extracted the PN and MOS1 spectra (the position of source No. 108 was in a gap of MOS2) and we found that an absorbed powerlaw or an absorbed disc-blackbody provide acceptable fits (Table 9), with spectral parameters consistents with those obtained by SW03. Source No. 108 shows a significant long-term X-ray variability (, Table 3), and during observation 1 we found a variability of , with a significance of .
Source No. 114
coincides with the Chandra source [SW03] 104.
We observed source No. 114 in all XMM-Newton observations. During observation 1 source No. 114 was in the centre of the field of view, providing enough statistics to allow a spectral analysis. The spectrum is well fitted with an absorbed powerlaw with spectral parameters consistent with those found by SW03 with Chandra (see Table 9). Source No. 114 also shows a significant long-term variability (, ).
Source No. 116
coincides with [SW03] 105. Di Stefano & Kong (2003) observed [SW03] 105 with Chandra (source M83-88 in Di Stefano & Kong 2003) and classified it as an SSS candidate. Blair & Long (2004) compared the list of Chandra sources of SW03 with a list of optical SNR candidates and associated [SW03] 105 with the optical SNR candidate BL53.
We observed source No. 116 with XMM-Newton in observation 1, where it shows a significant X-ray variability (, , Table 3) compared to the Chandra observation, and the X-ray hardness ratios are consistent with a hard spectrum. These properties indicate that source No. 116 is most likely an XRB. We overlaid the error circles of source No. 116, [SW03] 105, and BL53 on the emission line images H and SII obtained from the public Wide Field Camera 3 (WFC3) observation of 2009-08-20 (Fig. 12). H and SII images are used in extragalactic searches of SNRs because their optical spectra show high [SII]:H ratios compared to the spectra of normal HII regions (see e.g. Blair & Long 2004). Fig. 12 shows that the shell of the optical SNR is located only in the error circles of BL53 and [SW03] 105, indicating that source No. 116 and [SW03] 105 cannot be the same source.
Therefore, source No. 116 is more likely a transient source not associated with BL53.
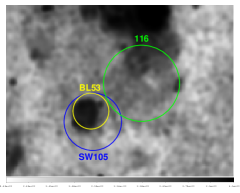
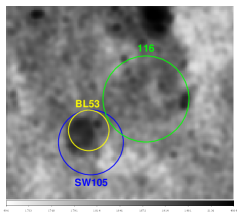
Source No. 129
coincides with the Chandra source [SW03] 121 and with a ROSAT source (source 12 in the catalogue of Ehle et al. 1998, source H29 in the catalogue of Immler et al. 1999).
We observed source No. 129 during observation 1, where it was in the XMM-Newton field of view. The spectrum is well fitted with an absorbed powerlaw with spectral parameters consistent with those found by SW03 with Chandra (see Table 9). We did not detect source No. 129 in observations 2 and 3, thus we calculated the flux upper limits and we found a significant () long-term variability with a variability factor of (Table 3).
Appendix B X-ray source catalogue of the XMM-Newton EPIC M 83 observation
| No. | RA(2000) | DEC(2000) | pos. err. | rate (obs1) | rate (obs2) | rate (obs3) | likelihood | HR1 | HR2 | HR3 | HR4 | ||
|---|---|---|---|---|---|---|---|---|---|---|---|---|---|
| (obs1) | (obs2) | (obs3) | |||||||||||
| 1 | 13 35 48.83 | -29 56 39.5 | |||||||||||
| 2 | 13 35 49.82 | -30 00 38.4 | |||||||||||
| 3 | 13 35 52.30 | -30 02 59.8 | |||||||||||
| 4 | 13 35 55.46 | -30 13 23.3 | |||||||||||
| 5 | 13 35 59.23 | -29 59 05.5 | |||||||||||
| 6 | 13 36 03.03 | -30 03 21.3 | |||||||||||
| 7 | 13 36 04.66 | -30 08 30.8 | |||||||||||
| 8 | 13 36 05.29 | -29 52 52.8 | |||||||||||
| 9 | 13 36 05.95 | -29 52 00.8 | |||||||||||
| 10 | 13 36 06.77 | -30 06 51.7 | |||||||||||
| 11 | 13 36 10.66 | -29 54 03.1 | |||||||||||
| 12 | 13 36 11.72 | -29 43 36.6 | |||||||||||
| 13 | 13 36 12.43 | -30 04 24.1 | |||||||||||
| 14 | 13 36 12.71 | -29 58 37.8 | |||||||||||
| 15 | 13 36 13.25 | -29 59 40.4 | |||||||||||
| 16 | 13 36 13.88 | -29 56 13.4 | |||||||||||
| 17 | 13 36 15.42 | -29 57 58.2 | |||||||||||
| 18 | 13 36 17.09 | -30 13 55.4 | |||||||||||
| 19 | 13 36 18.13 | -29 40 13.0 | |||||||||||
| 20 | 13 36 18.21 | -30 15 00.5 | |||||||||||
| 21 | 13 36 18.73 | -30 01 38.1 | |||||||||||
| 22 | 13 36 18.96 | -30 06 12.6 | |||||||||||
| 23 | 13 36 19.84 | -30 05 18.3 | |||||||||||
| 24 | 13 36 19.94 | -29 51 08.4 | |||||||||||
| 25 | 13 36 19.96 | -29 41 11.6 | |||||||||||
| 26 | 13 36 24.05 | -30 14 56.6 | |||||||||||
| 27 | 13 36 24.17 | -29 54 00.6 | |||||||||||
| 28 | 13 36 26.53 | -30 06 31.8 | |||||||||||
| 29 | 13 36 26.62 | -29 53 09.4 | |||||||||||
| 30 | 13 36 26.64 | -29 55 35.6 | |||||||||||
| 31 | 13 36 28.13 | -29 42 27.9 | |||||||||||
| 32 | 13 36 28.58 | -29 57 16.3 | |||||||||||
| 33 | 13 36 28.94 | -29 55 39.4 | |||||||||||
| 34 | 13 36 28.95 | -29 51 22.9 | |||||||||||
| 35 | 13 36 29.63 | -29 42 47.3 | |||||||||||
| 36 | 13 36 30.28 | -29 41 56.9 | |||||||||||
| 37 | 13 36 30.53 | -30 16 57.0 | |||||||||||
| 38 | 13 36 30.80 | -29 45 51.7 | |||||||||||
| 39 | 13 36 31.10 | -29 49 24.9 | |||||||||||
| 40 | 13 36 31.64 | -29 57 11.4 | |||||||||||
| 41 | 13 36 33.45 | -30 00 18.2 | |||||||||||
| 42 | 13 36 33.77 | -29 45 22.5 | |||||||||||
| 43 | 13 36 34.92 | -30 09 01.2 | |||||||||||
| 44 | 13 36 35.07 | -30 11 07.4 | |||||||||||
| 45 | 13 36 35.82 | -29 41 17.0 | |||||||||||
| 46 | 13 36 35.83 | -29 51 20.2 | |||||||||||
| 47 | 13 36 36.02 | -30 03 37.7 | |||||||||||
| 48 | 13 36 36.76 | -29 50 18.1 | |||||||||||
| 49 | 13 36 38.46 | -29 55 51.5 | |||||||||||
| 50 | 13 36 38.95 | -29 47 43.3 | |||||||||||
| 51 | 13 36 39.18 | -30 04 07.8 | |||||||||||
| 52 | 13 36 39.42 | -30 10 08.6 | |||||||||||
| 53 | 13 36 40.14 | -29 59 52.6 | |||||||||||
| 54 | 13 36 40.52 | -30 05 47.0 | |||||||||||
| 55 | 13 36 40.73 | -29 51 09.1 | |||||||||||
| 56 | 13 36 41.41 | -30 13 26.8 | |||||||||||
| 57 | 13 36 41.79 | -30 11 17.4 | |||||||||||
| 58 | 13 36 42.24 | -30 03 31.4 | |||||||||||
| 59 | 13 36 42.49 | -30 09 34.5 | |||||||||||
| 60 | 13 36 43.44 | -29 51 06.5 | |||||||||||
| 61 | 13 36 44.16 | -29 48 41.8 | |||||||||||
| 62 | 13 36 45.26 | -30 00 38.0 | |||||||||||
| 63 | 13 36 45.34 | -30 14 41.4 | |||||||||||
| 64 | 13 36 45.56 | -30 03 27.5 | |||||||||||
| 65 | 13 36 45.78 | -29 59 13.0 | |||||||||||
| 66 | 13 36 45.94 | -30 00 00.2 | |||||||||||
| 67 | 13 36 47.76 | -30 02 44.4 | |||||||||||
| 68 | 13 36 47.79 | -29 46 47.2 | |||||||||||
| 69 | 13 36 49.07 | -29 52 58.7 | |||||||||||
| 70 | 13 36 50.59 | -30 14 35.1 | |||||||||||
| 71 | 13 36 51.15 | -29 41 54.7 | |||||||||||
| 72 | 13 36 51.39 | -30 18 01.7 | |||||||||||
| 73 | 13 36 51.59 | -29 53 34.5 | |||||||||||
| 74 | 13 36 52.38 | -29 51 43.6 | |||||||||||
| 75 | 13 36 53.43 | -30 08 40.3 | |||||||||||
| 76 | 13 36 53.53 | -29 55 59.1 | |||||||||||
| 77 | 13 36 53.78 | -29 48 49.5 | |||||||||||
| 78 | 13 36 54.86 | -30 09 46.7 | |||||||||||
| 79 | 13 36 55.43 | -29 55 09.0 | |||||||||||
| 80 | 13 36 56.56 | -29 49 12.2 | |||||||||||
| 81 | 13 36 57.22 | -29 53 38.3 | |||||||||||
| 82 | 13 36 57.29 | -29 47 28.1 | |||||||||||
| 83 | 13 36 58.26 | -29 51 04.3 | |||||||||||
| 84 | 13 36 58.26 | -29 48 32.8 | |||||||||||
| 85 | 13 36 58.67 | -29 43 35.7 | |||||||||||
| 86 | 13 36 58.84 | -30 05 18.1 | |||||||||||
| 87 | 13 36 59.35 | -29 49 58.4 | |||||||||||
| 88 | 13 36 59.51 | -29 54 13.9 | |||||||||||
| 89 | 13 36 59.68 | -30 00 58.8 | |||||||||||
| 90 | 13 37 00.35 | -29 51 57.8 | |||||||||||
| 91 | 13 37 00.47 | -29 50 52.3 | |||||||||||
| 92 | 13 37 00.51 | -29 53 18.7 | |||||||||||
| 93 | 13 37 00.83 | -29 51 59.9 | |||||||||||
| 94 | 13 37 00.97 | -30 16 43.0 | |||||||||||
| 95 | 13 37 01.12 | -29 52 46.2 | |||||||||||
| 96 | 13 37 01.16 | -30 00 36.2 | |||||||||||
| 97 | 13 37 01.36 | -29 53 25.0 | |||||||||||
| 98 | 13 37 01.49 | -29 47 42.7 | |||||||||||
| 99 | 13 37 01.75 | -29 51 26.4 | |||||||||||
| 100 | 13 37 01.99 | -29 55 17.5 | |||||||||||
| 101 | 13 37 02.10 | -30 12 28.3 | |||||||||||
| 102 | 13 37 02.25 | -29 44 26.8 | |||||||||||
| 103 | 13 37 02.72 | -29 52 25.5 | |||||||||||
| 104 | 13 37 02.79 | -29 57 36.6 | |||||||||||
| 105 | 13 37 03.69 | -30 06 31.0 | |||||||||||
| 106 | 13 37 03.80 | -29 49 29.9 | |||||||||||
| 107 | 13 37 04.21 | -29 54 03.1 | |||||||||||
| 108 | 13 37 04.32 | -29 51 21.0 | |||||||||||
| 109 | 13 37 05.12 | -29 52 26.5 | |||||||||||
| 110 | 13 37 05.49 | -29 57 56.5 | |||||||||||
| 111 | 13 37 06.30 | -29 51 03.2 | |||||||||||
| 112 | 13 37 06.32 | -30 17 24.5 | |||||||||||
| 113 | 13 37 06.45 | -30 13 40.4 | |||||||||||
| 114 | 13 37 06.99 | -29 51 02.1 | |||||||||||
| 115 | 13 37 07.09 | -29 46 49.5 | |||||||||||
| 116 | 13 37 07.23 | -29 51 32.9 | |||||||||||
| 117 | 13 37 08.13 | -30 03 05.0 | |||||||||||
| 118 | 13 37 08.26 | -29 53 36.1 | |||||||||||
| 119 | 13 37 10.65 | -30 11 18.9 | |||||||||||
| 120 | 13 37 12.54 | -29 51 53.2 | |||||||||||
| 121 | 13 37 12.60 | -30 09 01.0 | |||||||||||
| 122 | 13 37 12.66 | -29 43 10.0 | |||||||||||
| 123 | 13 37 12.80 | -30 05 33.0 | |||||||||||
| 124 | 13 37 12.91 | -29 45 08.9 | |||||||||||
| 125 | 13 37 14.65 | -29 54 28.8 | |||||||||||
| 126 | 13 37 15.83 | -30 02 56.3 | |||||||||||
| 127 | 13 37 16.06 | -29 56 55.5 | |||||||||||
| 128 | 13 37 16.22 | -29 41 56.2 | |||||||||||
| 129 | 13 37 16.27 | -29 49 38.3 | |||||||||||
| 130 | 13 37 17.22 | -29 51 53.1 | |||||||||||
| 131 | 13 37 19.23 | -29 57 09.6 | |||||||||||
| 132 | 13 37 19.54 | -30 04 29.2 | |||||||||||
| 133 | 13 37 19.73 | -29 53 48.1 | |||||||||||
| 134 | 13 37 19.98 | -30 09 03.7 | |||||||||||
| 135 | 13 37 22.41 | -29 40 31.3 | |||||||||||
| 136 | 13 37 22.46 | -30 08 23.7 | |||||||||||
| 137 | 13 37 24.66 | -29 58 56.3 | |||||||||||
| 138 | 13 37 25.36 | -30 01 59.9 | |||||||||||
| 139 | 13 37 25.47 | -29 54 33.6 | |||||||||||
| 140 | 13 37 26.20 | -30 00 30.2 | |||||||||||
| 141 | 13 37 26.36 | -29 48 33.0 | |||||||||||
| 142 | 13 37 26.68 | -30 01 47.4 | |||||||||||
| 143 | 13 37 27.24 | -29 55 47.6 | |||||||||||
| 144 | 13 37 27.46 | -30 02 28.3 | |||||||||||
| 145 | 13 37 27.47 | -30 13 56.1 | |||||||||||
| 146 | 13 37 28.34 | -29 54 25.3 | |||||||||||
| 147 | 13 37 28.78 | -29 49 43.1 | |||||||||||
| 148 | 13 37 29.36 | -29 50 27.4 | |||||||||||
| 149 | 13 37 29.48 | -29 50 08.5 | |||||||||||
| 150 | 13 37 29.51 | -30 01 47.6 | |||||||||||
| 151 | 13 37 29.52 | -30 04 16.6 | |||||||||||
| 152 | 13 37 29.91 | -29 48 27.6 | |||||||||||
| 153 | 13 37 30.47 | -29 59 37.5 | |||||||||||
| 154 | 13 37 30.97 | -29 42 34.4 | |||||||||||
| 155 | 13 37 31.17 | -29 51 56.8 | |||||||||||
| 156 | 13 37 31.98 | -30 05 58.8 | |||||||||||
| 157 | 13 37 32.39 | -30 10 19.9 | |||||||||||
| 158 | 13 37 32.94 | -29 51 01.2 | |||||||||||
| 159 | 13 37 33.01 | -30 06 40.6 | |||||||||||
| 160 | 13 37 33.32 | -29 55 15.6 | |||||||||||
| 161 | 13 37 33.35 | -29 57 02.6 | |||||||||||
| 162 | 13 37 33.80 | -29 59 58.8 | |||||||||||
| 163 | 13 37 36.42 | -30 10 52.1 | |||||||||||
| 164 | 13 37 36.72 | -29 48 18.3 | |||||||||||
| 165 | 13 37 39.04 | -30 03 32.5 | |||||||||||
| 166 | 13 37 39.27 | -29 43 21.5 | |||||||||||
| 167 | 13 37 40.17 | -30 03 16.7 | |||||||||||
| 168 | 13 37 40.30 | -29 51 23.9 | |||||||||||
| 169 | 13 37 41.38 | -30 06 04.3 | |||||||||||
| 170 | 13 37 42.47 | -29 51 36.9 | |||||||||||
| 171 | 13 37 42.88 | -30 05 17.3 | |||||||||||
| 172 | 13 37 43.32 | -30 06 01.4 | |||||||||||
| 173 | 13 37 44.45 | -29 53 06.4 | |||||||||||
| 174 | 13 37 44.72 | -30 07 47.3 | |||||||||||
| 175 | 13 37 49.64 | -29 55 40.9 | |||||||||||
| 176 | 13 37 49.97 | -29 52 17.4 | |||||||||||
| 177 | 13 37 50.30 | -29 56 43.3 | |||||||||||
| 178 | 13 37 51.98 | -29 48 27.4 | |||||||||||
| 179 | 13 37 52.98 | -29 44 06.6 | |||||||||||
| 180 | 13 37 55.42 | -29 55 00.6 | |||||||||||
| 181 | 13 37 56.50 | -29 47 26.6 | |||||||||||
| 182 | 13 37 57.58 | -30 01 39.9 | |||||||||||
| 183 | 13 37 58.34 | -29 55 31.3 | |||||||||||
| 184 | 13 37 58.94 | -30 09 10.5 | |||||||||||
| 185 | 13 38 00.44 | -30 02 58.3 | |||||||||||
| 186 | 13 38 01.14 | -30 05 38.1 | |||||||||||
| 187 | 13 38 02.67 | -29 56 45.4 | |||||||||||
| 188 | 13 38 02.87 | -29 49 40.5 | |||||||||||
| 189 | 13 38 05.57 | -29 57 45.4 | |||||||||||
| No. | USNO B1 | 2MASS | optical | radio | X-ray | class. |
|---|---|---|---|---|---|---|
| 1 | 0600-0299949 (A) | |||||
| 2 | 0599-0299809 (B) | |||||
| 3 | ||||||
| 4 | ||||||
| 5 | ||||||
| 6 | ||||||
| 7 | 0598-0300930 (C) | 13360480-3008319 (C) | QSO 1333-298 (C) | AGN | ||
| 8 | ||||||
| 9 | 13360571-2952048 (C) | |||||
| 10 | 0598-0300943 (C) | 13360646-3006475 (C) | ||||
| 11 | ||||||
| 12 | 0602-0301227 (C) | [I1999] 2 star (B), [E1998] 17 (A) | ||||
| 13 | ||||||
| 14 | [I1999] 4 (C) | |||||
| 15 | 0600-0300086 (C) | |||||
| 16 | 0600-0300087 (C) | [I1999] 3 (B), [E1998] 18 (B) | hard source | |||
| 17 | 0600-0300099 (C) | [I1999] 5 gal. (B), [E1998] 19 (B) | AGN | |||
| 18 | ||||||
| 19 | ||||||
| 20 | NVSS J133618-301459 (B) | (AGN) | ||||
| 21 | 0599-0299962 (C) | 13361884-3001381 (C) | [E1998] 20 (B) | fg. star | ||
| 22 | ||||||
| 23 | ||||||
| 24 | 0601-0298625 (C) | 13362007-2951058 (C) | (CV) | |||
| 25 | ||||||
| 26 | 0597-0300800 (C) | |||||
| 27 | ||||||
| 28 | 0598-0301061 (A) | |||||
| 29 | 0601-0298670 (A) | |||||
| 30 | [E1998] 22 (B) | |||||
| 31 | 0602-0301338 (C) | 13362821-2942266 (B) | GAL | |||
| 32 | ||||||
| 33 | 0600-0300208 (C) | [E1998] 22 (B) | ||||
| 34 | 0601-0298683 (C) | 13362901-2951232 (B) | ||||
| 35 | ||||||
| 36 | ||||||
| 37 | NVSS J133630-301651 (C) | (AGN) | ||||
| 38 | ||||||
| 39 | ||||||
| 40 | ||||||
| 41 | ||||||
| 42 | ||||||
| 43 | ||||||
| 44 | ||||||
| 45 | ||||||
| 46 | ||||||
| 47 | ||||||
| 48 | ||||||
| 49 | ||||||
| 50 | [I1999] 7 (C), [E1998] 24 (B) | |||||
| 51 | ||||||
| 52 | ||||||
| 53 | 0600-0300263 (B) | [E1998] 25 (B) | ||||
| 54 | 0599-0300108 (B) | |||||
| 55 | [SW2003] 2 (C) | |||||
| 56 | ||||||
| 57 | ||||||
| 58 | ||||||
| 59 | ||||||
| 60 | [SW2003] 5 xrb cand. (C), [I1999] 8 (C), [E1998] 1 (C) | hard source | ||||
| 61 | hard source | |||||
| 62 | ||||||
| 63 | 0597-0300945 (B) | |||||
| 64 | [E1998] 26 (B) | |||||
| 65 | 0600-0300305 (C) | 13364580-2959124 (C) | 6dFGS gJ133645.8-295913, gal (C) | [I1999] 10 gal. (B), [E1998] 27 (B) | GAL | |
| 66 | ||||||
| 67 | ||||||
| 68 | ||||||
| 69 | [SW2003] 8 snr or xrb cand. (A), [SW2003] 9 (C), [I1999] 12 (B), [E1998] 3 (B) | |||||
| 70 | ||||||
| 71 | ||||||
| 72 | ||||||
| 73 | [SW2003] 14 (A), [I1999] 14 (B) | |||||
| 74 | ||||||
| 75 | 0598-0301228 (C) | |||||
| 76 | [SW2003] 19 (B) | |||||
| 77 | [SW2003] 20 (A), [DK03] 20 (A) | |||||
| 78 | 0598-0301233 (A) | |||||
| 79 | [SW2003] 27 snr cand. (B), [I1999] 15 (B) | (SNR) | ||||
| 80 | [SW2003] 31 xrb cand. (A) | hard source | ||||
| 81 | [SW2003] 33 xrb (C), [I1999] 16 (B) | XRB | ||||
| 82 | [SW2003] 34 (C) | |||||
| 83 | [CRB1994] 3 (B), [MCK2006] 28 (A), radio-gal. | [SW2003] 39 gal. (B) | GAL | |||
| 84 | [SW2003] 40 (B) | |||||
| 85 | 0602-0301563 (C) | [E1998] 28 (B) | ||||
| 86 | ||||||
| 87 | [SW2003] 44 (C), [I1999] 17 (B), [E1998] 5 (B) | |||||
| 88 | [SW2003] 46 (B) | |||||
| 89 | 0599-0300236 (A) | [BRK2009] 7, gal (A) | GAL | |||
| 90 | [I1999] 19 (A), [E1998] 6 (A), [T1985] 1 (A) | |||||
| 91 | [SW2003] 55 (B), [T1985] 3 (A), [DK03] 50 sss cand. (B) | (SSS) | ||||
| 92 | [SW2003] 60 xrb cand. (C) | hard source | ||||
| 93 | [E1998] 6 (A), [T1985] 1 (A) | |||||
| 94 | 0597-0301054 (B) | |||||
| 95 | [SW2003] 65 (A), [I1999] 21 (B) | |||||
| 96 | 0599-0300246 (C) | 13370132-3000361 (C) | ||||
| 97 | [SW2003] 72 xrb cand. (C), [I1999] 20 (A), [E1998] 7 (A) | hard source | ||||
| 98 | [SW2003] 76 (C) | |||||
| 99 | 13370140-2951257 (C) | [MCK2006] 34 (C) | [SW2003] 73 xrb or snr cand. (B) | hard source | ||
| 100 | [SW2003] 78 (A), [I1999] 22 (C) | |||||
| 101 | ||||||
| 102 | 0602-0301590 (B) | |||||
| 103 | [CRB1994] 6 (C), [MCK2006] 36 (C) | [SW2003] 84 (C) | hard source | |||
| 104 | ||||||
| 105 | 0598-0301292 (B) | |||||
| 106 | 13370433-2949306 (C) | [SW2003] 85 xrb cand. (C), [I1999] 25 (B) | hard source | |||
| 107 | [CRB1994] 8 (C), [MCK2006] 38 (C) | [SW2003] 86 snr or xrb cand. (C), [I1999] 26 (B), [E1998] 9 (B) | hard source | |||
| 108 | [SW2003] 88 xrb cand. (C), [I1999] 27 (C), [E1998] 8 (C), [T1985] 4 (A) | hard source | ||||
| 109 | [SW2003] 93 (C) | |||||
| 110 | ||||||
| 111 | ||||||
| 112 | ||||||
| 113 | ||||||
| 114 | [SW2003] 104 xrb cand. (C) | hard source | ||||
| 115 | ||||||
| 116 | [BL2004] 53, snr cand. (C) | [SW2003] 105 (C), [DK03] 88 sss cand. (C) | hard source | |||
| 117 | ||||||
| 118 | 0601-0298889 (C) | 13370870-2953313 (C) | ||||
| 119 | ||||||
| 120 | [SW2003] 113 xrb (B) | XRB | ||||
| 121 | ||||||
| 122 | 0602-0301643 (B) | |||||
| 123 | 0599-0300322 (B) | |||||
| 124 | ||||||
| 125 | [SW2003] 119 (B) | |||||
| 126 | 0599-0300335 (C) | [E1998] 30 (C) | hard source | |||
| 127 | ||||||
| 128 | ||||||
| 129 | [SW2003] 121 xrb cand. (C), [I1999] 29 (B), [E1998] 12 (B) | hard source | ||||
| 130 | [SW2003] 122 (A) | |||||
| 131 | ||||||
| 132 | ||||||
| 133 | [I1999] 30 ULX (C), [E1998] 13 (C), [T1985] 2 (A) | ULX | ||||
| 134 | ||||||
| 135 | 0603-0300266 (A) | |||||
| 136 | ||||||
| 137 | [I1999] 31 star (B), [E1998] 31 (B) | |||||
| 138 | ||||||
| 139 | ||||||
| 140 | ||||||
| 141 | ||||||
| 142 | ||||||
| 143 | 0600-0300561 (A) | 13372725-2955475 (A) | [I1999] 32 star (B) | fg. star | ||
| 144 | 0599-0300410 (A) | 13372747-3002283 (A) | 6dFGS gJ133727.5-300228, gal (A) | GAL | ||
| 145 | 0597-0301232 (A) | |||||
| 146 | ||||||
| 147 | 0601-0298991 (C) | |||||
| 148 | 0601-0298995 (B) | 13372947-2950283 (B) | 6dFGS gJ133729.5-295028, gal (B) | GAL | ||
| 149 | ||||||
| 150 | ||||||
| 151 | ||||||
| 152 | ||||||
| 153 | ||||||
| 154 | [E1998] 32 (A) | |||||
| 155 | [I1999] 33 (B), [E1998] 33 (B) | |||||
| 156 | ||||||
| 157 | ||||||
| 158 | 0601-0299030 (C) | 13373327-2951007 (C) | ESO 444-85, gal (C) | GAL | ||
| 159 | 0598-0301544 (A) | |||||
| 160 | 0600-0300590 (C) | 13373342-2955182 (C) | ||||
| 161 | ||||||
| 162 | ||||||
| 163 | 0598-0301583 (C) | |||||
| 164 | 0601-0299090 (C) | [I1999] 34 (A), [E1998] 34 (A) | ||||
| 165 | [E1998] 35 (B) | |||||
| 166 | 0602-0301832 (C) | [I1999] 35 (B), [E1998] 36 (A) | ||||
| 167 | [E1998] 35 (C) | |||||
| 168 | 0601-0299123 (B) | 13374032-2951233 (A) | ||||
| 169 | ||||||
| 170 | [E1998] 37 (A) | |||||
| 171 | ||||||
| 172 | 0598-0301628 (C) | [E1998] 38 (B) | ||||
| 173 | 0601-0299160 (B) | [E1998] 39 (B) | ||||
| 174 | 0598-0301638 (A) | 13374472-3007463 (A) | fg. star | |||
| 175 | 0600-0300711 (B) | 13374956-2955409 | ||||
| 176 | ||||||
| 177 | 13375055-2956418 (C) | [E1998] 40 (B) | ||||
| 178 | 0601-0299209 (B) | |||||
| 179 | 13375276-2944038 (C) | |||||
| 180 | ||||||
| 181 | ||||||
| 182 | 0599-0300696 (B) | 13375770-3001406 (B) | fg. star | |||
| 183 | ||||||
| 184 | 0598-0301763 (A) | |||||
| 185 | ||||||
| 186 | ||||||
| 187 | ||||||
| 188 | ||||||
| 189 | 0600-0300832 (A) | NVSS J133805-295748 (C) | [I1999] 36 star (B), [E1998] 42 (B) | (AGN) |