Electronic address: ]okamura@kobe-u.ac.jp
Pressure suppression of spin-density-wave gap in the optical conductivity of SrFe2As2
Abstract
Optical reflectance of a pressure-induced superconductor SrFe2As2 has been measured under external pressure to 6 GPa and at temperatures to 8 K. Optical conductivity has been derived from the measured . At ambient pressure, in the antiferromagnetic state below =198 K, a pronounced feature develops in due to the opening of a spin density wave (SDW) gap, as already reported in the literature. With increasing pressure, the SDW gap feature in is progressively suppressed. At 4 GPa, where the sample is superconducting, the SDW gap feature in is strongly reduced than that at ambient pressure, but is still clearly observed. At 6 GPa, the SDW gap is completely suppressed. The pressure evolutions of the SDW gap magnitude and the spectral weight closely follow the pressure evolution of .
pacs:
Regarding the superconductivity (SC) exhibited by Fe-based compounds,review the pressure-induced SC exhibited by the stoichiometric “122” compounds Fe2As2 (=Ba, Ca, Sr, Eu) have attracted much interest.canfield1 ; canfield2 ; alireza ; kotegawa1 ; isikawa ; canfield3 ; kotegawa2 ; matubayasi ; igawa ; yamazaki ; duncan ; kurita They exhibit SC with external pressure only, although many other families of Fe based superconductors require some form of chemical doping or deviation from stoichiometry to exhibit SC.review In particular, SrFe2As2 (Sr122) and BaFe2As2 (Ba122) show pressure-induced SC at relatively high temperatures of =34 Kkotegawa1 ; canfield3 ; kotegawa2 ; matubayasi and 28 K,alireza ; canfield3 ; matubayasi ; yamazaki , respectively. Interestingly, the 122 compounds also show SC with chemical doping, as shown by (Sr, K)Fe2As2,chu Sr(Fe,Co)2As2,Fe-dope and SrFe2(As, P)2.As-dope
At ambient pressure, the stoichiometric 122 compounds are antiferromagnetic (AFM), poor metals. For Sr122 and Ba122, the AFM transition temperature () is 198 K and 136 K, respectively. At , the resistivity [] shows a kink and rapid decrease with cooling below . With increasing pressure, is gradually lowered, and the kink in becomes broadened. Above a critical pressure, the SC appears. Similar suppression of AFM and emergence of SC have also been observed with chemical doping.chu ; Fe-dope ; As-dope In this regard, both methods have provided a lot of insight, but one advantage of the pressure technique compared with chemical doping is that the former does not cause disorder in the crystal lattice.
However, there is an additional complication regarding the pressure-induced SC in the 122 compounds. Namely, it has been shown that the pressure evolutions of the AFM and SC states strongly depend on the hydrostaticity.kotegawa2 ; yamazaki ; duncan Here, hydrostaticity refers to how isotropic the pressure acting on the sample is. The hydrostaticity in a high pressure experiment depends on the types of pressure cell and pressure transmitting medium used. Figure 1 summarizes the results of high pressure studies on Sr122.alireza ; kotegawa1 ; canfield3 ; kotegawa2 ; matubayasi
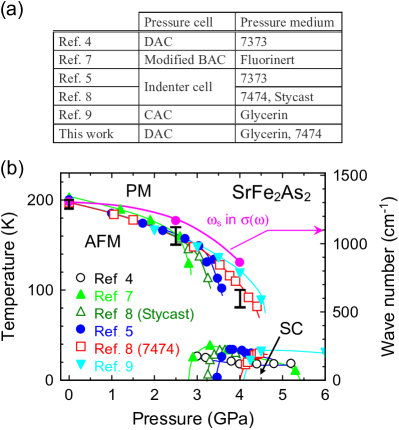
As discussed in detail later, these results show that the AFM state is suppressed and SC appears at lower pressure when the applied pressure is less hydrostatic (more uniaxial). This may indicate that a uniaxial stress promotes SC in the 122 compounds.
To probe the microscopic electronic structures of the 122 compounds, various spectroscopic techniques have been used.review In particular, the optical conductivity [] technique has provided much information.wang2 ; dressel2010a ; hancock ; leonetta ; wang1 ; dressel2010b ; dressel2010c ; degiorgi ; nakajima ; basov2 ; basov3 As for the stoichiometric 122 compounds, a clear depletion of below 1200 cm-1 was observed below .wang2 ; dressel2010a ; hancock This was attributed to a gapping of the Fermi surface at certain portions of the Brillouin Zone, which was caused by spin-density-wave (SDW) formation. At low temperatures, a narrow Drude peak due to free carriers was observed even after the SDW gap was formed in . With chemical doping into the 122 compounds, the SDW gap in was progressively suppressed, and in the SC phase, a SC gap was clearly observed in .wang1 ; dressel2010b ; dressel2010c ; degiorgi ; nakajima ; basov2 ; basov3
In this work, of Sr122 has been measured under external pressure () to 6 GPa and at temperature () to 8 K in order to study the pressure evolution of microscopic electronic structures. The advantage of technique is fully taken here since a pressure study is technically difficult for other spectroscopic techniques such as photoemission and tunneling. With increasing pressure, the SDW gap in , observed at ambient pressure as mentioned above, was progressively suppressed. At 4 GPa, where SC is expected to appear, the SDW gap was much less pronounced than that at ambient pressure, but was still clearly observed. At 6 GPa, where the SC was expected to be most stable, the SDW gap was no longer observed.
Single crystals of Sr122 were grown by a self-flux method. Their quality was similar to that of the samples used in Refs. 5 and 8, which showed SC with =34 K at high pressures. A cleaved surface was obtained shortly before each measurement, which contained the plane perpendicular to the axis, and used without mechanical polishing. No polarization resolved measurement was made in this work. The reflectance of a sample without external pressure [] was measured in vacuum with a near-normal incidence over a wide frequency (photon energy) range between 80 and 240000 cm-1 (10 meV and 30 eV).mybook Below 20000 cm-1, a gold film deposited in situ onto the sample itself was used as the reference of reflectance.timusk was derived from the measured using the Kramres-Kronig (KK) analysis.dressel ; wooten The reflectance of a sample at high pressure [] was measured using a diamond anvil cell (DAC). A cleaved surface of the sample was closely attached on the culet face of a diamond anvil. The diameter of the culet face was 800 m, and the sample dimensions were typically 200 200 30 m3. The diamond was of type IIa with very low density of impurities. The sample was sealed in the DAC with glycerin or Daphne Oil 7474 as pressure transmitting medium. The pressure was monitored by the ruby fluorescence method. of the sample was measured relative to a gold film, mounted near the sample in the DAC. To measure under such a restricted condition, synchrotron radiation was used as high-brilliance infrared sourceIRSR-review at the beam line BL43IR of SPring-8.BL43IR More technical details of the high-pressure reflectance measurement have been described elsewhere.airapt Note that was measured at a sample/diamond interface, while was measured at a sample/vacuum interface. Due to the large refractive index of diamond (2.4), therefore, may significantly differ from ,footnote as actually observed for a few compoudns.ybs ; CeRu4Sb12 ; PrRu4P12 Hence a careful analysis is required for the data measured with DAC, as discussed later.
Figure 2 summarizes the reflectance data of Sr122 measured at =0, 2.5, 4, and 6 GPa.
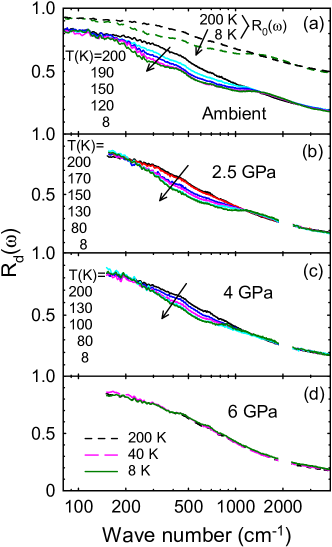
These spectra were derived from measured data using the procedures previously discussed.footnote2 Note that the spectra, expected from the measured ,footnote2 are indicated even for the =0 case [Fig. 2(a)], to enable direct comparison with the high pressure cases [Fig. 2(b)–2(d)]. At =0, in Fig. 2(a), a strong reduction of reflectance below approximately 1200 cm-1 is observed at 200 K, where the transition to AFM state and the formation of SDW state occur. This reduction of reflectance below is due to a formation of SDW gap, and has been analyzed and discussed by published works, including similar results on Ba122. wang2 ; dressel2010a ; hancock With increasing , in Figs. 2(b)-2(d), the reduction of reflectance becomes smaller, and it is absent at =6 GPa. These pressure evolutions indicate a suppression of the SDW gap, as discussed in detail below based on the data. Note that we did not observe significant difference between data obtained with glycerin and Daphne oil 7474 as pressure medium.
Figure 3 shows the spectra obtained from the reflectance data in Fig. 2.
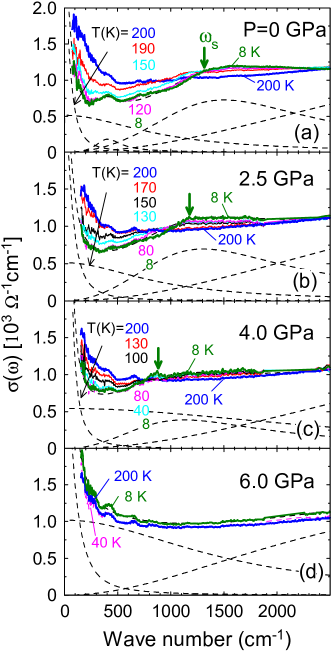
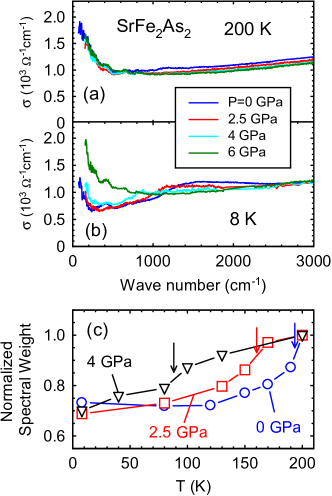
Here, the spectra at =0 in Fig. 3(a) were obtained from using the conventional KK analysis,dressel ; wooten while those at high pressure in Figs. 3(b)-3(d) were obtained from using a modified KK analysis, which took into account the refractive index of diamond as previously discussed in detail.kk At =0 and =200 K, in Fig. 3(a), is almost flat above 500 cm-1, and rises rapidly with decreasing frequency. The rising component is due to the Drude response of free carriers.dressel ; wooten With cooling below =198 K, below 1200 cm-1 is depleted, and with further cooling, develops an gap-like structure. However, even at 8 K, the spectral depletion is incomplete, and seems to contain a flat continuum or background. In addition, the Drude response becomes narrower with cooling, and a shoulder appears near 1300 cm-1 as indicated by the vertical arrow in Fig. 3(a). This shoulder marks the characteristic frequency in below which the spectral depletion occurs. The formation of incomplete gap in below has been observed and discussed for both Sr122 and Ba122 by many authors.wang2 ; dressel2010a ; hancock ; degiorgi ; nakajima Note that, as previously discussed, the Drude response remains even at 8 K. From these results, it has been concluded that a gapping of Fermi surface occurs at certain portions of the Brillouin Zone due to the SDW formation, and that the electronic subsystem responsible for the narrow Drude response is distinct from that for the SDW gap opening.dressel2010a ; nakajima At =2.5 GPa, in Fig. 3(b), the spectral depletion of with cooling is still seen, but a large decrease is observed below 170 K, rather than below 200 K as in the =0 data. This result well corresponds to the decrease of from 198 K at =0 to about 160 K at =2.5 GPa.kotegawa1 ; kotegawa2 The spectral range of depletion marked by the position of the shoulder, which is about 1200 cm-1, is also smaller than that at =0. These trends continue in the 4 GPa data. Namely, the spectral depletion becomes smaller, and occurs over narrower range with a shoulder near 900 cm-1. Along these pressure evolutions, the narrow Drude response mentioned above is surviving at 4 GPa. At 6 GPa, in Fig. 3(d), in contrast, does not show spectral depletion any more, and shows small increase with cooling. spectra at different pressures at =200 K and 8 K are indicated in Fig. 4.
The shift of shoulder and the suppression of the SDW gap with pressure are more clearly seen. The shoulder frequency () is plotted as a function of pressure in the phase diagram of Fig. 1(a). It is seen that the pressure evolution of closely follows that of , i.e., the pressure evolution of SDW gap magnitude also closely follows that of .
According to the previous works on Sr122 (Fig. 1), SC appears at approximately 4 GPa when the pressure is applied by cubic anvil and indenter cells with glycerin and Daphne Oil (DO) 7474 as pressure transmitting media, respectively.kotegawa1 ; kotegawa2 ; matubayasi SC appears at lower pressure, at 3 GPa, when DAC and Bridgman anvil cells are used with Fluorinert and DO 7373, respectively. alireza ; canfield3 Cubic anvil and indenter cells generally produce more hydrostatic pressure than Bridgeman and diamond anvil cells if the same pressure medium is used. In addition, glycerin and DO 7474, which are also used in the present study, produce more hydrostatic pressure than DO 7373 and Fluorinert if the same pressure cell is used. (Hydrostaticity of these pressure transmitting media in DAC have been studied in detail. osakabe ; 7474 ; tateiwa ; klotz1 ; klotz2 ; footnote3 ) Based on these considerations and the results in Fig. 1, it is reasonable to assume that the sample be in the SC state at 4 and 6 GPa in this study, although no resistivity measurement has been made. For chemically doped 122 systems, the formation of a SC gap has been manifested by a strong depletion of below 200 cm-1, and by an increase of reflectance toward unity. wang1 ; degiorgi ; nakajima ; basov3 In the present data of and at 4 and 6 GPa, however, no such features are observed, although the sample should be in SC state as discussed above. The reason why a SC gap is not observed in our high pressure is unclear. A possible reason is the limited spectral range of the present study: the data in this work could be measured only above 150 cm-1 due to the technical limitations associated with DAC. In previous works with chemically doped samples, measurements were made to much lower frequencies, generally down to 50 cm-1 or lower. wang1 ; degiorgi ; nakajima ; basov3
In the previous optical studies of 122 compounds, Drude-Lorentz spectral fittingdressel ; wooten was used to analyze the spectra.wang2 ; dressel2010a ; hancock ; degiorgi ; nakajima Results of similar fitting to our high pressure data at 8 K are indicated by the broken curves in Fig. 3. Note that, in addition to a narrow Drude term for the narrow Drude response in , a broad Drude term is used in the fitting function for the broad continuum in , as previously done. A Lorentz term is used to fit the gap feature including the shoulder, and another Lorentz term for a high frequency background. [For =0 data, a small Lorentz term is also used to fit the small peak near 400 cm-1.] With increasing pressure, the spectral weight (SW) of the Drude terms increase, and that of the Lorentz term for the gap feature decreases. This shows an increase of carrier density in correspondence to the suppression of SDW gap with pressure. These evolutions with pressure are qualitatively similar to those with increasing at =0, in Fig. 3(a), and similar to those with increasing chemical doping.degiorgi ; nakajima In the previous works, the carrier scattering rate () and SW of the narrow Drude term were obtained from the fitting.wang2 ; dressel2010a ; degiorgi ; nakajima was strongly suppressed when the SDW gap was formed, and the effective carrier density was also evaluated from SW. We have attempted similar analysis, but have found large uncertainty in the fitting parameters obtained. This is primarily due to the limited spectral range of our high pressure experiment: The low frequency end of our study, limited by the use of DAC, was 150 cm-1, which was too high for a reliable fitting of the narrow Drude response. [Only the tail of the narrow Drude response is seen in , especially at low .] Hence, it was difficult to accurately evaluate the pressure evolution of and SW of the carriers.
To analyze the evolution of SDW gap with and , we have plotted in Fig. 4(c) the SW of below the shoulder. Here, the average of measured at frequencies between and normalized by at 200 K, where is the shoulder frequency, is plotted as a function of . (The results of fitting were not used here due to the uncertainty discussed above.) The choice of the range is rather arbitrary, and is intended to probe a region in the gap but without a significant overlap with the narrow Drude component. It is seen that the spectral weight in the gap steeply drops with cooling below 170 K at 2.5 GPa, and below 100 K at 4 GPa, respectively. These ranges where the steep decrease of is seen are indicated by the vertical bars in Fig. 1(b). It is clear that they well follow the evolution of with pressure.
In summary, of pressure-induced superconductor Sr122 was obtained under external pressure to 6 GPa using diamond anvil cell. The SDW gap formed in at ambient pressure was progressively suppressed with increasing pressure. The SDW gap was still present at 4 GPa where the sample was expected to be in SC state. At 6 GPa, where the SC was expected to be optimum, the SDW gap was completely suppressed. The pressure evolution of the SDW gap magnitude, implied by a shoulder in , and that of the spectral weight within the SDW gap, closely followed the evolution of . In addition, the spectral evolution of the SDW gap with increasing pressure was qualitatively similar to those with increasing temperature at =0, and also to those with increasing chemical pressure at =0. A SC gap was not observed in our data even at 4 and 6 GPa where the sample should be in the SC state, probably due to a limited spectral range of our high pressure study using DAC.
Acknowledgements.
H. O. acknowledges Prof. H. Kotegawa for useful information about high pressure studies on Sr122. The work at SPring-8 was made under the approval of JASRI (2009A0089 through 2012A0089). Financial support from MEXT (”Heavy Fermion” 21102512-A01 and Scientific Research C 23540409) is acknowledged.References
- (1) G. R. Stewart, Rev. Mod. Phys. 83, 1589 (2011).
- (2) M. S. Torikachvili, S. L. Bud’ko, N. Ni, and P. C. Canfield, Phys. Rev. Lett. 101, 057006 (2008).
- (3) M. S. Torikachvili, S. L. Bud’ko, N. Ni, and P. C. Canfield, Phys. Rev. B 78, 104527 (2008).
- (4) P. L. Alireza, Y. T. C. Ko, J. Gillett, C. M. Petrone, J. M. Cole, G. G. Lonzarich, and S. E. Sebastian, J. Phys.: Condens. Matter 21, 012208 (2008).
- (5) H. Kotegawa, H. Sugawara, and H. Tou, J. Phys. Soc. Jpn. 78, 013709 (2009).
- (6) F. Ishikawa, N. Eguchi, M. Kodama, K. Fujimaki, M. Einaga, A. Ohmura, A. Nakayama, A. Mitsuda, and Y. Yamada, Phys. Rev. B 79, 172506 (2009).
- (7) E. Colombier, S. L. Bud fko, N. Ni, and P. C. Canfield, Phys. Rev. B 79, 224518 (2009).
- (8) H. Kotegawa, T. Kawazoe, H. Sugawara, K. Murata, and H. Tou, J. Phys. Soc. Jpn. 78, 083702 (2009).
- (9) K. Matsubayashi, N. Katayama, K. Ohgushi, A. Yamada, K. Munakata, T. Matsumoto, and Y. Uwatoko, J. Phys. Soc. Jpn. 78, 073706 (2009).
- (10) K. Igawa, H. Okada, H. Takahashi, S. Matsuishi, Y. Kamihara, M. Hirano, H. Hosono, K. Matsubayashi, and Y. Uwatoko: J. Phys. Soc. Jpn. 78, 025001 (2009).
- (11) T. Yamazaki, N. Takeshita, R. Kobayashi, H. Fukazawa, Y. Kohori, K. Kihou, C.-H. Lee, H. Kito, A. Iyo, and H. Eisaki, Phys. Rev. B 81, 224511 (2010).
- (12) W. J. Duncan, O. P. Welzel, C. Harrison, X. F. Wang, X. H. Chen, F. M. Grosche, and P. G. Niklowitz, J. Phys.: Condens. Matter 22, 052201 (2010).
- (13) N. Kurita, M. Kimata, K. Kodama, A. Harada, M. Tomita, H. S. Suzuki, T. Matsumoto, K. Murata, S. Uji, and T. Terashima Phys. Rev. B 83, 100501 (2011).
- (14) K. Sasmal, B. Lv, B. Lorenz, A. M. Guloy, F. Chen, Y.-Y. Xue, and C.-W. Chu, Phys. Rev. Lett. 101, 107007 (2008).
- (15) A. Keithe-Jasper, W. Schnelle, C. Geibel, and H. Rosner, Phys. Rev. Lett. 101, 207004 (2008).
- (16) H. L. Shi, H. X. Yang, H. F. Tian, J. B. Lu, Z. W. Wang, Y. B. Qin, Y. J. Song, and J. Q. Li, arXiv:0909.4600.
- (17) W. Z. Hu, J. Dong, G. Li, Z. Li, P. Zheng, G. F. Chen, J. L. Luo, and N. L. Wang, Phys. Rev. Lett. 101, 257005 (2008).
- (18) D. Wu, N. Barisic, P. Kallina, A. Faridian, B. Gorshunov, N. Drichko, L. J. Li, X. Lin, G. H. Cao, Z. A. Xu, N. L. Wang, and M. Dressel, Phys. Rev. B 81, 100512(R) (2010).
- (19) J. N. Hancock, S. I. Mirzaei, J. Gillett, S. E. Sebastian, J. Teyssier, R. Viennois, E. Giannini, and D. van der Marel, Phys. Rev. B 82, 014523 (2010).
- (20) L. Baldassarre, A. Perucchi, P. Postorino, S. Lupi, C. Marini, L. Masavasi, J. Jiang, J. D. Weiss, E. E. Hellstrom, I. Pallecchi, and P. Dore, Phys. Rev. B 85, 174522 (2012).
- (21) G. Li, W. Z. Hu, J. Dong, Z. Li, P. Zheng, G. F. Chen, J. L. Luo, and N. L. Wang, Phys. Rev. Lett. 101, 107004 (2008).
- (22) N. Barisic, D. Wu, M. Dressel, L. J. Li, G. H. Cao, and Z. A. Xu, Phys. Rev. B 82, 054518 (2011).
- (23) D. Wu, N. Barisic, M. Dressel, G. H. Cao, Z. A. Xu, E. Schachinger, and J. P. Carbotte, Phys. Rev. B 82, 144519 (2010).
- (24) A. Lucarelli, A. Duszaz, F. Pfuner, P. Lerch, J. G. Analytis, J.-H. Chu, I. R. Fisher, and L. Degiorgi, New J. Phys. 12, 073036 (2010).
- (25) M. Nakajima, S. Ishida, K. Kihou, Y Tomioka, T. Ito, Y. Yoshida, C. H. Lee, H. Kito, A. Iyo, H. Eisaki, K. M. Kojima, and S. Uchida, Phys. Rev. B 81, 104528 (2010).
- (26) A. A. Schafgans, S. J. Moon, B. C. Pursley, A. D. LaForge, M. M. Qazilbash, A. S. Sefat, D. Mandrus, K Haule, G. Kotliar, and D. N. Basov, Phys. Rev. Let. 108, 147002 (2012).
- (27) S. J. Monn, A. A. Schafgans, S. Kasahara, T. Shibauchi, T. Terashima, Y. Matsuda, M. A. Tanatar, R. Prozorov, A. Thaler, P. C. Canfield, A. S. Sefat, D. Mandrus, and D. N. Basov, Phys. Rev. Lett. 109, 027006 (2012).
- (28) H. Okamura: Chapter 4 in Optical Techniques for Solid State Materials Characterization, ed. R. P. Prasankumar and A. J. Taylor (CRC Press, Boca Raton, 2012).
- (29) M. Dressel and G. Grüner, Electrodynamics of Solids (Cambridge University Press, Cambridge, 2002).
- (30) F. Wooten, Optical Properties of Solids (Academic Press, New York, 1972).
- (31) C. C. Homes, M. Reedyk, D. A. Crandles, and T. Timusk, Appl. Opt. 32, 2976 (1993).
- (32) H. Okamura, M. Matsunami, R. Kitamura, S. Ishida, T. Nanba, J. Phys. Conf. Ser. 215, 012051 (2010).
- (33) S. Kimura and H. Okamura, J. Phys. Soc. Jpn. 82, 021004 (2013).
- (34) Y. Ikemoto, T. Moriwaki, T. Hirono, S. Kimura, K. Shinoda, M. Matsunami, N. Nagai, T. Nanba, K. Kobayashi, and H. Kimura, Infrared Phys. Tech. 45, 369 (2004).
-
(35)
The normal-incidence reflectance of a sample surface
is given by the Fresnel’s formula as
Here, is the complex refractive index of the sample, and is the refractive index of the diamond (2.4) in the case of , and 1.0 for . Therefore, may significantly differ from .(1) - (36) H. Okamura, N. Ohta, A. Takigawa, I. Matsutori, K. Shoji, M. Miyata, M. Matsunami, T. Nanba, H. Sugawara, H. Sato, C. Sekine, I. Shirotani, T. Moriwaki, Y. Ikemoto, Z. Liu, and G. L. Carr, Phys. Rev. B 85, 205115 (2012).
- (37) H. Okamura, R. Kitamura, M. Matsunami, H. Sugawara, H. Harima, H. Sato, T. Moriwaki, Y. Ikemoto, and T. Nanba: J. Phys. Soc. Jpn. 80, 084718 (2011).
- (38) M. Matsunami, H. Okamura, A. Ochiai, and T. Nanba, Phys. Rev. Lett. 103, 237202 (2009).
- (39) spectra were first measured without using a DAC, as already discussed in the text. The usual KK analysisdressel ; wooten was applied to the to obtain . was then used to derive the reflectance that was expected in a DAC [], using Eq. (1) with =2.4 of diamond, as previously discussed.ybs ; airapt ; CeRu4Sb12 ; PrRu4P12 The data shown in Fig. 2(a) are the results of this analysis. At high pressures, the relative changes of with varying and were measured with DAC. Then they were multiplied by the expected at =0 discussed above to obtain at high pressure. This procedure was taken since it was technically difficult to accurately determine the absolute value of in a DAC, in particular for the far-IR range, due to strong diffraction of the long wavelength radiation off the small sample. It has been explicitly demonstrated that the relative changes of in DAC can be correctly measured with this procedure.CeRu4Sb12
- (40) H. Okamura: J. Phys.: Conf. Ser. 359, 012013 (2012).
- (41) K. Murata, K. Yokogawa, H. Yoshino, S. Klotz, P. Munsch, A. Irizawa, M. Nishiyama, K. Iizuka, T. Nanba, T. Okada, Y. Shiraga, and S. Aoyama, Rev. Sci. Instr. 79, 085101 (2008).
- (42) T. Osakabe and K. Kakurai, Jpn. J. Appl. Phys. 47, 6544 (2008).
- (43) N. Tateiwa and Y. Haga, Rev. Sci. Instr. 80, 123901 (2009).
- (44) S. Klotz, J.-C. Chervin, P. Munsch, and G. Le Marchand, J. Phys. D: Appl. Phys. 42, 075413 (2009).
- (45) S. Klotz, K. Takemura, Th. Strassle, and Th. Hansen, J. Phys. Condens. Matter 24, 325103 (2012).
- (46) The solidification pressures at room temperature have been reported as follows. Fluorinert : 1 GPa7474 ; Daphne 7373: 2.2 GPaosakabe ; 7474 ; Daphne 7474: 3.7 GPa7474 ; klotz1 ; and glycerin: 5.5 GPa.klotz2