Luminosity dependent star-formation history of S0 galaxies: evidence from GALEX-SDSS-2MASS-WISE colours
Abstract
We combine UV/Optical/near-IR/mid-IR data on a sample of 240 S0 galaxies to examine various star formation related processes in them. We split the sample into bright and faint S0 galaxies based on their band luminosity. Comparing the FUV-NUV versus NUV-K color-color diagram with a Simple Stellar Population (SSP) model shows that ellipticals and bright S0 galaxies are dominated by a stellar population of age years while faint S0 galaxies may contain stars as young as years, providing evidence for relatively recent star formation activity. The strength of the 4000 Å break is also systematically higher in brighter S0 galaxies, again indicating the presence of an old stellar population. Their mid-IR colours indicate that bright S0 colours are like those of ellipticals while faint S0 colours are more like spirals. All these observations are consistent with a scenario in which low-luminosity S0 galaxies likely formed by the stripping of gas from the discs of late-type spiral galaxies, which in turn formed their pseudo bulges through secular evolution processes, possibly involving multiple episodes of star formation. On the other hand, more luminous S0 galaxies likely formed the bulk of their stars at early epochs, similar to the star formation in elliptical galaxies, and are characterised by an old coeval stellar population and classical bulges.
keywords:
galaxies: elliptical and lenticular - fundamental parameters galaxies: photometry - structure - bulges galaxies: formation - evolution galaxies: star formation1 Introduction
Lenticular (S0) galaxies are characterised by the presence of a central bulge and disk and the absence of spiral arms. Multiwavelength observations over the decades have not led to any broad consensus about their origins, properties, and evolution, although they are often thought to have formed most of their stars early in the history of the universe and to have evolved relatively passively since then. Cosmological simulations of galaxy formation appear to show a ”two-phase” character for galaxy formation with a rapid early phase at during which “in situ” stars are formed within the galaxy from infalling cold gas followed by an extended phase since during which “ex situ” stars are primarily accreted (Oser et al. 2010). In the widely accepted paradigm of hierarchical galaxy formation, major mergers play an important role in the galaxy formation process for early type galaxies. In this picture, current theory predicts that stellar evolution returns substantial quantities of gas to the interstellar medium; most is ejected from the galaxy, but significant amounts of cool gas might be retained (Abadi, Moore & Bower 1999; Kormendy & Bender 2012; Eliche-Moral et al. 2012). This simple picture is complicated by the need to properly account for the distribution of merger orbital parameters, gas fractions, and the full efficiency of merger-induced effects as a function of mass ratio of the merging galaxies (Hopkins et al. 2010).
The remaining gas may form new stars at different epochs over the lifetime of the galaxy. Such star formation is however, too weak to affect the optical light of the galaxy, which continues to be dominated by the old stellar population and appears ”red and dead” in optical imaging and spectroscopy (e.g., Bothun & Gregg (1990); Schweizer & Seitzer (1992); Munn (1992)).
S0 galaxies occupy an important position in Hubble’s tuning fork diagram (Hubble 1936), where they are placed in between ellipticals and spirals implying that S0 galaxies have properties that are intermediate between these two classes. Although the view that they are relatively gas-poor still survives (e.g., Tomita et al. (2000)), it has become clear that in general ∼75% - 80% of them have some dust and gas (e.g., Knapp, Turner & Cunniffe (1985); Wardle & Knapp (1986); van Dokkum & Franx (1995); Ferrari et al. (1999); Welch & Sage (2003)). These differences in neutral and molecular gas content and gas supply are an essential factor to explain the differences in galaxy formation and evolution scenarios between different morphologies of galaxies. HI, FIR and CO observation of S0 galaxies have demonstrated that many of these objects have an active and cold interstellar medium though usually in much smaller quantities compared to spirals. Balick, Faber & Gallagher (1976) first reported the discovery of atomic hydrogen in S0 galaxies. van Driel & van Woerden (1991) observed distributions and kinematics of HI gas in gas-rich S0 galaxies to study various scenarios for the origin and evolution of gas in such galaxies. CO emission from molecular gas was detected in 78% of field S0 galaxies in the survey by Welch & Sage (2003).
Nearly 60% of nearby S0 galaxies were detected by IRAS in its 60 m and 100 m (Knapp et al. 1989) bands indicating the presence of dust. Gas, dust and small amount of star formation were detected by Temi, Brighenti & Mathews (2009) in their sample of early-type galaxies observed with the Spitzer telescope. The Atlas3D SAURON spectroscopy of early-type galaxies highlights these results in detail and has detected optical emission lines and recent star formation in 75% of its sample galaxies which included many S0 galaxies (Sarzi et al. 2006; Davis et al. 2011; Young et al. 2011).
These multiwavelength studies of S0 galaxies over the last three decades or so, indicate that there is great variation in the gross observable properties of these objects. An important question then is whether these observed variations in gas and dust content and star formation history are consistent with all S0 galaxies having had a similar formation history.
Barway et al. (2007, 2009) have presented evidence to support the view that the formation history of S0 galaxies follows two very different routes. Which route is taken seems to depend primarily upon the luminosity of the galaxy, although the environment also plays a role. According to this view, luminous S0 galaxies are likely to have formed their stars at early epochs through major mergers or rapid collapse followed by rapid star formation, similar to the formation of elliptical galaxies (Aguerri et al. 2005). The bulges of such S0 galaxies are more likely classical bulges (Kormendy & Kennicutt 2004) sharing most of their stellar and dynamical properties with low and medium mass elliptical galaxies; the most massive ellipticals seem to be different (Gadotti 2009). These luminous S0 galaxies with classical bulges were studied by Hubble, and placed in close proximity to ellipticals on his tuning fork diagram. On the other hand, low-luminosity S0 galaxies likely formed by the quenching of star formation due to stripping of gas from the bulges and discs of late-type spiral galaxies through galaxy interactions or by motion in a dense environment (Aragón-Salamanca, Bedregal & Merrifield 2006; Bedregal, Aragón-Salamanca, & Merrifield 2006; Barr et al. 2007). This fading scenario may not be applicable for the most massive (and therefore luminous) S0 galaxies harbouring populous globular clusters (Sánchez-Janssen & Aguerri 2012).
The progenitor spiral galaxies of faint S0s, in turn, likely formed their pseudo bulges through secular evolution processes induced by bars. The bar formation could be episodic; bars induce gas flows and vigourous star formation (Ellison et al. 2011; Coelho & Gadotti 2011). The bars may subsequently be disrupted due to the combined effects of central mass concentration and gravity torques with the mass of the central concentration being an important parameter (Bournaud, Combes & Semelin 2005; Athanassoula, Lambert, & Dehnen 2005). The disruption of the bar would tend to stop the gas inflow to the central regions thereby quenching star formation. The process may then repeat over galaxy dynamical timescales (Carollo 1999; Gadotti 2011; Scannapieco & Athanassoula 2012). Recent work has shown that this simple picture may not be correct; the role of gas feedback on the weaking of the stellar bar is likely to be complicated (Berentzen et al. 2007). The simulations presented in Athanassoula, Machado & Rodionov (2013) do not see the destruction or dissolution of a bar, which in turn strongly argues for long-lived bars, at least in isolated galaxies. Long lived bars are also found in the cosmological simulations presented in Kraljic, Bournaud & Martig (2012).
If this picture is broadly correct (given the uncertainties in bar longevity), there must be signatures of the formation mechanism imprinted in the various observable parameters of the galaxy. Indeed, such imprints have been seen in the light profile (as correlated bulge disc-sizes) by Barway et al. (2007, 2009) and the presence of kinematic structures, such as a stellar bar (Barway, Wadadekar & Kembhavi 2011; van den Bergh 2012; Skibba et al. 2012). There should also be imprints on stellar kinematics (as traced by 3D spectroscopy) and in stellar populations (as traced by broadband colours). The expectation is that luminous S0 galaxies should have colours characteristic of old stellar bulges (like those found in most elliptical galaxies), while faint S0 galaxies should have colours indicating multiple episodes of star formation which would result in a mixed stellar population with a variety of ages, like those found in spiral galaxies.
In this paper, we combine near and far UV data from the Galaxy Evolution Explorer (GALEX), optical data from the Sloan Digital Sky Survey (SDSS), near-IR data from the 2Micron All Sky Survey (2MASS), and mid-infrared data from the Wide-Field Infrared Survey Explorer (WISE; Wright et al. (2010)) to investigate differences in stellar populations of a sample of nearby S0 galaxies as a function of luminosity. We present evidence for a significantly enhanced probability of recent star formation in faint S0 galaxies. Throughout this paper, we use the standard concordance cosmology with , and

2 The sample and data
For this work, we made use of the sample of S0 galaxies constructed by Barway et al. (2011) which has 371 galaxies obtained by cross-matching the Uppsala General Catalog of Galaxies (UGC; Nilson (1973)) with the Sloan Digital Sky Survey (SDSS) Data Release 7 (DR7; Abazajian et al. (2009)) and 2MASS (Skrutskie et al. 2006). These galaxies all have a total apparent blue magnitude brighter than . This sample, while not complete, is a fair representation of the S0 galaxy population in the local Universe and has a statistically meaningful number of galaxies spanning a large range of luminosities from the field as well as group/cluster environments (Barway et al. 2011). For all 371 galaxies, we have data from SDSS in five bands () and from 2MASS in the , and bands.
For the present work, we cross-matched these 371 galaxies with the UV imaging data available in the GALEX GR6 data release. We found a total of 243 galaxies for which data exist in the FUV and NUV bands of GALEX. One galaxy, UGC 9094, had a very noisy image in both FUV and NUV GALEX bands and has been excluded from further analysis. One should note that the data in the GALEX archive are sourced from a number of GALEX surveys which includes AIS (all sky, shallow), MIS (medium), DIS (deep), and NGS (nearby galaxies). The sensitivity limits are therefore not uniform. However, for the big, bright, nearby galaxies of our sample, the GALEX imaging has reasonable signal to noise even in the shallow survey.
To verify the morphological classification of S0 galaxies in this sample as listed in the UGC catalog, we performed a visual classification of these 242 galaxies with good GALEX data. We used two methods to identify galaxy morphology 1. We examined the color JPEG images as provided on the SDSS website and 2. We produced and examined higher signal-to-noise ratio () images made using the prescription of Lisker, Grebel & Binggeli (2006), by co-adding the SDSS , and bands.
The visual inspection of galaxy images was performed by two of the authors independently. A final classification was made after discussing any inconsistent cases. We found five galaxies (UGC 1157, UGC 4596, UGC 4963, UGC 5638, UGC 8204) with easy to detect spiral arms misclassified as S0s. We exclude these from our sample. A few other galaxies with very weak asymmetries in structure, indicative of spirals structure that has faded have been left in, in the sample. Also, identifying ellipticals that are misclassified as S0s in the UGC catalog is a difficult exercise. Only a handful of objects (5 galaxies) fall into this category, but the consistency in classification with the two methods is weak. We have therefore chosen to leave these in, as well. This is not surprising because S0s with a very weak, face on disk appear very much like ellipticals even with the higher dynamic range of modern digital surveys. We note that since the number of misclassified objects is small relative to the size of the sample, a somewhat different methodology for identifying contaminants would not affect any result presented in this paper.
We use this sample of 237 galaxies for the analysis presented in this paper. The FUV and NUV magnitudes measured by the GALEX pipeline are quoted in the AB magnitude system of Oke & Gunn (1983). We corrected the apparent UV magnitudes for Galactic extinction using the Schlegel, Finkbeiner & Davis (1998) reddening maps and assuming the extinction law of Cardelli, Clayton & Mathis (1989) and Wyder et al. (2005). SDSS model magnitudes are already in the AB system and we correct them for Galactic extinction in the same manner as the UV magnitudes. In order to have all magnitudes consistently in the AB system, we also converted the 2MASS K band Vega magnitudes to the AB system by adding 1.84 (as suggested by Muñoz-Mateos et al. (2009) and Cohen, Wheaton & Megeath (2003)). The converted K band magnitudes are also corrected for Galactic extinction. All 237 galaxies have mid-IR flux measurements in the 3.4, 4.6 and 12 micron bands of the WISE satellite (Wright et al. 2010) which recently carried out an all sky survey at four mid-IR bands. Unless mentioned otherwise, all flux measurements are from calibrated source catalogs from the four wavebands that we use. No -corrections are required as our galaxies are at a very low median redshift of . In Figure 1, we show the distribution of total absolute magnitude in the band for galaxies in the sample. We divide the sample into less luminous and more luminous groups, using as a boundary for absolute magnitudes in the AB system. For convenience, we use the words bright and faint to designate the more and less luminous groups respectively. The division line between the two groups corresponds to in the Vega system that we have used in previous papers. With this luminosity division, 103 galaxies (43%) are in the bright category while the remaining 134 (57%) are in the faint category. Our results do not critically depend on small (∼0.5 mag) shifts in the dividing luminosity. Since there is a uniform shift for all galaxies while moving from the Vega system to the AB system, there is no change in the fraction of S0 galaxies in the bright and faint groups after the shift is applied.


3 Analysis
3.1 GALEX-SDSS-2MASS colour-colour diagrams
Regions of recent star formation in galaxies whose light is dominated by hot, young stars are well traced by imaging from the Galaxy Evolution Explorer (GALEX) (Gil de Paz et al. 2007) telescope. On the other hand, the near-infrared 2MASS images trace the old stellar population of galaxies which is dominated by low mass stars. The near-UV (NUV) detector on GALEX is extremely sensitive to the presence of a young stellar population. With it, we can detect small mass fractions of 1-3% of young stars formed within the last billion years (Schawinski et al. 2006). By plotting a GALEX-2MASS colour-colour diagram with NUV as the common filter, we can easily separate galaxies with predominantly young and old stars. The presence of variable amounts of dust in galaxies can complicate this simple picture somewhat, but the broad trends are still apparent. In Figure 2, we combine GALEX and 2MASS flux measurements of the galaxies in our sample to plot a colour-colour diagram (FUV-NUV vs. NUV- KT) with open circles representing the bright S0 galaxies and dots representing the faint S0 galaxies. The curve shows the age evolution of a Simple Stellar Population (SSP) with solar metallicity and a Salpeter IMF constructed using the Charlot & Bruzual (2007) models. These models are an improved but unpublished version of the Bruzual & Charlot (2003) models. Numbers along the curve indicate the logarithm of the age of the SSP. Colours on both axes effectively separate old ( Gyr) stellar populations from younger ones. The bulk of the bright S0 galaxies occupy the region of colour-colour space corresponding to an SSP of age years. This indicates that the main stellar population in such galaxies consists of old, low mass stars. Such a population is known to predominate in elliptical galaxies. These stars may all have formed within the same galaxy or dry mergers of multiple elliptical/S0 progenitors may be involved. This indicates a close correspondence between bright S0 galaxies and elliptical galaxies. Such a result is not at all surprising; many studies of stellar populations in S0 galaxies over the decades have found a predominantly old stellar population. Indeed, Hubble’s original placement of S0 galaxies in the tuning fork diagram was motivated by the close similarities in optical colours between S0 galaxies and ellipticals.
One bright S0 galaxy lies away from the main group towards the lower left side of the figure. This is UGC 1597, which is a Seyfert galaxy with an active core and a disturbed appearance in the SDSS image, indicative of a recent merger. These peculiarities explain its extreme blue colours. The SDSS fiber spectrum of the center of this galaxy shows very strong emission indicating that this is a strongly star forming galaxy. We exclude this galaxy from the sample that is analysed in subsequent subsections.
Faint S0 galaxies show a much higher scatter in the figure. More than half the galaxies lie well away from the region populated by bright S0 galaxies. Their wide scatter in the colour-colour diagram, and relative to the SSP curve, indicates that their stellar populations cannot be explained by a single episode of instantaneous star formation; their histories must be more complex. We would like to note here that not all faint S0 galaxies have such complex star formation histories; a significant fraction lies in the region occupied by bright S0 galaxies and is reasonably well characterised by a single stellar population of advanced age.
UV-Optical colours can also be used to identify galaxies with a young stellar population. Schawinski et al. (2006) use a colour criterion to identify galaxies with recent star formation (RSF). In Figure 3, we plot the colour versus the colour for bright and faint S0 galaxies. Above the line, 83 out of 135 galaxies are bright (61%); this drops to 17 out of 102 (17%) in the RSF region below the line. In Figure 4, we show the distribution of colour for the bright and faint galaxies. Again, there is a clear indication that faint S0 galaxies are more likely to have recent star formation than bright ones.

Such ”star-forming” S0 galaxies have been noted before in the literature although the dependence on luminosity was not discovered. Donas et al. (2007) studied a sample of elliptical and S0 galaxies drawn from the RC3 catalog. In a colour-colour diagram of (taken from the RC3) versus , they noted a larger scatter for S0 galaxies; they speculated that this reflected the presence of low-level star formation. In Figure 5, we show the colour-colour diagram for the Donas et al. (2007) sample. This figure is similar to Figure. 2 of their paper. We have, in addition, used 2MASS K-band flux measurements of all the galaxies in their sample to separate faint and bright S0 galaxies. The fainter S0 galaxies show a higher scatter than the brighter ones, which are well mixed with the elliptical population. The two anomalous elliptical galaxies with blue colours are starforming ellipticals, which have also been noted as such in Donas et al. (2007).
3.1.1 Environmental dependence
It would be interesting to see if this difference in star forming properties between bright and faint S0 galaxies also depends on whether the galaxy is in the field or in a denser environment. We note that drawing conclusions based on the current environment of the galaxy may be misleading because the galaxy may have formed in the field and then subsequently fallen into a cluster. On the other hand, a galaxy that appears to be a field galaxy today may have undergone a merger or interaction in its past that may have altered both its star formation history and its morphology. Keeping this caveat in mind that the present environment of a galaxy may be very different from the environment(s) it has encountered over its lifetime, we use environmental information for the galaxies in our sample to explore differences in recent star formation properties as a function of luminosity and environment. To investigate this issue, we divide the sample into field and group/cluster environments (for convenience we use the designation “cluster” for both group and cluster environments) using data from Tago et al. (2010), which uses the friends-of-friends group search method to search for groups in the SDSS-DR7. Out of 237 S0 galaxies we have used for this study, 64 galaxies are in the field and 173 are members of a cluster, which reflects the fact that the majority of galaxies located in dense environments are S0s (Dressler 1980) and the majority of S0s are found in dense environments (Barway et al. 2011).
In Figure 6, we show the distribution of colour for cluster and field S0 galaxies in our sample. Comparing the two distributions, it seems that the association between faint and RSF galaxies and bright and non RSF galaxies is stronger for field S0s than for S0s in clusters. For galaxies bluer than in the field, all except one galaxy are faint. For galaxies without RSF (those to the right of the line), the bright S0 galaxies outnumber the faint ones in both field and cluster environments, but the dominance is much larger for field galaxies.
We note that the number of field galaxies in our sample is considerably smaller than those in clusters. This implies that the distribution as plotted is statistically less robust for field galaxies and the differences with environment may be less significant than they appear. It seems that the role of environment in influencing RSF in S0 galaxies is an important secondary effect with the luminosity as the main differentiator between the two classes. However, we caution that in attempting to study the differences between bright and faint S0 galaxies as a function of environment, we presuppose that the two classes form a homology whose properties can be meaningfully compared. We have attempted to show through this work and previous works that bright and faint S0 galaxies are sufficiently different that a straightforward ”apples to apples” comparison between them is not possible.

3.2 index
Another criterion that can be used to separate old and young stellar populations in galaxies whose spectra are available, is the strength of the 4000Å break which arises because of an accumulation of absorption lines of mainly ionised metals in the atmospheres of old, low mass stars and by a deficiency of hot, blue stars in galaxies. The strength of the break is quantified by the index with higher values of the index seen in old elliptical galaxies without recent/ongoing star formation. There are several definitions of this index in the literature; for this work we use a recent definition provided by Balogh et al. (1999). Of the 371 galaxies in the original sample with SDSS imaging, 180 galaxies have SDSS spectra available in the DR9 release (Ahn et al. 2012). This rather small number of galaxies with available spectra is due to the fact that the galaxy sample in SDSS is limited at the bright end by the fiber magnitude limits, to avoid saturation and excessive cross-talk in the spectrographs. For the galaxies with spectra, recent data releases (we used the most recent DR9) of the SDSS provide measurements of the index in the galspecindx table. Figure 7 shows the distribution of the index for bright and faint S0 galaxies. Bright S0 galaxies are sharply peaked at around indicating that most of these objects are similar in their stellar populations to elliptical galaxies. Faint S0 galaxies, on the other hand, show a much wider distribution indicating that they have a mixed population of old and young stars.

3.3 WISE mid-IR colour-colour diagram
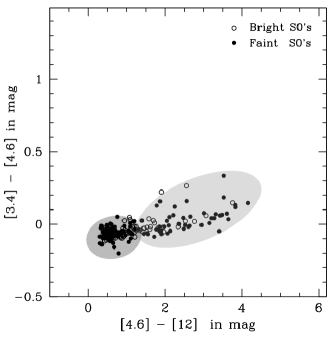
All sky imaging and source catalogs in 4 mid-infrared bands are now available from the WISE data archive. Using data from 3 of these bands, Wright et al. (2010) have plotted a color-color diagram (see their Fig. 12), to indicate the positions of different classes of astronomical sources in mid-IR colour space. All the galaxies in our sample have data in the WISE survey; following Wright et al. (2010) we plot a colour-colour diagram of (3.4 - 4.6) micron colour versus (4.6 - 12) micron colour for our sample in Figure 8. The dark grey shaded ellipse is the region of colour-colour space occupied by elliptical galaxies while the light grey shaded ellipse is the region occupied by spiral galaxies. In mid-IR colour space, bright S0 galaxies dominate in the region of elliptical galaxies, while faint S0 galaxies dominate in the region of spiral galaxies. Mid IR colours seem to strengthen the association between bright S0s and ellipticals and faint S0s and spirals.
4 Conclusion
In a series of previous papers, Barway et al. (2007, 2009, 2011) we have presented evidence to suggest that the two types of S0 galaxies differentiated by luminosity have fundamentally different formation scenarios. The two populations show systematic differences in a number of correlations (, Kormendy relation, photometric plane etc.) and in their bar fraction. Their bulges retain signatures of their radically different formation history - those in bright S0 galaxies are overwhelmingly classical bulges; a large fraction of those in faint S0 galaxies are pseudo bulges.
The analysis of UV-Optical-nearIR-midIR colours of S0 galaxies in the present paper, when used as simple estimators of their star formation history, also lends support to the view that bright and faint S0 galaxies are fundamentally different. Stellar populations in bright S0 galaxies resemble those in ellipticals and bulges of early-type spirals suggesting that they may have formed the bulk of their stars at early epochs via major mergers or rapid collapse. These galaxies may also have a smaller amount of recent star formation due to minor mergers (Kaviraj et al. 2007), consistent with the hierarchical paradigm. Just over half the faint S0 galaxies, on the other hand, seem to have stellar populations that cannot be explained by a simple stellar population of any age. These galaxies must have had multiple major episodes of star formation. Such a complex star formation history is expected when the bulge grows via internal secular evolution processes with episodic star formation fueled by bar driven inflows (more likely in the field) or via environment influenced secular evolution processes such as minor mergers, ram pressure stripping and galaxy harassment (more common in groups/clusters). In internal secular evolution, the transformation to a S0 appearance can only happen when the bulge luminosity becomes comparable to the disk luminosity and the star formation in the spiral arms becomes sufficiently weak to render them invisible. Both internal and environment induced processes, when operating on spiral galaxies, would tend to transform them into S0 galaxies.
band luminosity is a reasonable proxy for stellar mass which is dominated by contributions from low mass stars whose emission peaks in the near-infrared band. It may well be that stellar mass and not K-band luminosity is a more relevant physical parameter that separates the two classes of S0 galaxies. Nevertheless, we have chosen to use band luminosity in our analysis, since it is a directly measured quantity from the imaging, unlike the mass whose computation requires some model dependent assumptions.
It would be interesting to see if kinematic signatures as traced by 3D spectroscopy would be different for the two galaxy types. We hope to explore this aspect in a forthcoming paper.
acknowledgements
We thank the anonymous referee for insightful comments that have improved both the content and presentation of this paper. YW thanks Sushruti Santhanam for continuous support, especially during his visit to the SAAO.
This paper is based upon work supported financially by the National Research Foundation (NRF). Any opinions, findings and conclusions or recommendations expressed in this paper are those of the authors and therefore the NRF does not accept any liability in regard thereto. This work was supported by a bilateral grant under the Indo-South Africa Science and Technology Cooperation (UID-76354) funded by Departments of Science and Technology (DST) of the Indian and South African Governments.
GALEX (Galaxy Evolution Explorer) is a NASA Small Explorer, launched in 2003 April. We gratefully acknowledge NASA’s support for construction, operation, and science analysis for the GALEX mission, developed in cooperation with the Centre National d’Études Spatiales of France and the Korean Ministry of Science and Technology.
This research has made use of the NASA/IPAC Extragalactic Database (NED), which is operated by the Jet Propulsion Laboratory, California Institute of Technology (Caltech) under contract with NASA.
Funding for SDSS-III has been provided by the Alfred P. Sloan Foundation, the Participating Institutions, the National Science Foundation, and the U.S. Department of Energy Office of Science. The SDSS-III web site is http://www.sdss3.org/.
SDSS-III is managed by the Astrophysical Research Consortium for the Participating Institutions of the SDSS-III Collaboration including the University of Arizona, the Brazilian Participation Group, Brookhaven National Laboratory, University of Cambridge, Carnegie Mellon University, University of Florida, the French Participation Group, the German Participation Group, Harvard University, the Instituto de Astrofisica de Canarias, the Michigan State/Notre Dame/JINA Participation Group, Johns Hopkins University, Lawrence Berkeley National Laboratory, Max Planck Institute for Astrophysics, Max Planck Institute for Extraterrestrial Physics, New Mexico State University, New York University, Ohio State University, Pennsylvania State University, University of Portsmouth, Princeton University, the Spanish Participation Group, University of Tokyo, University of Utah, Vanderbilt University, University of Virginia, University of Washington, and Yale University.
This publication makes use of data products from the Two Micron All Sky Survey, which is a joint project of the University of Massachusetts and the Infrared Processing and Analysis Center/California Institute of Technology, funded by the National Aeronautics and Space Administration and the National Science Foundation. This publication makes use of data products from the Wide-field Infrared Survey Explorer (WISE), which is a joint project of the University of California, Los Angeles, and the Jet Propulsion Laboratory/California Institute of Technology, funded by the National Aeronautics and Space Administration.
References
- [Abadi, Moore, & Bower 1999] Abadi M. G., Moore B., Bower R. G., 1999, MNRAS, 308, 947
- [Abazajian, Adelman-McCarthy, Agüeros, Allam, Allende Prieto, An, Anderson, Anderson, Annis, Bahcall, & et al. 2009] Abazajian K. N., Adelman-McCarthy J. K., Agüeros M. A., Allam S. S., Allende Prieto C., An D., Anderson K. S. J., Anderson S. F., et al., 2009, ApJS, 182, 543
- [Aguerri, Iglesias-Páramo, Vílchez, Muñoz-Tuñón, & Sánchez-Janssen 2005] Aguerri J. A. L., Iglesias-Páramo J., Vílchez J. M., Muñoz-Tuñón C., Sánchez-Janssen R., 2005, AJ, 130, 475
- [Ahn, Alexandroff, Allende Prieto, Anderson, Anderton, Andrews, Aubourg, Bailey, Balbinot, Barnes, & et al. 2012] Ahn C. P., Alexandroff R., Allende Prieto C., Anderson S. F., Anderton T., Andrews B. H., Aubourg É., Bailey S., et al., 2012, ApJS, 203, 21
- [Aragón-Salamanca, Bedregal, & Merrifield 2006] Aragón-Salamanca A., Bedregal A. G., Merrifield M. R., 2006, A&A, 458, 101
- [Athanassoula, Lambert, & Dehnen 2005] Athanassoula E., Lambert J. C., Dehnen W., 2005, MNRAS, 363, 496
- [Athanassoula, Machado, & Rodionov 2013] Athanassoula E., Machado R. E. G., Rodionov S. A., 2013, MNRAS, 429, 1949
- [Balick, Faber, & Gallagher 1976] Balick B., Faber S. M., Gallagher J. S., 1976, ApJ, 209, 710
- [Balogh, Morris, Yee, Carlberg, & Ellingson 1999] Balogh M. L., Morris S. L., Yee H. K. C., Carlberg R. G., Ellingson E., 1999, ApJ, 527, 54
- [Barr, Bedregal, Aragón-Salamanca, Merrifield, & Bamford 2007] Barr J. M., Bedregal A. G., Aragón-Salamanca A., Merrifield M. R., Bamford S. P., 2007, A&A, 470, 173
- [Barway, Kembhavi, Wadadekar, Ravikumar, & Mayya 2007] Barway S., Kembhavi A., Wadadekar Y., Ravikumar C. D., Mayya Y. D., 2007, ApJ, 661, L37
- [Barway, Wadadekar, & Kembhavi 2011] Barway S., Wadadekar Y., Kembhavi A. K., 2011, MNRAS, 410, L18
- [Barway, Wadadekar, Kembhavi, & Mayya 2009] Barway S., Wadadekar Y., Kembhavi A. K., Mayya Y. D., 2009, MNRAS, 394, 1991
- [Bedregal, Aragón-Salamanca, & Merrifield 2006] Bedregal A. G., Aragón-Salamanca A., Merrifield M. R., 2006, MNRAS, 373, 1125
- [Berentzen, Shlosman, Martinez-Valpuesta, & Heller 2007] Berentzen I., Shlosman I., Martinez-Valpuesta I., Heller C. H., 2007, ApJ, 666, 189
- [Bothun & Gregg 1990] Bothun G. D., Gregg M. D., 1990, ApJ, 350, 73
- [Bournaud, Combes, & Semelin 2005] Bournaud F., Combes F., Semelin B., 2005, MNRAS, 364, L18
- [Bruzual & Charlot 2003] Bruzual G., Charlot S., 2003, MNRAS, 344, 1000
- [Cardelli, Clayton, & Mathis 1989] Cardelli J. A., Clayton G. C., Mathis J. S., 1989, ApJ, 345, 245
- [Carollo 1999] Carollo C. M., 1999, ApJ, 523, 566
- [Coelho & Gadotti 2011] Coelho P., Gadotti D. A., 2011, ApJ, 743, L13
- [Cohen, Wheaton, & Megeath 2003] Cohen M., Wheaton W. A., Megeath S. T., 2003, AJ, 126, 1090
- [Davis, Bureau, Young, Alatalo, Blitz, Cappellari, Scott, Bois, Bournaud, Davies, de Zeeuw, Emsellem, Khochfar, Krajnović, Kuntschner, Lablanche, McDermid, Morganti, Naab, Oosterloo, Sarzi, Serra, & Weijmans 2011] Davis T. A., Bureau M., Young L. M., Alatalo K., Blitz L., Cappellari M., Scott N., Bois M., et al., 2011, MNRAS, 414, 968
- [Donas, Deharveng, Rich, Yi, Lee, Boselli, Gil de Paz, Boissier, Charlot, Salim, Bianchi, Barlow, Forster, Friedman, Heckman, Madore, Martin, Milliard, Morrissey, Neff, Schiminovich, Seibert, Small, Szalay, Welsh, & Wyder 2007] Donas J., Deharveng J.-M., Rich R. M., Yi S. K., Lee Y.-W., Boselli A., Gil de Paz A., Boissier S., et al., 2007, ApJS, 173, 597
- [Dressler 1980] Dressler A., 1980, ApJ, 236, 351
- [Eliche-Moral, Gonzalez-Garcia, Aguerri, Gallego, Zamorano, Balcells, & Prieto 2012] Eliche-Moral M. C., Gonzalez-Garcia A. C., Aguerri J. A. L., Gallego J., Zamorano J., Balcells M., Prieto M., 2012, ArXiv e-prints
- [Ellison, Nair, Patton, Scudder, Mendel, & Simard 2011] Ellison S. L., Nair P., Patton D. R., Scudder J. M., Mendel J. T., Simard L., 2011, MNRAS, 416, 2182
- [Ferrari, Pastoriza, Macchetto, & Caon 1999] Ferrari F., Pastoriza M. G., Macchetto F., Caon N., 1999, A&AS, 136, 269
- [Gadotti 2009] Gadotti D. A., 2009, MNRAS, 393, 1531
- [Gadotti 2011] —, 2011, MNRAS, 415, 3308
- [Gil de Paz, Boissier, Madore, Seibert, Joe, Boselli, Wyder, Thilker, Bianchi, Rey, Rich, Barlow, Conrow, Forster, Friedman, Martin, Morrissey, Neff, Schiminovich, Small, Donas, Heckman, Lee, Milliard, Szalay, & Yi 2007] Gil de Paz A., Boissier S., Madore B. F., Seibert M., Joe Y. H., Boselli A., Wyder T. K., Thilker D., et al., 2007, ApJS, 173, 185
- [Hopkins, Croton, Bundy, Khochfar, van den Bosch, Somerville, Wetzel, Keres, Hernquist, Stewart, Younger, Genel, & Ma 2010] Hopkins P. F., Croton D., Bundy K., Khochfar S., van den Bosch F., Somerville R. S., Wetzel A., Keres D., et al., 2010, ApJ, 724, 915
- [Hubble 1936] Hubble E. P., 1936, Realm of the Nebulae
- [Kaviraj, Schawinski, Devriendt, Ferreras, Khochfar, Yoon, Yi, Deharveng, Boselli, Barlow, Conrow, Forster, Friedman, Martin, Morrissey, Neff, Schiminovich, Seibert, Small, Wyder, Bianchi, Donas, Heckman, Lee, Madore, Milliard, Rich, & Szalay 2007] Kaviraj S., Schawinski K., Devriendt J. E. G., Ferreras I., Khochfar S., Yoon S.-J., Yi S. K., Deharveng J.-M., et al., 2007, ApJS, 173, 619
- [Knapp, Guhathakurta, Kim, & Jura 1989] Knapp G. R., Guhathakurta P., Kim D.-W., Jura M. A., 1989, ApJS, 70, 329
- [Knapp, Turner, & Cunniffe 1985] Knapp G. R., Turner E. L., Cunniffe P. E., 1985, AJ, 90, 454
- [Kormendy & Bender 2012] Kormendy J., Bender R., 2012, ApJS, 198, 2
- [Kormendy & Kennicutt 2004] Kormendy J., Kennicutt Jr. R. C., 2004, Ann. Rev. Astron. Astrophys. , 42, 603
- [Kraljic, Bournaud, & Martig 2012] Kraljic K., Bournaud F., Martig M., 2012, ApJ, 757, 60
- [Lisker, Grebel, & Binggeli 2006] Lisker T., Grebel E. K., Binggeli B., 2006, AJ, 132, 497
- [Muñoz-Mateos, Gil de Paz, Zamorano, Boissier, Dale, Pérez-González, Gallego, Madore, Bendo, Boselli, Buat, Calzetti, Moustakas, & Kennicutt 2009] Muñoz-Mateos J. C., Gil de Paz A., Zamorano J., Boissier S., Dale D. A., Pérez-González P. G., Gallego J., Madore B. F., et al., 2009, ApJ, 703, 1569
- [Munn 1992] Munn J. A., 1992, ApJ, 399, 444
- [Nilson 1973] Nilson P., 1973, Uppsala general catalogue of galaxies
- [Oke & Gunn 1983] Oke J. B., Gunn J. E., 1983, ApJ, 266, 713
- [Oser, Ostriker, Naab, Johansson, & Burkert 2010] Oser L., Ostriker J. P., Naab T., Johansson P. H., Burkert A., 2010, ApJ, 725, 2312
- [Sánchez-Janssen & Aguerri 2012] Sánchez-Janssen R., Aguerri J. A. L., 2012, MNRAS, 424, 2614
- [Sarzi, Falcón-Barroso, Davies, Bacon, Bureau, Cappellari, de Zeeuw, Emsellem, Fathi, Krajnović, Kuntschner, McDermid, & Peletier 2006] Sarzi M., Falcón-Barroso J., Davies R. L., Bacon R., Bureau M., Cappellari M., de Zeeuw P. T., Emsellem E., et al., 2006, MNRAS, 366, 1151
- [Scannapieco & Athanassoula 2012] Scannapieco C., Athanassoula E., 2012, MNRAS, 425, L10
- [Schawinski, Khochfar, Kaviraj, Yi, Boselli, Barlow, Conrow, Forster, Friedman, Martin, Morrissey, Neff, Schiminovich, Seibert, Small, Wyder, Bianchi, Donas, Heckman, Lee, Madore, Milliard, Rich, & Szalay 2006] Schawinski K., Khochfar S., Kaviraj S., Yi S. K., Boselli A., Barlow T., Conrow T., Forster K., et al., 2006, Nature, 442, 888
- [Schlegel, Finkbeiner, & Davis 1998] Schlegel D. J., Finkbeiner D. P., Davis M., 1998, ApJ, 500, 525
- [Schweizer & Seitzer 1992] Schweizer F., Seitzer P., 1992, AJ, 104, 1039
- [Skibba, Masters, Nichol, Zehavi, Hoyle, Edmondson, Bamford, Cardamone, Keel, Lintott, & Schawinski 2012] Skibba R. A., Masters K. L., Nichol R. C., Zehavi I., Hoyle B., Edmondson E. M., Bamford S. P., Cardamone C. N., et al., 2012, MNRAS, 423, 1485
- [Skrutskie, Cutri, Stiening, Weinberg, Schneider, Carpenter, Beichman, Capps, Chester, Elias, Huchra, Liebert, Lonsdale, Monet, Price, Seitzer, Jarrett, Kirkpatrick, Gizis, Howard, Evans, Fowler, Fullmer, Hurt, Light, Kopan, Marsh, McCallon, Tam, Van Dyk, & Wheelock 2006] Skrutskie M. F., Cutri R. M., Stiening R., Weinberg M. D., Schneider S., Carpenter J. M., Beichman C., Capps R., et al., 2006, AJ, 131, 1163
- [Tago, Saar, Tempel, Einasto, Einasto, Nurmi, & Heinämäki 2010] Tago E., Saar E., Tempel E., Einasto J., Einasto M., Nurmi P., Heinämäki P., 2010, A&A, 514, A102
- [Temi, Brighenti, & Mathews 2009] Temi P., Brighenti F., Mathews W. G., 2009, ApJ, 695, 1
- [Tomita, Aoki, Watanabe, Takata, & Ichikawa 2000] Tomita A., Aoki K., Watanabe M., Takata T., Ichikawa S.-i., 2000, AJ, 120, 123
- [van den Bergh 2012] van den Bergh S., 2012, ApJ, 754, 68
- [van Dokkum & Franx 1995] van Dokkum P. G., Franx M., 1995, AJ, 110, 2027
- [van Driel & van Woerden 1991] van Driel W., van Woerden H., 1991, A&A, 243, 71
- [Wardle & Knapp 1986] Wardle M., Knapp G. R., 1986, AJ, 91, 23
- [Welch & Sage 2003] Welch G. A., Sage L. J., 2003, ApJ, 584, 260
- [Wright, Eisenhardt, Mainzer, Ressler, Cutri, Jarrett, Kirkpatrick, Padgett, McMillan, Skrutskie, Stanford, Cohen, Walker, Mather, Leisawitz, Gautier, McLean, Benford, Lonsdale, Blain, Mendez, Irace, Duval, Liu, Royer, Heinrichsen, Howard, Shannon, Kendall, Walsh, Larsen, Cardon, Schick, Schwalm, Abid, Fabinsky, Naes, & Tsai 2010] Wright E. L., Eisenhardt P. R. M., Mainzer A. K., Ressler M. E., Cutri R. M., Jarrett T., Kirkpatrick J. D., Padgett D., et al., 2010, AJ, 140, 1868
- [Wyder, Treyer, Milliard, Schiminovich, Arnouts, Budavári, Barlow, Bianchi, Byun, Donas, Forster, Friedman, Heckman, Jelinsky, Lee, Madore, Malina, Martin, Morrissey, Neff, Rich, Siegmund, Small, Szalay, & Welsh 2005] Wyder T. K., Treyer M. A., Milliard B., Schiminovich D., Arnouts S., Budavári T., Barlow T. A., Bianchi L., et al., 2005, ApJ, 619, L15
- [Young, Bureau, Davis, Combes, McDermid, Alatalo, Blitz, Bois, Bournaud, Cappellari, Davies, de Zeeuw, Emsellem, Khochfar, Krajnović, Kuntschner, Lablanche, Morganti, Naab, Oosterloo, Sarzi, Scott, Serra, & Weijmans 2011] Young L. M., Bureau M., Davis T. A., Combes F., McDermid R. M., Alatalo K., Blitz L., Bois M., et al., 2011, MNRAS, 414, 940