Numerical resolution limits on subhalo abundance matching
Abstract
Subhalo abundance matching (SHAM) inserts galaxies into dark matter only simulations of the growth of cosmic structure in a way that requires minimal assumptions about galaxy formation. A galaxy is placed at the potential minimum of each distinct self-bound subhalo with a luminosity which is a monotonically increasing function of the maximum mass (or circular velocity) attained over the subhalo’s earlier history. Galaxy and subhalo properties are linked by matching model and observed luminosity functions. Simulated structures can then be compared in detail with observation, for example, through galaxy correlation statistics, group catalogues, or galaxy-galaxy lensing. Robust astrophysical conclusions can be drawn from such a comparison only on scales which are unaffected by the numerical limitations of the simulation. Here we compare results for the Millennium Simulation (MS) with subhalos defined using the SUBFIND to those obtained applying identical analysis to the much higher resolution Millennium-II. Correlation statistics on scales between 200 kpc and 2 Mpc converge to within 20% only for subhalos with masses at infall corresponding to at least 1000 simulation particles in the MS. Numerically converged results can be obtained to much lower infall particle number, if galaxies are followed even after their associated subhalos have been tidally disrupted, as in most recent semi-analytic galaxy formation simulations. This allows robust comparison between simulation and observation over a wider dynamic range in mass than for a SHAM analysis which ignores such “orphan” galaxies.
keywords:
cosmology: theory – cosmology: dark matter mass function – galaxies: luminosity function, stellar mass function – galaxies: haloes – methods: N-body simulations1 Introduction
The CDM model has proved consistent with observed cosmic structure over a wide range of scales and epochs, for example, the fluctuations in the cosmic microwave background (Dunkley et al., 2009), the Lyman forest absorption in quasar spectra (McDonald et al., 2006) and the large-scale clustering of galaxies (Percival et al., 2010). In this scenario, small halos form first and then progressively accrete and merge to form larger systems, a process which is quite well described by the simple excursion set model of Press & Schechter (1974) and its later extensions (Bond et al., 1991; Bower, 1991; Lacey & Cole, 1993; Sheth & Tormen, 1999). Current N-body simulations can follow dark halo growth at high resolution and in its full cosmological context for objects ranging from halos too small to host galaxies (e.g. Gao et al., 2004) to those hosting the most massive galaxy clusters (e.g. Gao et al., 2012; Angulo et al., 2012). While there is good agreement on the structure predicted in the absence of baryonic effects, this agreement evaporates when such effects are included, and there is little consensus on the properties of the galaxy which should form in any particular halo (see, for example, the review of Frenk & White, 2012). This is because galaxy formation involves complex and poorly understood processes linking a very wide range of scales, in particular, star and black hole formation and the strong feedback processes which they generate.
In the standard scenario, galaxies form as gas cools and condenses at the centres of the evolving population of dark halos (White & Rees, 1978). The most direct way to study galaxy formation in a CDM cosmology is via full simulation (e.g. Navarro & White, 1994; Cen & Ostriker, 2000; Springel & Hernquist, 2003; Kereš et al., 2005; Pfrommer et al., 2006; Governato et al., 2012; Guedes et al., 2012). Such hydrodynamic simulations follow the gas dynamics in considerable detail, but they are expensive in terms of both memory and CPU time, and their results depend strongly on the recipes adopted for unresolved processes (e.g. Scannapieco et al., 2012). An alternative is provided by so-called semi-analytic models which employ simple, physically and observationally motivated prescriptions for baryonic physics (White & Frenk, 1991; Kauffmann et al., 1993; Cole et al., 1994). These can be implemented on halo or subhalo merger trees extracted from dark-matter-only simulations and are useful for exploring evolution of the galaxy population (Kauffmann et al., 1999; Springel et al., 2001; Hatton et al., 2003; Kang et al., 2005; Bower et al., 2006; Guo et al., 2011). Many observables can be predicted rapidly for large number of galaxies, enabling a detailed check of a model’s ability to reproduce the abundance, clustering and intrinsic property distributions of galaxies over the full range of observed redshifts, while simultaneously providing an estimate of the efficiency of each of the processes involved (Guo et al., 2011; Henriques et al., 2013). Such simulations are particularly useful for calibrating and interpreting large observational surveys (e.g. Scoville et al., 2007; Coil et al., 2008; Meneux et al., 2008; Guzzo et al., 2008; McCracken et al., 2010; Adami et al., 2010; de la Torre et al., 2011; Knobel et al., 2012; Li et al., 2012; Planck Collaboration et al., 2012). Their main limitations arise from the simplicity of the individual recipes adopted, and from the very limited information they provide about the internal structure of galaxies.
In recent years, subhalo abundance matching (SHAM) has become a popular method for modeling the large-scale distribution of galaxies (e.g. Vale & Ostriker, 2004; Conroy et al., 2006; Shankar et al., 2006; Baldry et al., 2008; Moster et al., 2010; Guo et al., 2010; Behroozi et al., 2010; Wake et al., 2011). The main idea is to place galaxies in dark matter subhalos assuming a monotonic relation between the stellar mass (or luminosity) of the galaxy, and the maximum mass (or maximum circular velocity) ever attained by the subhalo during its earlier history. This is a strong assumption which is almost certainly incorrect in detail – for example, the properties of the galaxy should depend on the redshift at which its subhalo attains its maximum mass as well as on the mass itself (Wang et al., 2006; Wake et al., 2011; Yang et al., 2012) – but the method is convenient because it requires minimal assumptions and avoids the need to treat the physics of galaxy formation explicitly. A consequence, of course, is that it gives relatively little information about this physics. For example, the stellar mass function of galaxies is reproduced by construction, and so does not directly constrain the efficiencies of star and black hole formation and of the associated feedback. Galaxy formation information can, however, be backed out from the derived stellar mass–halo mass relation and by requiring the relations obtained at different redshifts to be consistent with the growth of structure expected in the CDM model (e.g. Conroy & Wechsler, 2009; Moster et al., 2013). Validating the SHAM approach requires comparisons with independent observations, e.g., galaxy correlation functions (e.g. Conroy et al., 2006; Moster et al., 2010; Trujillo-Gomez et al., 2011), group catalogues (e.g. More et al., 2011; Hearin et al., 2012), galaxy-galaxy lensing and satellite abundances (e.g. Guo et al., 2010; Leauthaud et al., 2012; Reddick et al., 2013). Overall the agreement is quite good, suggesting that the fundamental assumption is not seriously in error.
Robust simulation-based predictions of galaxy clustering require that the purely numerical limitations of the simulations be understood. In the case of SHAM, the most critical aspect is the need to correctly identify dark matter subhalos within larger mass objects over the full period for which they are supposed to represent galaxies within the corresponding group or cluster. Subhalos lose mass rapidly once they merge into a larger system, and any particular simulation may lose track of a subhalo well before its galaxy should be lost to disruption or merging. The extent of such premature subhalo loss depends both on simulation parameters (primarily mass resolution and softening) and on the subhalo identification algorithm, and is manifest in a SHAM analysis through an underprediction of small-scale clustering. It can be compensated by continuing to follow “orphan” galaxies that have lost their subhalo, as is done in many semi-analytic models, but at the cost of adopting parametrised recipes for the lifetimes and orbits of the galaxies, thus losing some of the simplicity of the SHAM methodology (Moster et al., 2010; Neistein et al., 2011; Moster et al., 2013; Neistein & Khochfar, 2012).
Here we study these resolution effects by comparing results from SHAM analyses applied to the Millennium (MS, Springel et al., 2005) and Millennium-II (MS-II, Boylan-Kolchin et al., 2009) simulations. These differ by a factor of 125 in particle mass and a factor of 5 in force softening, allowing us to explore how well the clustering predicted for the MS converges to that predicted for the much higher resolution MS-II. In addition, we illustrate how this convergence is affected by including orphan galaxies by applying a directly analogous clustering analysis to the semi-analytic galaxy catalogues made for the two simulations by Guo et al. (2011). Note that we are not here concerned with how well either scheme reproduces the clustering of observed galaxies (indeed, Guo et al. (2011) show explicitly that their model fails to match observation in several aspects) but rather with understanding the mass range over which each scheme produces numerically converged results when applied to the MS. This is clearly a prerequisite for robust conclusions about astrophysics to be drawn from a comparison with real galaxy clustering.
In contrast, Wetzel et al. (2010) discuss the requirements on subhalo tracking for the SHAM approach to reproduce the observed clustering of SDSS galaxies with M-20.5, concluding that the relevant subhalos must be followed at least to the point where their mass has dropped by a factor of 30 to 100. They note that since typical simulations are able to identify subhalos down to a limit of about 30 particles, this implies that the halos identified with SDSS galaxies must be resolved with 1000 to 3000 particles at infall if the observed clustering is to be matched. This is similar to the criterion which we derive below for convergence of subhalo clustering to the results of a much higher resolution simulation, but since Wetzel et al. (2010) do not consider convergence issues, and we do not consider matching to observation, these two limits are, in fact, conceptually quite distinct. Some discussion of numerical issues was already given earlier by Wetzel et al. (2009) although without detailed convergence tests.
We summarize the main features of the MS and the MS-II in Sec. 2.1, while in Sec. 2.2 we briefly describe the semi-analytic model which Guo et al. (2011) implemented on the two simulations. In Sec.3.1 we study how the abundance of subhalos as a function of mass at infall and of maximum circular velocity at infall is affected by the limited mass resolution of the MS, while in Sec. 3.2 we examine how this affects the small-scale clustering of subhalos of given abundance, finding substantial effects for infall masses corresponding to fewer than about 1000 particles. Sec. 3.3 then uses the semi-analytic model to illustrate how the inclusion of orphan galaxies can substantially increase the mass range over which numerically converged clustering results can be obtained. Sec. 4 recapitulates and discusses our main results.
2 Simulations
In this section, we summarize the main features of the two simulations used in our analysis, and we briefly describe the semi-analytic models used to generate the simulated galaxy catalogues we compare with our SHAM catalogues.
2.1 The MS and MS-II
This analysis is based on two cosmological simulations, the Millennium and the Millennium-II. Both assume a CDM cosmology with parameters based on a combination of data from the 2dFGRS (Colless & et al., 2001) and the first-year WMAP release (Spergel et al., 2003): = 0.25, = 0.75, = 0.045, n = 1, = 0.9 and h = 0.73. These parameters are at best marginally consistent with the nine-year WMAP results(Hinshaw et al., 2012). However, this is of no consequence for the analysis we present in this paper.
The MS and the MS-II were carried in periodic volumes of side 500Mpc and 100Mpc, respectively. Both simulations used 21603 particles to follow the dark matter distribution from redshift 127 to the present day. Comoving gravitational softening lengths of 5kpc and 1kpc were used for the MS and the MS-II, respectively, so that the ratio of softening length to the mean interparticle particle separation was constant and was identical in the two simulations. Both the softenings and the integration parameters were chosen sufficiently conservatively that structural convergence between the two simulations is good and differing mass resolution is the primary driver of the effects we investigate below (see, for example, the tests presented by Boylan-Kolchin et al., 2009) 64 snapshots were stored for the MS and 68 for the MS-II, with the last 60 being identical in the two simulations. At each output time, friends-of-friends (FOF) groups were identified by linking particles with separation less than 0.2 of the mean value (Davis et al., 1985). The SUBFIND algorithm (Springel et al., 2001) was then applied to identify all self-bound subhalos within each FOF halo, and every subhalo was linked to a unique descendent at the next later output time in order to construct merger trees describing the complete assembly history of each subhalo. Halo/subhalo data were stored only for objects containing at least 20 particles, so that the smallest resolved subhalo in the MS has mass 2.4, while the corresponding resolution limit in the MS-II is 1.9. The readers are referred to Springel et al. (2005)and Boylan-Kolchin et al. (2009) for more detailed descriptions of the two simulations.
In each FOF group, the most massive self-bound subhalo is referred to as the ”main subhalo” or ”halo”. The center of the main subhalo is taken to be the gravitational potential minimum of the FOF group. The virial radius of the main subhalo is defined as the maximum radius within which the mean density is 200 times the critical value. The total mass enclosed is then defined as the virial mass of the group, . Within the virial radius, the maximum circular velocity is defined as
| (1) |
is a useful indicator of potential well depth for subhalos, since it is less affected by stripping and boundary definition effects than subhalo mass.
In the standard galaxy formation scenario, galaxy properties are expected to be closely related to the mass and potential well depth of the halo in which they form. When a halo falls into a more massive system, it progressively loses its outer regions until it is eventually destroyed. The galaxies, however, are much more compact, and so are little affected by tides until the final stage of disruption/merging. The baryonic properties of satellite galaxies are thus expected to be more closely related to the properties of their subhalo at the time of infall than to its current properties. In this paper, we follow the standard procedure in recent SHAM studies, and characterise subhalos by their mass or maximum circular velocity at infall (defined as the latest time when they were the main subhalo of their FOF group) when estimating their abundance for matching purposes. For the main subhalo of each group, this is the current value of these quantities. In both cases, however, we refer to the quantities as and , respectively, even though the past maximum mass of a satellite subhalo does not always occur at the time of infall.
2.2 Semi-analytic Models
The semi-analytic simulation technique populates halos with galaxies by applying a set of physically or observationally motivated recipes to merger trees extracted from N-body simulations. In this paper we will use galaxy catalogues from the semi-analytic model of Guo et al. (2011) which was implemented simultaneously on the same MS and MS-II subhalo catalogues which we use for our SHAM modelling. This semi-analytic model follows the reionization, infall, shock-heating, radiative cooling and condensation of diffuse gas onto galactic disks; the star formation within these disks and the associated metal production and wind generation; disk instabilities and galaxy mergers with their associated starbursts, formation of bulges, and formation and fuelling of central black holes; and the feedback from these black holes into the surrounding hot gas atmospheres. The model successfully reproduces the properties, abundances and large-scale clustering of present-day galaxies ranging from dwarf spheroidals to giant cDs. In this model all subhalos have a galaxy at their centre but not all galaxies are associated with a subhalo. When a subhalo is tidally disrupted, a timescale for orbital decay is calculated from the position of the subhalo just prior to disruption and from the masses of the subhalo, of its central galaxy and of the main halo within which it orbits. The position of the associated “orphan” galaxy relative to main halo centre is then taken to be that of the most bound particle of the pre-disruption halo, shrunk according to a simple dynamical friction model so that a merger occurs one dynamical friction time after subhalo disruption. Details may be found in Guo et al. (2011).
3 Results
3.1 Halo/subhalo abundance
Boylan-Kolchin et al. (2009) tested for numerical converence between the MS and the MS-II by comparing a number of standard quantitative measures of structure in the mass distributions of the two simulations. In particular, they calculated and compared mass autocorrelation functions at redshifts and finding agreement to better than about 10% on physical scales between kpc and Mpc and to better than 20% out to a comoving scale of Mpc. They also compared FOF halo mass functions at and , again finding agreement to within about 10% above a mass of 4 (around the minimum halo mass resolved in the MS). A similar test was carried out by Angulo et al. (2012) who in addition compared results with the much larger Millennium-XXL simulation.
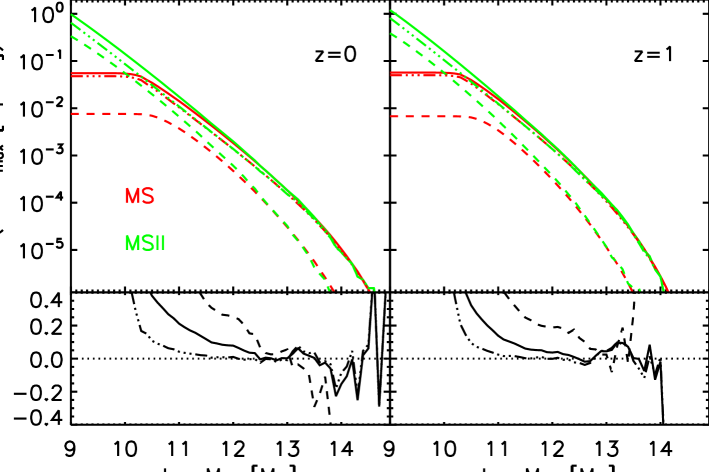
Both these statistics depend primarily on the abundance, internal structure and spatial distribution of halos and are relatively insensitive to substructure. This explains why good results are obtained down to masses corresponding to only a few tens of particles. Much larger resolution effects are found for statistics which depend on the properties of subhalos. Fig. 1 illustrates this point for the particular case of the subhalo abundance as a function of infall mass, a statistic often used in subhalo abundance matching (SHAM) analyses. The overall abundances are shown by solid curves, with the contributions from main subhalos and satellite subhalos indicated by dot-dashed and dashed curves respectively. The main subhalo mass functions agree to within 10% between the two simulations for masses above a few , just as for FoF halo masses, but differences of this order appear for satellite subhalos already at masses one hundred times greater. As a result, the overall subhalo mass function of the MS agrees with that of the MS-II to within 10% only above at , and above at . Thus, SHAM assignment of galaxies to simulations will only give numerically converged results at the 10% level for infall masses corresponding to particles or more.
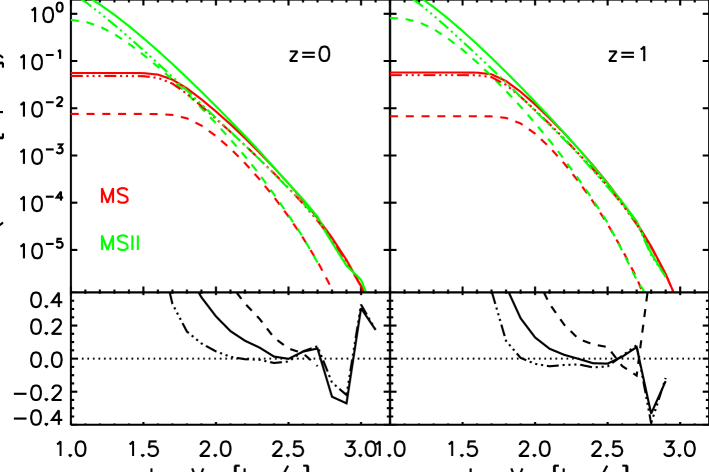
SHAM analyses often consider subhalo abundance as a function of rather than , since is a useful indicator of subhalo potential well depth and is less sensitive to the details of subhalo identification than . Fig. 2 is identical in format to Fig. 1 except that abundances are shown as functions of . The change in parametrisation has little effect on the convergence behaviour. The abundances of main subhalos agree within 10% for values above about 80 km/s, but similar agreement is obtained for satellite subhalos only for km/s. As a result a SHAM analysis based on the MS is converged at the 10% level only for galaxies with rotation velocities similar to the Milky Way.
3.2 Subhalo correlations
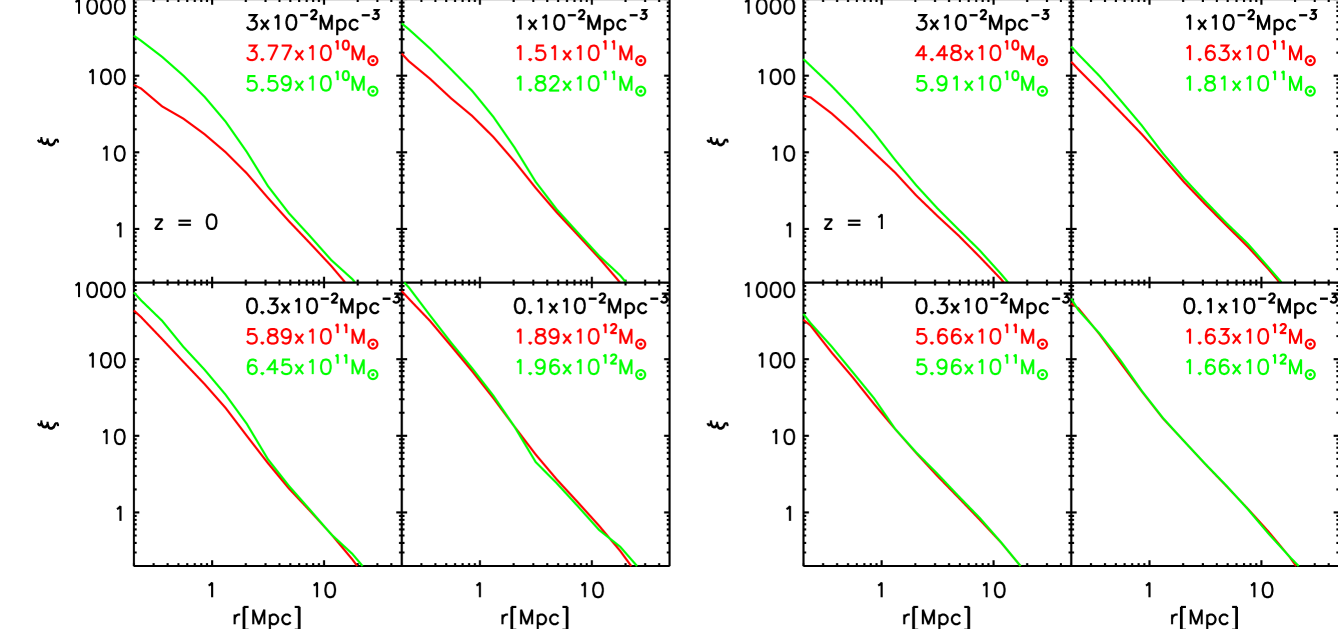
As the last subsection shows, differences in subhalo abundance between the two Millennium Simulations are primarily a reflection of lack of convergence in the properties of low-mass satellite subhalos. As a result, one may expect the small-scale clustering of subhalos to show even more serious disagreement. This is explored in Fig. 3 which compares autocorrelation functions for mass-limited subhalo samples chosen to have exactly matched abundances in the two simulations. The four panels in each set correspond to abundances differing by factors of three, as noted by the black label in each panel. The red and green labels indicate the lower limits on infall mass for the MS and MS-II respectively, with the same colours used for the corresponding curves. The left set of panels shows results for while the right set shows results for . We use this particular matching scheme in order to indicate the expected disagreement in galaxy correlations if the two simulations are populated with galaxies using SHAM.
The highest subhalo abundance considered () corresponds to a lower limit on infall halo mass of about both at and at . This is about the mass of the halo thought to host the Small Magellanic Cloud (e.g. Guo et al., 2010). To this limit the clustering amplitude of subhalos at is lower in the MS than in the MS-II by 20% on large scales, by a factor of two at Mpc, and by a factor of about four on 100 kpc scales. The discrepancy is similar on large scales at , but only about half as big on Mpc scales and below. For sparser samples, corresponding to higher minimum values of , the agreement improves, but only for the sparsest sample (, ) is it better than 20% on all but the smallest scales. Thus at the resolution of the MS, the SHAM procedure gives “precision” results for present-day clustering only for subhalos for which is greater than about times the mass of a simulation particle, corresponding to galaxies more massive than the Milky Way. A similar requirement for numerical convergence was suggested by Wetzel et al. (2009) although without presentation of the supporting numerical results.
At the convergence is already quite good for values corresponding to about 300 particles. This difference with would not be present in a universe where clustering was self-similar (i.e. an Einstein-de Sitter universe with a power-law initial fluctuation spectrum) and where the simulations compared at different redshifts have similar values of , where is the characteristic nonlinear mass of clustering at redshift and is the simulation particle mass. As a result, the difference we find must reflect one of three things: (i) the lower value of at ; (ii) the fact that the dimensionless growth rate of structure is lower at than at ; or (iii) the fact that the effective index of the linear power spectrum is larger at than at. Differentiating between these three possibilities would require additional simulation material.
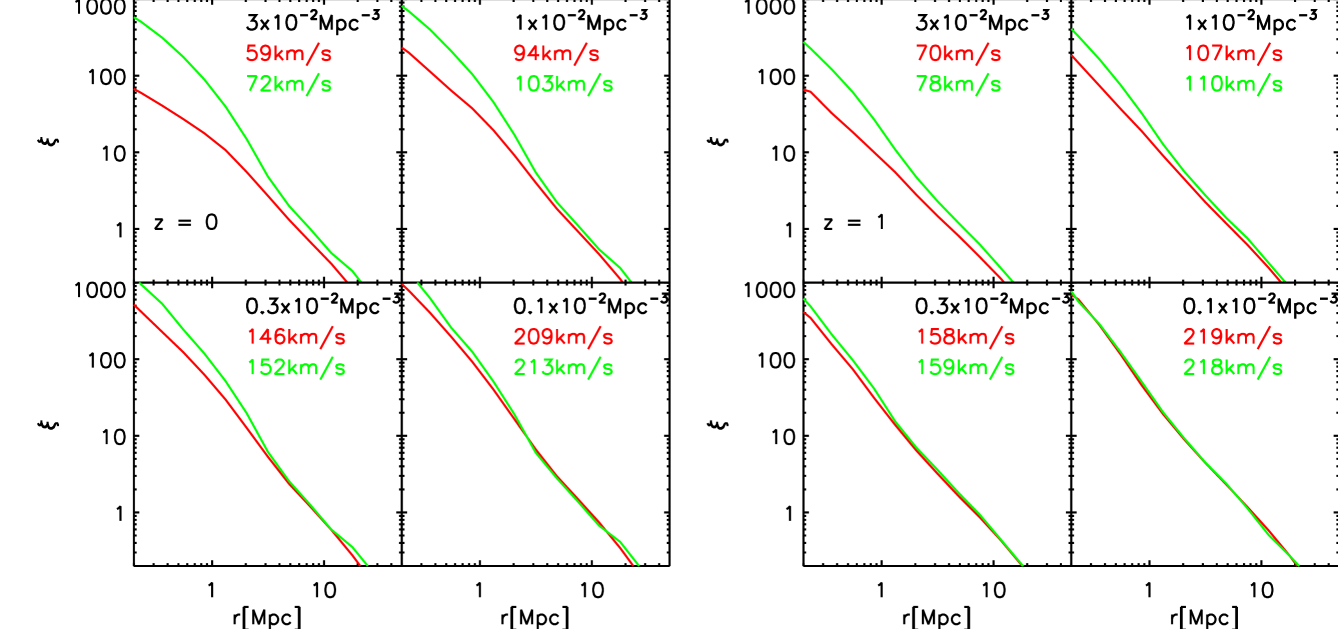
As shown in Fig. 4, very similar discrepancies are seen if subhalo samples are defined above a limiting value of rather than . Indeed, comparison with Fig. 3 shows the agreement to be significantly worse, both at and at , when this supposedly better proxy for galaxy mass is used for abundance matching in the two simulations. At the ratio reaches a factor of eight at a separation of 200 kpc for the highest density samples. The large-scale discrepancy is also bigger than in samples selected by . This is because at given mass (sub)halos formed at higher redshift are more compact and hence have higher . Thus, given that satellites typically assembled earlier than centrals of similar or , ranking by the former rather than the latter increases the ratio of satellite to central subhalos at each abundance.
A comparison of Figs 3 and 4 shows that, as already discussed by Reddick et al. (2013), SHAM clustering predictions depend significantly on which matching scheme is adopted. At the smallest scale plotted, the predictions for a given simulation and abundance can differ by almost a factor of two. Clearly at most one of the two schemes could be a precise representation of the small-scale clustering of any particular observational sample.
3.3 Autocorrelations for SA galaxies
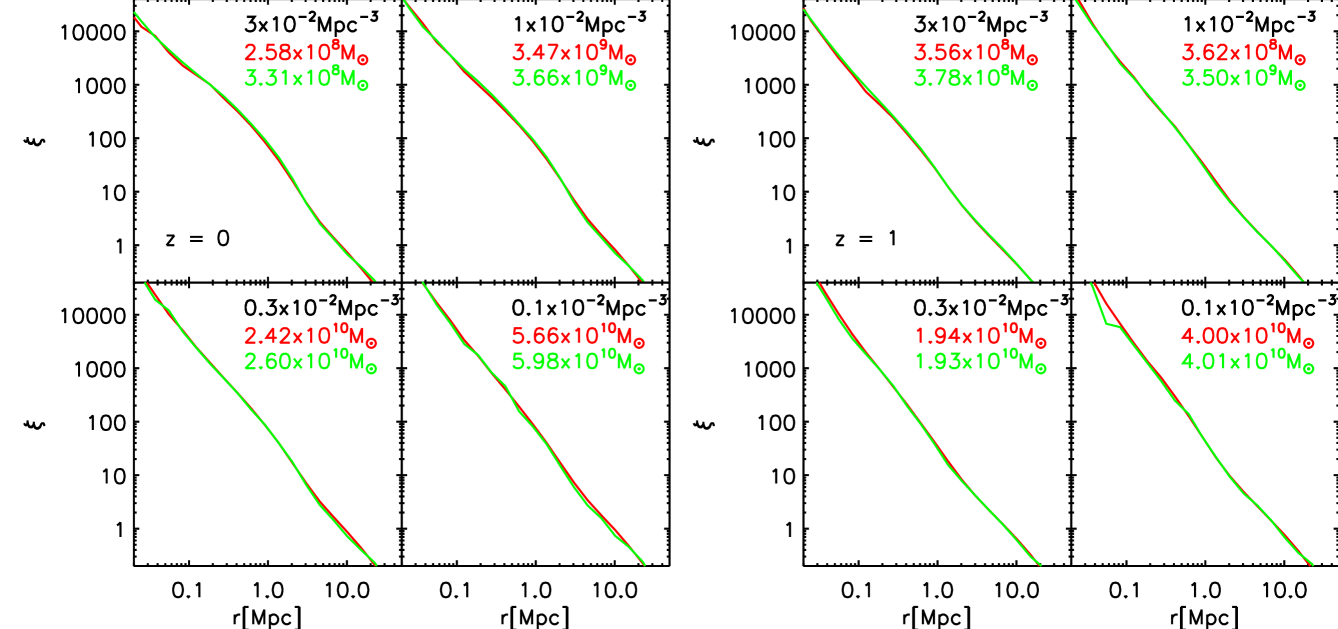
Our semi-analytic model follows satellite galaxies from the time their associated subhalos are disrupted until the galaxies themselves are tidally destroyed, or they merge with a more massive system. If the orbits of such orphan galaxies are modelled adequately, the galaxy population should be less subject to convergence problems of the kind discussed above than the subhalo population we have focussed on so far. Guo et al. (2011) show that galaxy abundances agree to better than 10% between the MS and the MS-II down to stellar masses of about , corresponding to . In addition, at given stellar mass, they show galaxy autocorrelations to agree to similar accuracy over the full separation range between 100 kpc to 10 Mpc. While clearly encouraging, these convergence tests are not directly comparable to those we presented above. We have therefore created matched, stellar-mass-limited samples of galaxies from the MS and MS-II both at and at and we compare their clustering exactly as we did for abundance-matched subhalo samples in Figs. 3 and 4.
The results are shown in Fig. 5. A first point to note is that, except for the densest samples at , the stellar mass limits for the two samples in each panel never differ by more than about 5%. This again emphasises how well the stellar mass functions agree in the two simulations, much better than the corresponding subhalo abundance functions and (e.g. compare with the differences in threshold listed in the panels of Figs 3 and 4). The most significant point, however, is that, apart from some noise effects on small scales, the autocorrelation functions in the two simulations agree almost perfectly in all panels across the full range of scales plotted. This is a strikingly different situation from those shown in Figs 3 and 4 for the abundance-matched subhalo samples. The relatively simple orphan-tracking methods used in the SA models substantially extend the range in stellar mass for which numerically converged results for galaxy clustering can be obtained, allowing results from the MS to be compared robustly with observation over more than two orders of magnitude in stellar mass. Guo et al. (2011) found substantial discrepancies for dwarf galaxies which more recent work has shown to be partly due to cosmology and partly to galaxy formation physics (Guo et al., 2013; Henriques et al., 2013).
’
4 Discussion
Subhalo abundance matching (SHAM) aims to provide a direct, physical and relatively assumption-free scheme for using large cosmological N-body simulations to interpret observational surveys of galaxy clustering and large-scale structure. Its principal assumption is that an observable property of the galaxies (for example their -band luminosity or their stellar mass) can, to sufficient accuracy, be assumed to be a monotonic function of some dark halo property (for example the mass or peak circular velocity at infall) which can be reliably measured for subhalos identified in an N-body simulation. Abundance matching then allows subhalos in the simulation to be populated with galaxies with known values of the observable.
Regardless of whether this procedure is an adequate representation of the galaxy formation process, it will only predict numerically converged properties for the galaxy population on scales where the abundance of subhalos as a function of the chosen property is independent of parameters such as simulation size and resolution. To investigate this issue, we compared subhalo catalogues constructed using the SUBFIND algorithm from the MS and MS-II, two simulations differing in mass resolution by a factor of 125. We found subhalo abundances to agree to better than 10% only for subhalos with infall masses corresponding to at least particles in the MS. Discrepancies arise at lower mass because satellite subhalos are tidally disrupted too early in the lower resolution simulation. This has a particularly marked effect on the small-scale clustering of subhalos, and SHAM predictions for galaxy autocorrelation functions at separations of 1.0 Mpc or less can be in error by factors of two or more if they use subhalos significantly less massive than the thousand particle limit.
Using the infall value of peak circular velocity () rather than of mass () to characterize subhaloes in the SHAM procedure makes numerical convergence problems worse rather than better. This is because at given abundance the fraction of satellites is larger in -limited subhalo samples than in -limited samples. At the resolution of the MS, the clustering predicted by either SHAM scheme is not well converged even for galaxies of similar mass to the Milky Way. Specifically, predicting autocorrelation functions accurate to 20% or better requires or km/s. Note that this conclusion may depend on the specific algorithm used to identify subhalos. The study of Onions et al. (2012) suggests that relatively small differences are likely for the algorithms in frequent general use, and that SUBFIND is fairly typical. Our own study makes clear that SHAM should not be used for “precision” interpretation of clustering observations without careful convergence testing of the kind we present.
Although some early SHAM studies populated subhalos with galaxies down to or values where we would predict substantial resolution effects (e.g Tasitsiomi et al., 2004; Conroy et al., 2006), most recent work has been quite conservative and does not appear to violate the limits we suggest here by large factors.111An exception is Behroozi et al. (2013a, b) who present results down to subhalo infall masses coresponding to fewer than 100 particles, where we expect resolution effects to be large. Nevertheless, without an explicit test it is difficult to be sure that results are converged, and comparison of our Fig. 4 to Figs 14 and 15 of Trujillo-Gomez et al. (2011) suggests that resolution may significantly affect their SHAM analysis of the Bolshoi simulation for . If this is indeed the case, then significant though relatively small effects are also present in other recent SHAM analyses of this same simulation at the corresponding abundances and separations (e.g. Reddick et al., 2013; Behroozi et al., 2013a, b; Watson & Conroy, 2013).
Our study of clustering for the semi-analytic galaxy populations of Guo et al. (2011) shows that tracking orphan galaxies explicitly can substantially improve numerical convergence at low stellar mass. Apparently, the treatment of orphans in these models does a surprisingly good job of removing the resolution dependence of satellite disruption, the principal cause of discrepancies between the SHAM catalogues built from the MS and MS-II.222Note that we are claiming only that semi-analytic models are numerically converged to significantly lower mass than SHAM models, when both are applied to a given simulation. We are not claiming they are a better representation of the real world. Indeed, Guo et al. (2011) demonstrated that their model significantly overpredicts the clustering of low-mass galaxies. This has already been recognised in several previous studies which included semi-analytic modelling of orphans in an otherwise near-standard SHAM analysis (Moster et al., 2010; Neistein et al., 2011; Neistein & Khochfar, 2012; Moster et al., 2013). In practice, however, SA models have an advantage over SHAM schemes when interpreting clustering in large observational surveys not just because their treatment of orphans substantially expands the range of subhalo masses which can be robustly populated with galaxies, but also because their physically realistic treatment of galaxy evolution guarantees consistent assignment of galaxies to subhalos over the relatively broad range of redshifts spanned by most next-generation surveys.
Acknowledgments
GQ acknowledges a Royal Society Newton International Fellowship the Partner Group program of the Max Planck Society, the National basic research program of China (program 973 under grant No. 2009CB24901), and the Young Researcher Grant of National Astronomical Observatories, CAS, the NSFC grants program (No. 11143005). SW acknowledges support from Advanced Grant 246797 “GALFORMOD” from the European Research Council.
References
- Adami et al. (2010) Adami C., Durret F., Benoist C., Coupon J., Mazure A., Meneux B., Ilbert O., Blaizot J., et al. 2010, A&A, 509, A81
- Angulo et al. (2012) Angulo R. E., Springel V., White S. D. M., Jenkins A., Baugh C. M., Frenk C. S., 2012, MNRAS, 426, 2046
- Baldry et al. (2008) Baldry I. K., Glazebrook K., Driver S. P., 2008, MNRAS, 388, 945
- Behroozi et al. (2010) Behroozi P. S., Conroy C., Wechsler R. H., 2010, ApJ, 717, 379
- Behroozi et al. (2013a) Behroozi P. S., Wechsler R. H., Conroy C., 2013a, ApJ, 762, L31
- Behroozi et al. (2013b) Behroozi P. S., Wechsler R. H., Conroy C., 2013b, ApJ, 770, 57
- Bond et al. (1991) Bond J. R., Cole S., Efstathiou G., Kaiser N., 1991, ApJ, 379, 440
- Bower (1991) Bower R. G., 1991, MNRAS, 248, 332
- Bower et al. (2006) Bower R. G., Benson A. J., Malbon R., Helly J. C., Frenk C. S., Baugh C. M., Cole S., Lacey C. G., 2006, MNRAS, 370, 645
- Boylan-Kolchin et al. (2008) Boylan-Kolchin M., Ma C.-P., Quataert E., 2008, MNRAS, 383, 93
- Boylan-Kolchin et al. (2009) Boylan-Kolchin M., Springel V., White S. D. M., Jenkins A., Lemson G., 2009, MNRAS, 398, 1150
- Cen & Ostriker (2000) Cen R., Ostriker J. P., 2000, ApJ, 538, 83
- Coil et al. (2008) Coil A. L., Newman J. A., Croton D., Cooper M. C., Davis M., Faber S. M., Gerke B. F., Koo D. C., et al. 2008, ApJ, 672, 153
- Cole et al. (1994) Cole S., Aragon-Salamanca A., Frenk C. S., Navarro J. F., Zepf S. E., 1994, MNRAS, 271, 781
- Colless & et al. (2001) Colless M., et al. 2001, MNRAS, 328, 1039
- Conroy & Wechsler (2009) Conroy C., Wechsler R. H., 2009, ApJ, 696, 620
- Conroy et al. (2006) Conroy C., Wechsler R. H., Kravtsov A. V., 2006, ApJ, 647, 201
- Cooray (2006) Cooray A., 2006, MNRAS, 365, 842
- Davis et al. (1985) Davis M., Efstathiou G., Frenk C. S., White S. D. M., 1985, ApJ, 292, 371
- de la Torre et al. (2011) de la Torre S., Meneux B., De Lucia G., Blaizot J., Le Fèvre O., Garilli B., Cucciati O., Mellier Y., et al. 2011, A&A, 525, A125
- Dunkley et al. (2009) Dunkley J., Komatsu E., Nolta M. R., Spergel D. N., Larson D., Hinshaw G., Page L., Bennett C. L., et al. 2009, ApJS, 180, 306
- Frenk & White (2012) Frenk C. S., White S. D. M., 2012, Annalen der Physik, 524, 507
- Gao et al. (2012) Gao L., Navarro J. F., Frenk C. S., Jenkins A., Springel V., White S. D. M., 2012, MNRAS, 425, 2169
- Gao et al. (2004) Gao L., White S. D. M., Jenkins A., Stoehr F., Springel V., 2004, MNRAS, 355, 819
- Governato et al. (2012) Governato F., Zolotov A., Pontzen A., Christensen C., Oh S. H., Brooks A. M., Quinn T., Shen S., Wadsley J., 2012, MNRAS, 422, 1231
- Guedes et al. (2012) Guedes J., Mayer L., Carollo M., Madau P., 2012, ArXiv 1211.1713
- Guo et al. (2013) Guo Q., White S., Angulo R. E., Henriques B., Lemson G., Boylan-Kolchin M., Thomas P., Short C., 2013, MNRAS, 428, 1351
- Guo et al. (2011) Guo Q., White S., Boylan-Kolchin M., De Lucia G., Kauffmann G., Lemson G., Li C., Springel V., Weinmann S., 2011, MNRAS, 413, 101
- Guo et al. (2010) Guo Q., White S., Li C., Boylan-Kolchin M., 2010, MNRAS, 404, 1111
- Guzzo et al. (2008) Guzzo L., Pierleoni M., Meneux B., Branchini E., Le Fèvre O., Marinoni C., Garilli B., Blaizot J., et al. 2008, Nature, 451, 541
- Hatton et al. (2003) Hatton S., Devriendt J. E. G., Ninin S., Bouchet F. R., Guiderdoni B., Vibert D., 2003, MNRAS, 343, 75
- Hearin et al. (2012) Hearin A. P., Zentner A. R., Berlind A. A., Newman J. A., 2012, ArXiv 1210.4927
- Henriques et al. (2013) Henriques B. M. B., White S. D. M., Thomas P. A., Angulo R. E., Guo Q., Lemson G., Springel V., 2013, MNRAS, 431, 3373
- Hinshaw et al. (2012) Hinshaw G., Larson D., Komatsu E., Spergel D. N., Bennett C. L., Dunkley J., Nolta M. R., Halpern M., et al. 2012, ArXiv 1212.5226
- Kang et al. (2005) Kang X., Jing Y. P., Mo H. J., Börner G., 2005, ApJ, 631, 21
- Kauffmann et al. (1999) Kauffmann G., Colberg J. M., Diaferio A., White S. D. M., 1999, MNRAS, 303, 188
- Kauffmann et al. (1993) Kauffmann G., White S. D. M., Guiderdoni B., 1993, MNRAS, 264, 201
- Kereš et al. (2005) Kereš D., Katz N., Weinberg D. H., Davé R., 2005, MNRAS, 363, 2
- Knobel et al. (2012) Knobel C., Lilly S. J., Iovino A., Kovač K., Bschorr T. J., Presotto V., Oesch P. A., Kampczyk P., et al. 2012, ApJ, 753, 121
- Lacey & Cole (1993) Lacey C., Cole S., 1993, MNRAS, 262, 627
- Leauthaud et al. (2012) Leauthaud A., Tinker J., Bundy K., Behroozi P. S., Massey R., Rhodes J., George M. R., Kneib J.-P., et al. 2012, ApJ, 744, 159
- Li et al. (2012) Li C., White S. D. M., Chen Y., Coil A. L., Davis M., De Lucia G., Guo Q., Jing Y. P., Kauffmann G., Willmer C. N. A., Zhang W., 2012, MNRAS, 419, 1557
- Mandelbaum et al. (2006) Mandelbaum R., Seljak U., Kauffmann G., Hirata C. M., Brinkmann J., 2006, MNRAS, 368, 715
- McCracken et al. (2010) McCracken H. J., Capak P., Salvato M., Aussel H., Thompson D., Daddi E., Sanders D. B., Kneib J.-P., et al. 2010, ApJ, 708, 202
- McDonald et al. (2006) McDonald P., Seljak U., Burles S., Schlegel D. J., Weinberg D. H., Cen R., Shih D., Schaye J., Schneider D. P., Bahcall N. A., Briggs J. W., et al. 2006, ApJS, 163, 80
- Meneux et al. (2008) Meneux B., Guzzo L., Garilli B., Le Fèvre O., Pollo A., Blaizot J., De Lucia G., Bolzonella M., et al. 2008, A&A, 478, 299
- More et al. (2011) More S., van den Bosch F. C., Cacciato M., Skibba R., Mo H. J., Yang X., 2011, MNRAS, 410, 210
- More et al. (2011b) More S., van den Bosch F. C., Cacciato M., Skibba R., Mo H. J., Yang X., 2011b, MNRAS, 410, 210
- Moster et al. (2013) Moster B. P., Naab T., White S. D. M., 2013, MNRAS, 428, 3121
- Moster et al. (2010) Moster B. P., Somerville R. S., Maulbetsch C., van den Bosch F. C., Macciò A. V., Naab T., Oser L., 2010, ApJ, 710, 903
- Navarro & White (1994) Navarro J. F., White S. D. M., 1994, MNRAS, 267, 401
- Neistein & Khochfar (2012) Neistein E., Khochfar S., 2012, ArXiv e-prints
- Neistein et al. (2011) Neistein E., Li C., Khochfar S., Weinmann S. M., Shankar F., Boylan-Kolchin M., 2011, MNRAS, 416, 1486
- Onions et al. (2012) Onions J., Knebe A., Pearce F. R., Muldrew S. I., Lux H., Knollmann S. R., Ascasibar Y., Behroozi P., Elahi P., Han J., Maciejewski M., Merchán M. E., Neyrinck M., Ruiz A. N., Sgró M. A., Springel V., Tweed D., 2012, MNRAS, 423, 1200
- Percival et al. (2010) Percival W. J., Reid B. A., Eisenstein D. J., Bahcall N. A., Budavari T., Frieman J. A., Fukugita M., Gunn J. E., et al. 2010, MNRAS, 401, 2148
- Pfrommer et al. (2006) Pfrommer C., Springel V., Enßlin T. A., Jubelgas M., 2006, MNRAS, 367, 113
- Planck Collaboration et al. (2012) Planck Collaboration Ade P. A. R., Aghanim N., Arnaud M., Ashdown M., Atrio-Barandela F., Aumont J., Baccigalupi C., et al. 2012, ArXiv 1212.4131
- Press & Schechter (1974) Press W. H., Schechter P., 1974, ApJ, 187, 425
- Reddick et al. (2013) Reddick R. M., Wechsler R. H., Tinker J. L., Behroozi P. S., 2013, ApJ, 771, 30
- Scannapieco et al. (2012) Scannapieco C., Wadepuhl M., Parry O. H., Navarro J. F., Jenkins A., Springel V., Teyssier R., Carlson E., Couchman H. M. P., Crain R. A., Dalla Vecchia C., Frenk C. S., et al. 2012, MNRAS, 423, 1726
- Scoville et al. (2007) Scoville N., Aussel H., Benson A., Blain A., Calzetti D., Capak P., Ellis R. S., El-Zant A., et al. 2007, ApJS, 172, 150
- Shankar et al. (2006) Shankar F., Lapi A., Salucci P., De Zotti G., Danese L., 2006, ApJ, 643, 14
- Sheth & Tormen (1999) Sheth R. K., Tormen G., 1999, MNRAS, 308, 119
- Spergel et al. (2003) Spergel D. N., Verde L., Peiris H. V., Komatsu E., et al. 2003, ApJS, 148, 175
- Springel & Hernquist (2003) Springel V., Hernquist L., 2003, MNRAS, 339, 289
- Springel et al. (2005) Springel V., White S. D. M., Jenkins A., Frenk C. S., Yoshida N., Gao L., Navarro J., Thacker R., Croton D., Helly J., Peacock J. A., Cole S., Thomas P., Couchman H., Evrard A., Colberg J., Pearce F., 2005, Nature, 435, 629
- Springel et al. (2001) Springel V., White S. D. M., Tormen G., Kauffmann G., 2001, MNRAS, 328, 726
- Tasitsiomi et al. (2004) Tasitsiomi A., Kravtsov A. V., Wechsler R. H., Primack J. R., 2004, ApJ, 614, 533
- Trujillo-Gomez et al. (2011) Trujillo-Gomez S., Klypin A., Primack J., Romanowsky A. J., 2011, ApJ, 742, 16
- Vale & Ostriker (2004) Vale A., Ostriker J. P., 2004, MNRAS, 353, 189
- van den Bosch et al. (2007) van den Bosch F. C., Yang X., Mo H. J., Weinmann S. M., Macciò A. V., More S., Cacciato M., Skibba R., Kang X., 2007, MNRAS, 376, 841
- Wake et al. (2011) Wake D. A., Whitaker K. E., Labbé I., van Dokkum P. G., Franx M., Quadri R., Brammer G., Kriek M., et al. 2011, ApJ, 728, 46
- Wang et al. (2006) Wang L., Li C., Kauffmann G., De Lucia G., 2006, MNRAS, 371, 537
- Watson & Conroy (2013) Watson D. F., Conroy C., 2013, ArXiv e-prints
- Wetzel et al. (2009) Wetzel A. R., Cohn J. D., White M., 2009, MNRAS, 395, 1376
- Wetzel et al. (2010) Wetzel A. R., White M., 2010, MNRAS, 403, 1072
- White & Frenk (1991) White S. D. M., Frenk C. S., 1991, ApJ, 379, 52
- White & Rees (1978) White S. D. M., Rees M. J., 1978, MNRAS, 183, 341
- Yang et al. (2012) Yang X., Mo H. J., van den Bosch F. C., Zhang Y., Han J., 2012, ApJ, 752, 41