G306.3-0.9: A newly discovered young galactic supernova remnant
Abstract
We present X-ray and radio observations of the new Galactic supernova remnant (SNR) G306.3-0.9, recently discovered by Swift. Chandra imaging reveals a complex morphology, dominated by a bright shock. The X-ray spectrum is broadly consistent with a young SNR in the Sedov phase, implying an age of 2500 yr for a distance of 8 kpc, plausibly identifying this as one of the 20 youngest Galactic SNRs. Australia Telescope Compact Array (ATCA) imaging reveals a prominent ridge of radio emission that correlates with the X-ray emission. We find a flux density of 160 mJy at 1 GHz, which is the lowest radio flux recorded for a Galactic SNR to date. The remnant is also detected at 24m, indicating the presence of irradiated warm dust. The data reveal no compelling evidence for the presence of a compact stellar remnant.
Subject headings:
Supernova remnants: G306.3-0.91. Introduction
Supernovae play a critical role in the life cycle of the Universe. They enrich the interstellar medium (ISM) with metals and affect the process of star formation in galaxies. Supernova remnants (SNRs) are the aftermath of these events and provide a means to constrain the physics of the explosion, e.g., whether it is the result of a Type Ia (e.g., Hillebrandt & Niemeyer 2000) or a core-collapse supernova (CCSN) (e.g., Janka 2012).
There are currently 309 cataloged SNRs in the Milky Way (Ferrand & Safi-Harb, 2012), out of an expected population of (Li et al., 1991). G1.9+0.3 is youngest with an age of only (Reynolds et al., 2008); however, only 20/309 have ages measured to be less than 2 kyr (Green, 2009; Ferrand & Safi-Harb, 2012). The discovery of new young SNRs is of critical importance if we are to gain further insight into SN explosions and stellar feedback into host galaxies. X-ray observations can reveal crucial dynamical and abundance information related to the remnant. To date, only 50% of the Galactic SNRs have been detected at X-ray wavelengths (Ferrand & Safi-Harb 2012; for a review of the X-ray properties of SNRs, see Vink 2012).
2. Observations
2.1. X-ray: Swift discovery & Chandra follow-up
The Swift Galactic Plane Survey is tiling 240 square degrees of the Galactic plane, from and through a series of 500s exposures including simultaneous imaging at X-ray (0.5 – 10 keV) and ultraviolet (2000 – 2500 Å) wavelengths. As part of the survey, the field centered at l,b = (306.25°, -0.81°) was observed on 2011 February 22. No source is visible in the UV, but the X-ray image revealed the presence of an extended source, with a SNR-like morphology. Extraction of a spectrum revealed the source to be hard, lying behind a substantial Galactic column () and suggested the presence of atomic lines. Inspection of archival data revealed an extended counterpart at mid-IR (MIPSGAL: 24 m, Carey et al. 2009) and radio wavelengths (Molonglo Galactic Plane Survey – MGPS-2: 843 MHz, Murphy et al. 2007). Based on the observed properties and the similarity of this newly discovered source to the LMC SNR N132D (Borkowski et al., 2007), we were awarded a 5 ks Chandra director’s discretionary time exposure (Obsid: 13419, PI: Miller). The observation took place on 2011 June 2, with the new source placed at the ACIS-S3 aimpoint. Preliminary properties of this remnant were reported by Miller et al. (2011).
2.2. Radio: ATCA
A radio counterpart to the extended source is present in the MGPS-2 survey, Murphy et al. 2007), with a measured flux density at 843 MHz of 17438 mJy. Follow-up radio observations were obtained at the Australia Telescope Compact Array (ATCA) using the 750C (2011 October 31) and EW352 (2012 March 2) array configurations for 12 hours each, with simultaneous dual-frequency measurements over a 2 GHz bandwidth centered at each of 5.5 GHz and 9 GHz in 33 channels of 64 MHz, with beamwidths of (25.8″23.2″) and (14.7″13.9″) respectively. Fluxes and bandpasses were calibrated using two 10-minute scans of PKS B1934-638 during each 12-hour block, while the calibration of phases and polarization leakages was achieved via 2-minute scans of PKS B1352-63 at 15 minute intervals throughout the observations. Data were reduced in the standard manner using the MIRIAD software package (Sault et al., 1995), resulting in images at 5.5 GHz and 9 GHz with RMS sensitivities of and respectively.
3. Basic properties
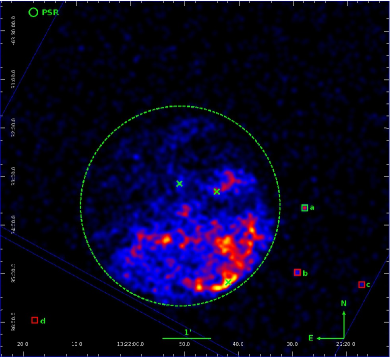
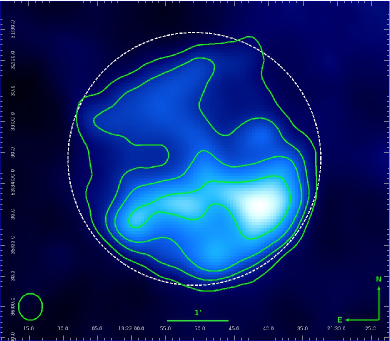
In Fig 1, we display the resulting Chandra exposure. The image has been smoothed by a Gaussian with . Characterizing the source with a circle (), we measure the following coordinates for the center of the remnant = 13:21:50.9, = -63:33:50 or l,b = (306.31°, -0.89°), thus we designate the newly discovered SNR as G306.3-0.9. The image reveals substantial sub-structure interior to the remnant with a brightening towards the SW edge suggestive of a typical SNR shock, while the NE of the remnant is almost devoid of emission. In Fig. 2, we plot the 5.5 GHz ATCA image. Both the 5.5 GHz and 9 GHz images show clumpy filaments extending across the face of the remnant. The brightest radio emission is located at the western end of this filament. Along the northern rim the emission is moderately enhanced, and a fainter streak running north-south appears to connect the rim to the central filament.
3.1. Point sources
The Chandra image was searched for point source emission with wavdetect. Five confirmed point sources are detected external to the remnant, as indicated by the squares in Fig. 1. Source (e) is not plotted in as it lies to SW. The detected sources with their associated detection significance are: (a) , = 13:21:27.8, = -63:33:38:9; (b) , = 13:21:29.2, = -63:34:58.4; (c) , = 13:21:17.1, = -63:35:13.6; (d) , = 13:22:17.8, = -63:35:57.4; (e) , = 13:20:23.9, = -63:35:39.4, where all source positions are accurate to better than 0.5. A single source is detected in the remnant interior with a S/N greater than 3; however, this source lies in the bright shock like region to the south.
In order to confirm the robustness of this source detection given the presence of a large background, the edser sub-pixel resolution algorithm (Li et al., 2004) as implemented in ciao v4.4 was utilized to search for point-like emission interior to the remnant. Three candidate point-like sources are present. These candidate sources are indicated by crosses in Fig. 1, where the coordinates are, proceeding in a clockwise direction from the NE source: (i1) = 13:21:50.9, = -63:33:08.8, (i2) = 13:21:44.1, = -63:33:18.8, (i3) = 13:21:41.9, = -63:35:11.0. However, we emphasise that it is not possible to characterize these ‘sources’ in the current image due to the modest exposure, for example, we note that (i2) & (i3) lie in bright knots of X-ray emission and as such may be due to a stochastic clump in the current exposure or a bright point of the shock. In contrast, while (i1), in the center of the SNR, lies in a more isolated region, the relative background remains high.
A known pulsar lies to the NE of the remnant, PSR J1322-6329 (Kramer et al., 2003) indicated by the circle in Fig. 1. This lay outside the ACIS-S FoV during the Chandra observation. Four of the identified sources display an excess of soft counts (i.e., ), whereas only a single source is hard, i.e., source (a) with no counts detected below 1.5 keV. Based on the column density of the SNR itself (), this source alone could plausibly be associated with G306.3-0.9.
3.2. X-ray spectroscopy
The SNR X-ray spectrum was extracted from the Chandra event list using the specextract task in ciao v4.4, assuming a 110 radius aperture and a comparable background region from a neighbouring source free region of the ACIS-S3 chip. The resulting spectrum was binned to 10 counts per bin. All spectral analysis takes place within xspec 12.7.0u111http://heasarc.gsfc.nasa.gov/xanadu/xspec/, where we make use of atomdb v2.02 (Foster et al., 2012)222http://www.atomdb.org.
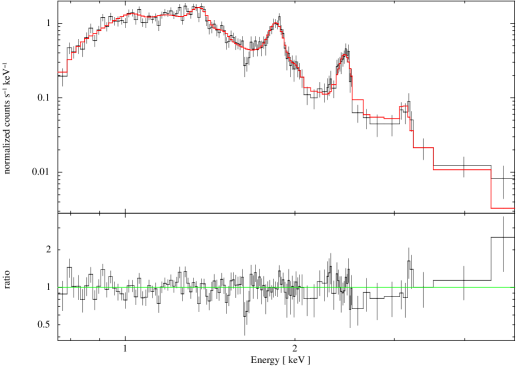
In Fig. 3, we display the integrated X-ray spectrum of G306.3-0.9 in the 0.75–5 keV band. A number of prominent atomic K-shell lines are immediately apparent, e.g., Si, S, Ar. An absorption-like feature is also present in the spectrum with an energy of 1.63 keV. The origin of this feature was investigated by attempting to fit it with a Gaussian whereupon the line width is found to be less than the spectral resolution provided by the ACIS-S detector. Thus, we classify this feature as having an unidentified instrumental/calibration origin.
First, the emission from the SNR is modelled as a collisionally ionized diffuse gas attenuated by interstellar absorption, i.e., pha*apec, resulting in a poor fit (). As a next step, we fit the spectrum with a non-equilibrium ionization model (pha*vnei, Borkowski et al. 2001), the fit is found to be significantly improved (, ). As the SNR is limb-brightened and shows evidence for non-ionization equilibrium plasma, we now model it assuming it is in the Sedov phase (pha*vsedov, Sedov 1959; Hamilton et al. 1983; Borkowski et al. 2001). The best fit is consistent with the vnei model above, i.e., (, ; see Table 1)333 is poorly constrained due to the lack of high energy data, i.e., for (Borkowski et al., 2001).. For completeness, we also model the data with a plane parallel shock model (pha*vpshock, see Table 1). The ionization timescale returned by all 3 models suggest that the plasma is approaching ionization equilibrium.
The distance to G306.3-0.9 is unknown. The column density measured from the X-ray spectrum, , is larger than the Galactic value of (Kalberla et al., 2005) and would suggest a distance . Assuming the remnant to lie at a fiducial distance of the Galactic center, i.e., , the radius of the remnant (r = 110″) is . Hence, using the parameters of the Sedov model, we calculate the following properties444assuming cosmic abundances and the strong shock jump condition, i.e., (shock velocity, age, explosion energy, density, swept-up mass) for G306.3-0.9:
The best fit model is consistent with a number of the atomic elements having super-solar abundances, i.e., , , , whereas Si, Ne, Mg are consistent with solar abundances (see Table 1).
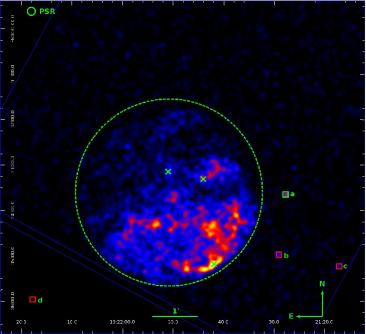
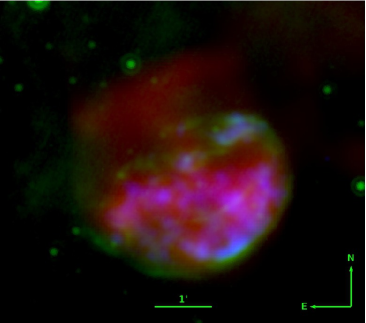
In Fig. 4, we plot a spectrally resolved image of G306.3-0.9. The image is composed of the counts in the regions around iron L & neon (0.8 – 1.1 keV; red), silicon (1.7 – 2.0 keV; green), and sulfur (2.2 – 2.6 keV; blue). This image reveals apparent stratification, with the Fe/Ne concentrated in a ridge of emission towards the center of the remnant. This emission is also traced by the bright ridge detected at radio wavelengths by ATCA. Si & S are more isotropically distributed, but both elements also reveal a strong concentration in the bright SW shock.
We investigated the possibility of carrying out crude spatially resolved spectroscopy. Unfortunately, the current exposure does not contain enough counts to constrain the physical parameters of the remnant gas with statistically significant accuracy, e.g., the ridge running across the center of the remnant contains only 1500 counts. Fitting the simplest physical motivated models (pha*vnei, vpshock) results in parameters that overlap within the uncertainties. In addition, by dividing up the spectra, we introduce an additional uncertainty: the filling factor for each region. Nonetheless, the spectra are suggestive of spatial differences in the abundances that agree with an inspection of Fig. 4; however, we are unable to conclusively demonstrate that the density substantially varies between the SW shock and the ridge. Deeper X-ray observations are clearly required to investigate the spatially resolved properties of this remnant.
3.3. Radio spectroscopy
Integrated flux densities of and are measured in the ATCA observation. The spectral index () is . There is no evidence for variation of the spectral index across the remnant. The spectral index between 843 MHz and 5.5 GHz, obtained using the archival MGPS-2 image, is . These spectral indices are consistent within the errors and suggest a non-thermal origin for the radio emission, i.e., synchrotron radiation (Shklovskii, 1953). We calculate a flux at 1 GHz via interpolation and find . In comparison to the SNRs listed by Green (2009), G306.3-0.9 is the Galactic SNR with the lowest radio flux observed to date. However, the surface brightness is measured to be , comparable to the average surface brightness of the known Galactic SNRs (Green, 2009; Ferrand & Safi-Harb, 2012).
3.4. Multiwavelength properties
G306.3-0.9 is detected at mid-IR wavelengths by both Spitzer at 24m (Carey et al., 2009), and WISE at 22m (Wright et al., 2010). We concentrate on the Spitzer image due to its superior spatial resolution, though we note it to be consistent with that observed by WISE when convolved with a Gaussian to match the WISE 22m spatial resolution. The 24m flux peaks at a brightness of 19 MJy/sr in the bright SW shock front.
In Fig. 4, we plot a 3 colour image combining the 0.75 – 5 keV Chandra X-ray (blue), 24m Spitzer (green), and the 5 GHz ATCA (red) images. There is a clear spatial correlation between the emission at these wavelengths. The radio emission appears to fill the interior of the remnant. A strong spatial correlation between the 24m and X-ray data indicates the presence of warm dust irradiated by the shocked X-ray plasma, though there may also be a contribution from the SN ejecta. Similar spatial features are observed in 24m imaging of the bright LMC SNR N132D (Tappe et al., 2006).
There is no evidence for emission from the SNR at lower wavelengths in either Spitzer or WISE imaging. The second Fermi catalogue was also inspected and does not reveal a high energy counterpart to this remnant (Nolan et al., 2012).
| Model | kTe | kTs | S | Ar | Ca | Fe ( Ni) | norm | |||
|---|---|---|---|---|---|---|---|---|---|---|
| [ ] | [ keV ] | [ keV ] | [ ] | [ ] | [ ] | [ ] | [ ] | [ ] | ||
| vnei | – | 6.0 | 2.57 | 0.89 | 2.77 | |||||
| vpshock | – | 6.0 | 2.48 | 2.5 | 2.73 | |||||
| vsedov | 1.94 | 0.54 | 4.8 | 2.55 | 2.14 | 3.05 |
4. Discussion
We have discovered a new young Galactic SNR – G306.3-0.9 – as part of the Swift Galactic plane survey. The remnant is consistent with an age , assuming a distance of . The basic properties of the new SNR have been calculated assuming it to be in the Sedov phase. However, the measurement of enhanced abundances points to a contribution from SN ejecta to the observed emission. This would suggest the remnant has not fully entered the Sedov phase at the current time, i.e., . Hence, the true age of the remnant is likely less than the age calculated from the Sedov model, i.e., . We can place a lower limit on the age of the remnant by assuming it is still in the free expansion phase: .
The high density and ionization timescale point to a clumped plasma. Inspection of Fig. 1 & 4 would support this given the anisotropic plasma distribution, as would the density calculated via the emission measure. For example, a uniform sphere with radius of half that of G306.3-0.9 implies a density of only 1 cm-3 and an ionization age of , which is a factor of ten larger than the Sedov age. The current X-ray spectrum does not allow us to decompose the observed emission due to the presence of the forward and reverse shocks that are likely present. No evidence is found for a hard X-ray emission component in this short Chandra exposure, i.e., we can place a limit on the contribution of a power-law like component to the spectrum 1% of the unabsorbed flux in the 0.75 – 5 keV band.
The distance to G306.3-0.9 is highly uncertain. The measured interstellar Hydrogen column density suggests the remnant to be relatively distant, i.e., . The best fit Sedov model implies an age and explosion energy in the range 1 – 5 kyr and (0.06 – 1.7) respectively, for distances in the range 3 – 16 kpc. Such explosion energies are consistent with observations (e.g., Tanaka et al. 2009). The luminosity of G306.3-0.9 in the 0.75 – 5 keV band is , comparable to the X-ray luminosities of known samples of SNRs, e.g., Hughes et al. (1998); Long et al. (2010); Sasaki et al. (2012).
The remnant is strongly brightened to the southwest hemisphere suggesting interaction with an inhomogeneous medium or a highly asymmetric SN explosion. Herschel far-IR images (PACS: 160m; SPIRE: 250, 350, 500m; e.g., obsid: 1342189083) point to the presence of a significant over-density of dust to the north of the remnant, where the X-ray flux is at its lowest. The asymmetry present in G306.3-0.9 (see Fig. 1 & 4) could be due to interaction of the SN shock with this dust analogous to the SNR G109.1-1.0, e.g., Kothes et al. (2002).
4.1. Evidence for a compact object?
Neutron stars may receive a ‘kick’ at birth, which can result in large velocities in excess of (Lyne & Lorimer, 1994; Chatterjee et al., 2005). Assuming a kick velocity of and an age of 2.5 kyr, a putative NS could have traveled no more than 2.6 pc from the center of the remnant, i.e., the compact object would be within the boundary of the SNR at the current time (, see §3.2). This rules out any putative association of source (a) with the remnant.
Analysis of the interior remnant emission does not reveal any compelling evidence for a compact point source in the current Chandra image, as the large background makes characterization of the 3 candidate point sources difficult. The radio and IR data are consistent with this. Alternatively, we can assume the existence of a central compact object (CCO) analogous to that observed in Cas A (, Pavlov et al. 2000). The limiting flux of our Chandra exposure would imply that G306.3-0.9 lies 4–5x as distant as Cas A if such a CCO is present, i.e., .
4.2. Progenitor
The abundances in the X-ray spectrum can be used to constrain the progenitor explosion, e.g., enhanced O, Ne and/or Si would be expected from a CCSNe, whereas these elements should be less prominent in Type Ia explosions (Hughes et al., 1995; Vink, 2012). The current modest exposure does not allow us to investigate the Fe K region of the spectrum, while the large column density inhibits investigation of the energy range below 1 keV. The morphological and multi-wavelength similarities between G306.3-0.9 and the well known oxygen rich LMC remnant N132D, in addition to the large swept-up mass implied by the Sedov spectral fit would suggest a CCSN progenitor. However, the current X-ray spectrum is suggestive of a Type Ia explosion given absence of an enhanced Si abundance.
Thus far, only 309 Galactic SNRs have been identified out of a expected population of over 1000 (Li et al., 1991; Ferrand & Safi-Harb, 2012). This discrepancy is thought to be primarily due to a number of selection effects, e.g., see Green (2004). Previous searches have identified faint SNRs suggesting the presence of a large unidentified population, e.g., Brogan (2006). G306.3-0.9 had been previously detected in the MGPS-2 (Murphy et al., 2007); however, the spatial resolution was too low to reveal the true nature of this source. Although only 50% percent of the known population has been detected at X-ray energies, the discovery of this obscured SNR by Swift () suggests that there are a number of additional SNRs awaiting discovery in the Galactic plane (e.g., Reynolds et al. 2012), and that future observations at hard X-ray energies offer a promising means to discover them.
Planned deep X-ray observations will provide improved constraints on the progenitor of this remnant. In particular the spatial distribution of the atomic material (Fig. 4), the iron abundance, the presence of a hard component at energies in excess of 5 keV, and the existence of a compact stellar remnant.
References
- Asplund et al. (2009) Asplund M. et al., 2009, ARA&A, 47, 481
- Balucinska-Church & McCammon (1992) Balucinska-Church M., McCammon D., 1992, ApJ, 400, 699
- Borkowski et al. (2001) Borkowski K.J., Lyerly W.J., Reynolds S.P., 2001, ApJ, 548, 820
- Borkowski et al. (2007) Borkowski K.J. et al., 2007, ApJL, 671, L45
- Brogan (2006) Brogan C.L. et al., 2006, ApJ, 639, 25
- Carey et al. (2009) Carey S.J. et al., 2009, PASP, 121, 76
- Chatterjee et al. (2005) Chatterjee S., Vlemmings W.H.T., Brisken W.F., et al., 2005, ApJ, 630, L61
- Ferrand & Safi-Harb (2012) Ferrand G., Safi-Harb S., 2012, AdSpR, 49, 1313
- Foster et al. (2012) Foster A.R. et al., 2012, ApJ submitted. [arXiv:1207.0576]
- Green (2004) Green D.A., 2004, BASI, 32, 335
- Green (2009) Green D.A., 2009, BASI, 37, 45
- Hamilton et al. (1983) Hamilton A.J.S. et al., 1983, ApJS, 51, 115
- Hillebrandt & Niemeyer (2000) Hillebrandt W., Niemeyer J.C., 2000, ARA&A, 38, 191
- Hughes et al. (1995) Hughes J.P., Hayashi I., Helfand D., et al., 1995, ApJL, 444, L81
- Hughes et al. (1998) Hughes J.P., Hayashi I., Koyama K., 1998, ApJ, 505, 732
- Janka (2012) Janka H.T., 2012, ARNPS, in press. [arXiv:1206.2503]
- Kalberla et al. (2005) Kalberla P.M.W., Burton W.B., Hartmann D., et al., 2005, A&A, 440, 775
- Kothes et al. (2002) Kothes R. et al., 2002, ApJ, 576, 169
- Kramer et al. (2003) Kramer M. et al., 2003, MNRAS, 342, 1299
- Li et al. (1991) Li Z., Wheeler J.C., Bash F.N., Jefferys W.H., 1991, ApJ, 378, 93
- Li et al. (2004) Li J., Kastner J.H., Prigozhin G.Y. et al., 2004, ApJ, 610, 1204
- Long et al. (2010) Long K.S., Blair W.P., Winkler, P.F., et al., 2010, ApJS, 187, 495
- Lyne & Lorimer (1994) Lyne A.G., Lorimer D.R., 1994, Nature, 369, 127
- Miller et al. (2011) Miller, J.M. et al. 2011, ATel #3415
- Murphy et al. (2007) Murphy T. et al.., 2007, MNRAS, 382, 382
- Nolan et al. (2012) Nolan P.L. et al., 2012, ApJS, 199, 31
- Pavlov et al. (2000) Pavlov G.G., Zavlin V.E., Aschenbach B., Trümper J., Sanwal D., 2000, ApJL, 531, 53
- Reynolds et al. (2008) Reynolds S.P. et al., 2008, ApJL, 680, L41
- Reynolds et al. (2012) Reynolds M.T. et al., 2012, ATel #3963
- Sasaki et al. (2012) Sasaki M., Pietsch W., Haberl F., et al., 2012, A&A, 544, A144
- Sault et al. (1995) Sault, R., Teuben, P., & Wright, M. 1995, ASP Conf. Ser., 77, 433
- Sedov (1959) Sedov L.I., 1959, Similarity and Dimensional Methods in Mechanics, New York: Academic Press, 1959,
- Shklovskii (1953) Shklovskii I.S., 1953, Dokl. Akad. Nauk. SSSR, 91:475
- Tanaka et al. (2009) Tanaka M., Tominaga N., Nomoto K., et al., 2009, ApJ, 692, 1131
- Tappe et al. (2006) Tappe A., Rho J., Reach W.T., 2006, ApJ, 653, 267
- Vink (2012) Vink J., 2012, A&ARev, 20, 49
- Wright et al. (2010) Wright E.L. et al., 2010, AJ, 140, 1868