Pacman Percolation and the Glass Transition
Abstract
We investigate via Monte Carlo simulations the kinetically constrained Kob-Andersen lattice glass model showing that, contrary to current expectations, the relaxation process and the dynamical heterogeneities seems to be characterized by different time scales. Indeed, we found that the relaxation time is related to a reverse percolation transition, whereas the time of maximum heterogeneity is related to the spatial correlation between particles. This investigation leads to a geometrical interpretation of the relaxation processes and of the different observed time scales.
1 Introduction
The main challenge in the field of supercooled liquids is the understanding of the rapid increase of relaxation time and viscosity as temperature decreases [1, 2]. Experimental evidences and theoretical models predict the simultaneous emergence of Dynamical Heterogeneities (DHs) [3, 4], which play the role of critical fluctuation in ordinary critical phenomena. Indeed, these studies depict DHs as dynamically correlated clusters: by lowering the temperature, the size of such clusters grows and their cooperative rearrangement becomes more complicated. This results in a rapid increase of typical cluster life-time, which is in turn related to the structural relaxation time, at a macroscopic level. Being defined as the volume integral of a four-point correlation functon, , the dynamical susceptibility , estimates the volume of these clusters. Thus, is expected to grow as some power of the dynamical correlation length, , derived by ; in particular for compact clusters in dimensions, whereas a smaller exponent is expected if clusters have a fractal structure. The time , where reaches its maximum, , is also the time where correlations start to decrease, and thus it is interpreted as an estimate of the typical cluster life-time. Then, if DHs and relaxation are strictly related, is expected. However, there exist systems where is found to decrease on approaching the transition [6, 7, 5], as well as early studies suggesting that the time of maximal correlation between particles displacements does not scale with the relaxation time [8]. Accordingly, the relation between the dynamical susceptibility and the relaxation process remains elusive. Moreover, in order to unveil the precise relation between and one needs to know the explicit form of , which is not an easy experimental task.
Here we address this problem via a numerical study of the Kob–Anderson kinetically constrained lattice gas model [9] (KA-model), where it is possible to obtain very accurate data for the dynamical correlation length. After shortly reviewing the numerical model (Sec. 2), we illustrate the relaxation process (Sec. 3) and the DHs (Sec. 4). In Sec. 5 we show that the emergence of DHs is well described by the diffusing defect picture, which correctly predicts the exponents characterizing DHs. In Sec. 6 we explain the relaxation process in terms of ”pacman” percolation, a model originally introduced to explain degradation of a gel due to the action of enzymes [10]. This picture furnishes a geometrical interpretation of the relaxation process and of the different observed timescales. This paper is based on the elaboration of results previously published [11, 12, 13].
2 Model and simulation details
The KA-model [9] is a kinetically constrained model [14], which consists in a cubic lattice of volume containing particles. Periodic boundary conditions are imposed along the , and directions. The global density is the only control parameter and it plays the role of an inverse temperature. No interactions between particles are present apart from an hard-core repulsion, which prevents more than one particle to occupy the same lattice site: all microscopic configurations where the particles occupy among available sites are allowed, isoenergetic and equiprobable. Thus, the model is characterized by a trivial energy landscape, where no thermodynamic transition is available and time translational invariance holds. The system evolves following dyamical rules based on kinetic constraints: a continous time stochastic process allows a particle to move in a near empty site if has less than neighbors, and if it will also have less than neighbors after the move. Previous studies have shown that this model reproduces many aspects of glass forming systems: the dynamics slows down on increasing the density, suggesting the existence of a transition of structural arrest at [9, 15, 16, 17]. Nevertheless, it has been demonstrated that in the thermodynamic limit the transition of dynamical arrest only occurs at [18].
Our simulations of the KA-model span a set of density values ranging over up . We have investigated a wide range of system sizes from up to . Data reported in the following concern a system size , where we have performed the largest statistics: for each density values, the results are averaged on at least over up runs. The runs at higher density values last up Monte Carlo sweeps.
3 Structural Relaxation

Here we investigate the relaxation process focusing on the time evolution of the density of persistent particles , where is known as ’persistence’: if site is (is not) persistently occupied by a particle in the time interval [19]. is related to the high wave vector limit of the intermediate self scattering function [20] and describes the relaxation of the system in a very direct way: initially , but as time proceeds, particles eventually move from their original positions and decreases. This process is represented in Fig. 1 which shows the persistent particles in the system at different times of the same run.
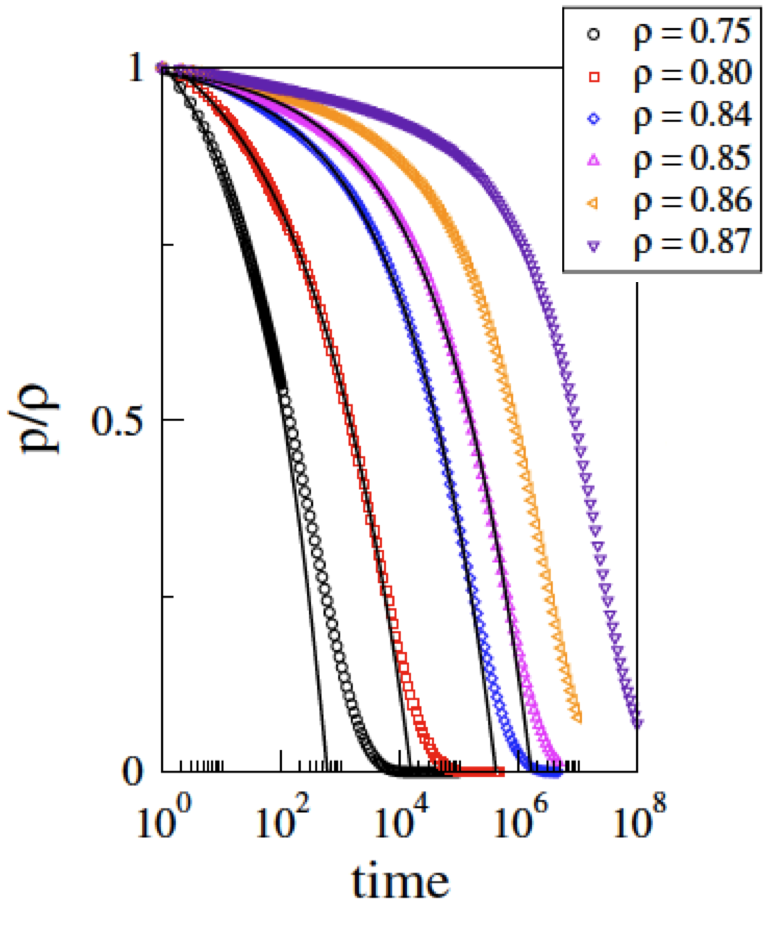
Accordingly, the normalized average value of such a correlation function, , represents the dynamic order parameter for relaxation. Fig. 2 shows that, in a large time window and for , is well described by the von Schweidler law:
4 Dynamical Heterogeneities
Fig. 1 show that as less and less persistent particles survives, spatial correlations between them emerge. These correlations are quantified by the dynamical susceptibility , related to the fluctuations of ,
| (2) |
and to the volume integral of the spatial correlation function between persistent particles at time ,
| (3) |
where
| (4) |
The spatial decay of defines the dynamical correlation length . In the following we describe the behaviour of , and .
4.1 Four-point correlation function
In Fig. 3a we show at different times as a function of . It clarifies that the spatial extension of the correlations grows until an intermediate time and then decreases at larger time. Its value at , , is determined by Eq. 4.
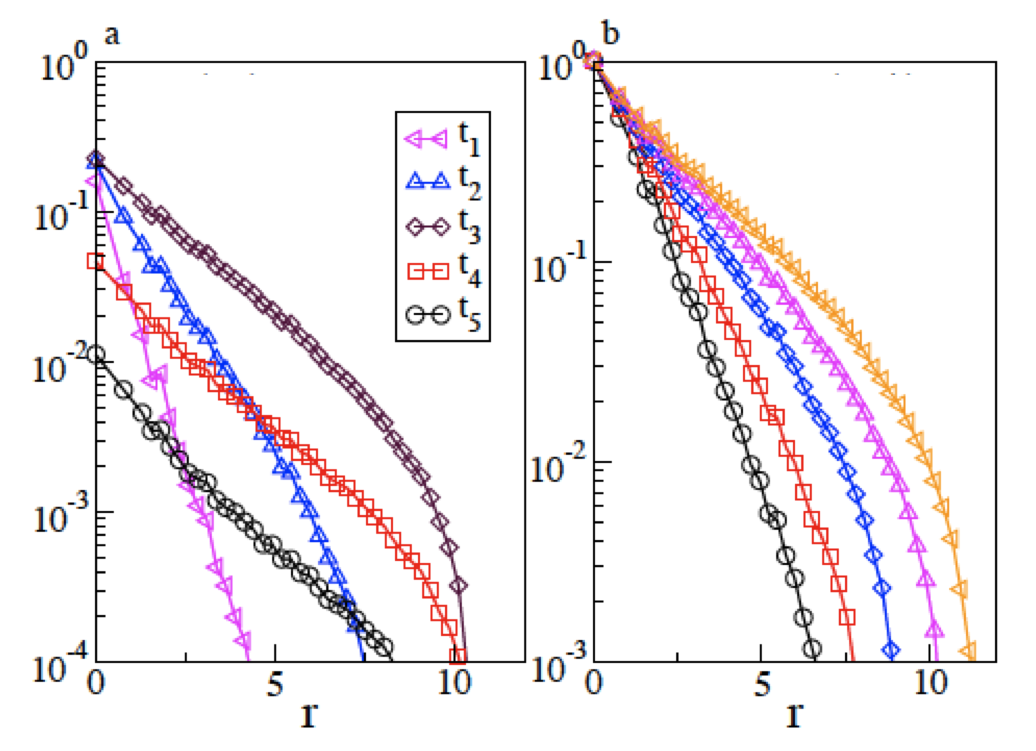
The behaviour of is consistent with a scaling form such as:
| (5) |
where is the dynamical correlation length (whose behaviour will be discussed in the next session) and is the amplitude.
Fig. 3b shows normalized by its value at as a function of , for different densities and at intermediate time (roughly of the order of ). As expected, becomes increasingly long ranged when the transition of structural arrest is approached.
4.2 Dynamical correlation length
From the data relative to , we have extracted the correlation length via an exponential fit of the initial decay. The behaviour of is illustrated in Fig. 4a for different values of the density, and is well described by
| (6) |
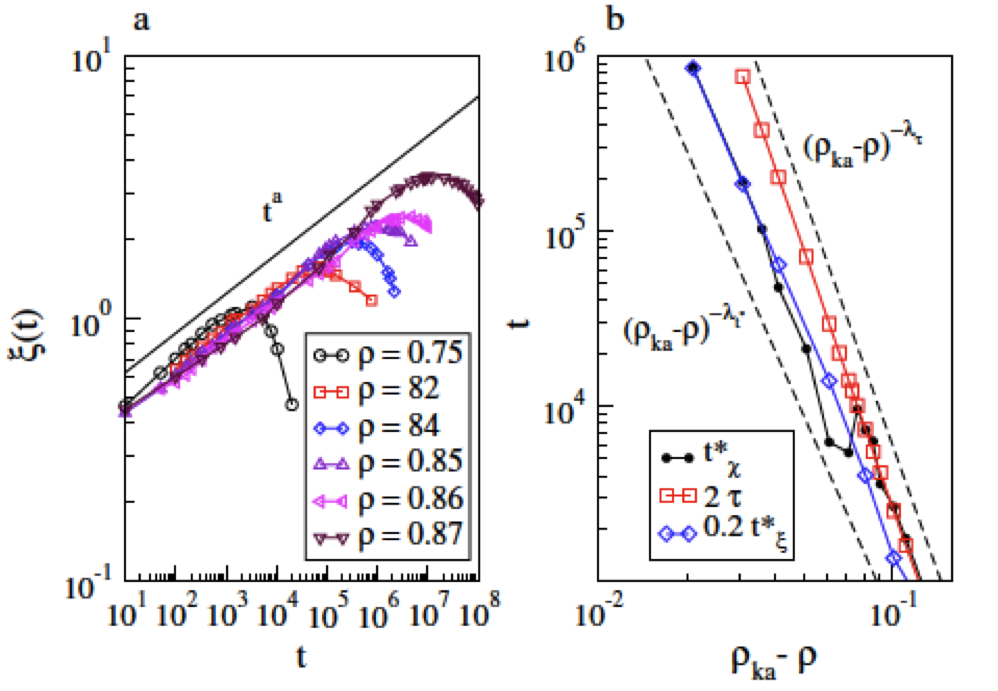
Accordingly, at short times grows as with , and then it decreases after reaching its maximum value at time . We find that the time diverges as , with .
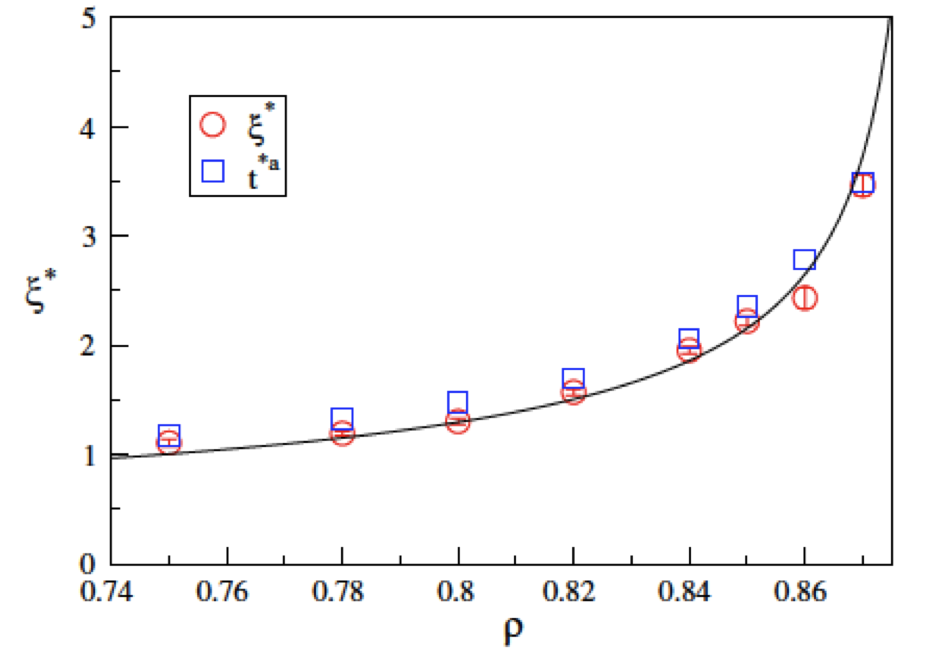
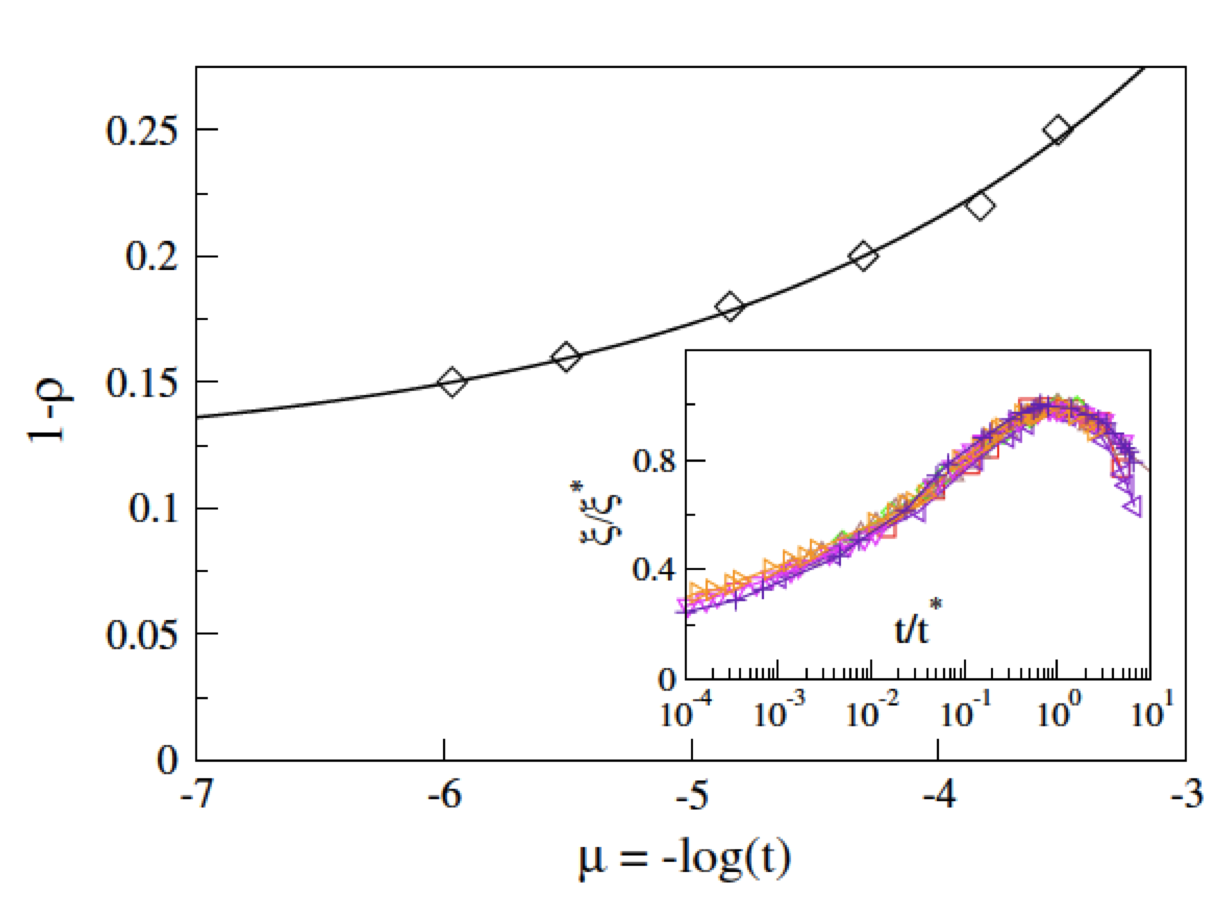
From this result and from Eq. 6 it follows that the maximum dynamic correlation length diverges as , with , in very good agreement with data (Fig. 5). Note here a very important result: contrary to what is expected, we find that and are not proportional but seems to diverge with different exponents, , approaching the transition of structural arrest. The presence of a growing correlation length suggests that the system is approaching a critical point as the density increases. This scenario is conveniently described interpreting as a chemical potential for the persistent particles, considering that the density of persistent particles monotonically decreases as time advances. The line where the correlation length reaches its maximum value in the – plane can therefore be interpreted as a Widom line, which in a second order transition ends at the critical point. The results of Fig. 6 suggest the presence of a critical point located at and , where the correlation length diverges. Actually, the Widom line will possibly bend, ending at where the transition is known to occur in the thermodynamic limit. Such an approach may open the way to a renormalization group treatment of the glass transition.
4.3 Dynamical Susceptibility
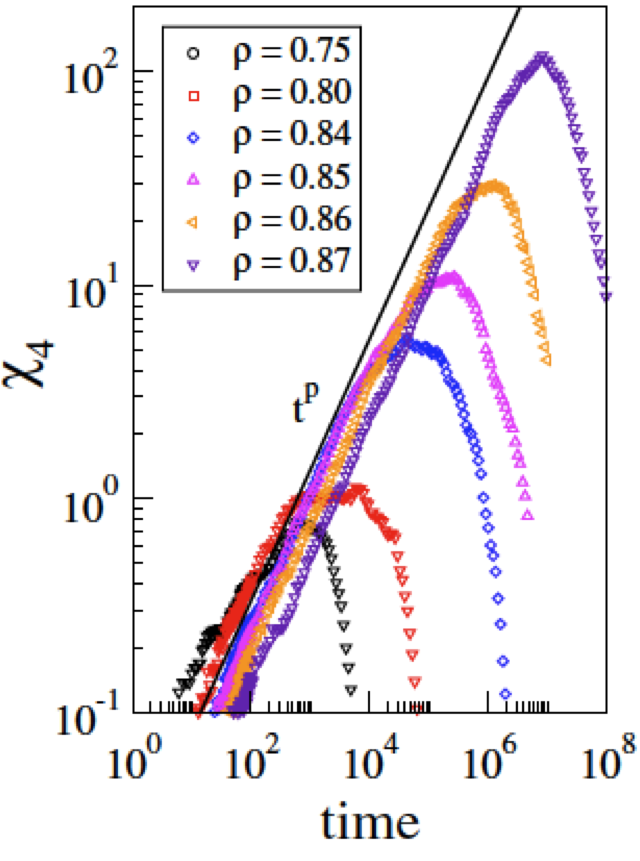
The emergence of an increasingly heterogeneous dynamics is clearly signaled by the dynamical susceptibility , shown in Fig. 7 for different values of the density. Qualitatively the behaviour of appears similar to the one observed for , initially growing as , with and then decreasing after reaching its maximum value at a time . The decoupling between and strongly influences and the time , leading to a complex behaviour. In facts, inspired by Eq. 3 and Eq. 5 we find that is well approximated by
| (7) |
where we have estimated and consistent with Ref. [21]. Accordingly, the behaviour of the susceptibility is essentially given by the product of two competitive factors, the amplitude and the correlation length. Indeed, at low densities , the amplitude dominates and Eq. 7 predicts . By contrast, at high density , and the maximum of the susceptibility occurs at . Such behavior of is apparent in Fig. 4: at intermediate density shows a clear crossover separating the two asymptotic regimes, where scales as in the limit of low-density and as in the limit of high density. Asimptotically, when , the maximum of the susceptibility scales as , with , in agreement with our results. Conversely, when , we have , with .
5 Diffusing defects
The results described so far are rationalized in the diffusing defects paradigm [3, 22, 23, 24], where the relaxation is ascribed to the presence of possibly extended diffusing defects, with density . The diffusing defects picture provides that at short times the correlation length grow as . The number of distinct sites visited by a defect increases as , where and are respectively the fractal dimension and the diffusion exponent characterizing the defect walk. Thus, the total number of distinct sites visited by the defects at time is proportional to . These assumptions are expected to hold at least at short times, i.e. before defects interact. Under this condition, each site visited by a defect corresponds to a particle which first moves from its original position. Thus, we expect that at short times the total number of distinct visited sites scales as the density of particles which have already relaxed at that time (the non-persitent particles), . From the decay observed for the density of persistent particles, we can infer . Therefore this picture reproduces the von Schweidler law, and relates the density of defects with the relaxation time [25], . By comparing the correlation length scaling provided by diffusing defect picture with the observed short time behaviour, (Fig. 5), we can conclude and . Then we find that defects have a sub–diffusive nature, although they conserve the same fractal dimension of usual random walkers. We suggests this may be ascribed to defects that behave as random walkers, although characterized by a fat–tail waiting time distribution and, possibly, by weak spatial correlations which slows down the diffusion. In fact, it has been proved that these factors do not affect the fractal dimensions of the walkers [26, 27]. Dealing with the susceptibility, the diffusing defect picture predicts that at short times, , which compared with our result allows to correctly estimate .
6 Reverse percolation
Looking for a geometrical interpretation of the relaxation process, we were inspired by the analogy with chemical gels. The mechanical rigidity of chemical gels, in fact, arises from a percolating network of polymers which acts as a backbone in a liquid media. Since the bond of such network are of a chemical nature, relaxation cannot spontaneously occur and the system is solid at any time-scale. However relaxation may be induced by external factors, such as diffusing enzymes able to cut the bonds they meet [10, 28]: in this case, the system stays solid until the network survives, but it relaxes and becomes liquid at larger time-scales, when the network disappears. Similar features have been also found for the stress-bearing network of contact forces in jammed granular materials [29, 30, 31]. In the present case the glass former may be though as rigid on time-scales smaller than the relaxation time, . We suppose that during this time a percolating cluster of persistent particles plays the role of the physical backbone in gels; here the bonds are of a dynamical kind, i.e. we consider that two particles and are bonded in the interval if they are nearest neighbours and persistent in this time interval. Defects, instead, play the role of enzymes and progressively destroy the cluster. A reverse dynamical percolation transition is expected for time-scales of the order of the relaxation time. In fact, as the absence of the percolating cluster leads to the loss of rigidity, we expect that this transition is related to the relaxation process.
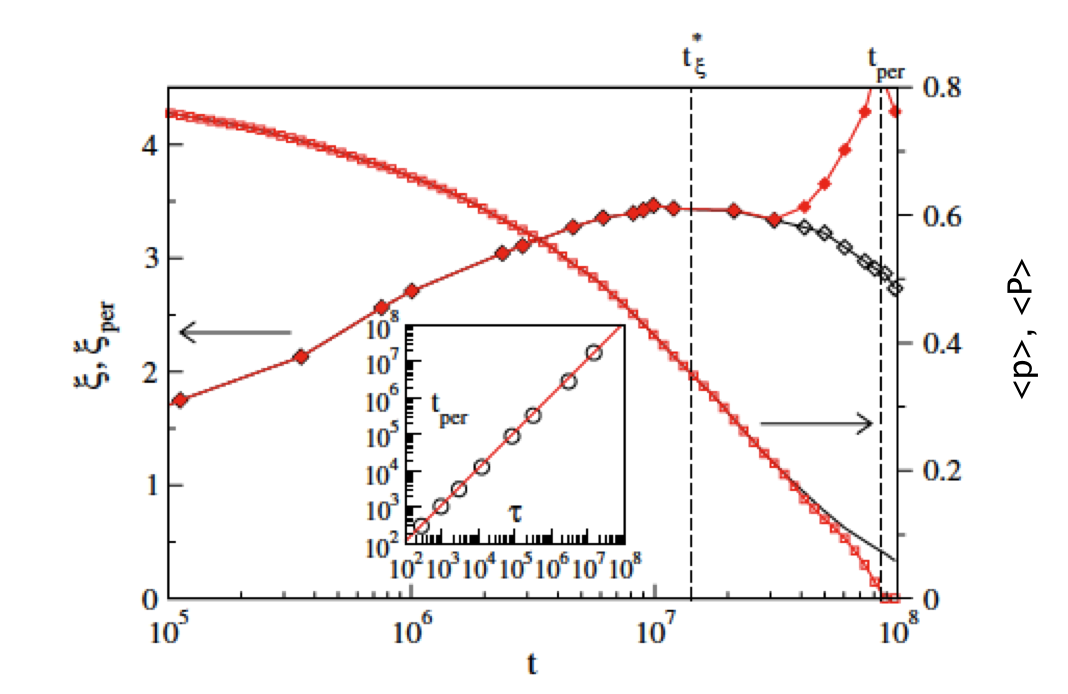
Data shown in Fig. 8 confirm our hipotesys. For density, beyond the onset of glassy dinamics, a cluster of persistent particles always spans the system at short times. We indicate with its strength, i.e. the density of persistent particles belonging to such cluster. vanishes at a time which is found to scale with the relaxation times, , as the density increases (Fig. 8, inset).
The figure also reveals that the cluster strength overlaps with the total density of persistent particles, , up to large times. This means that in this interval the percolating cluster is the only cluster present. At larger time slowly decays, while vanishes. This is due to the onset of finite clusters with a broad size distribution, that give contributions to , but not to . This circumstance may explain the crossover observed for the dynamic correlation function (see Fig. 2): at short time, the decay of is characterized by a single relaxation time, which is the life-time of the percolating cluster, and this leads to the von Schweidler law (Eq. 1). By contrast, the broad spectra of finite cluster life-time determine the stretched exponential decay at large times.
To better understand the geometrical properties of this process, we investigate the correlation length, , which is defined by the percolative correlation function :
| (8) |
where the pair-connected correlation function is limited to the pairs of particles that belong to the same dynamical cluster. can be also expressed as where and are the probabilities that two sites and belong to the same finite cluster, or to the percolating cluster respectively. Accordingly, if the percolating cluster is absent and measures the typical size of finite clusters. Conversely, if finite clusters are negligible, then
| (9) |
measures the extension of the density fluctuations within the percolating cluster. In our case, at short time, and , because almost all persistent particles belong to the percolating cluster, making the connectedness condition negligible [32]. Inserting these equalities in Eq. 9 and comparing it with the definiton of the four point correlation function, (see Eq. 4), we find that , and consequently . Indeed, Fig. 8 confirms that the dynamical correlation length coincides with the percolative length, as long as finite clusters are negligible. The percolative length is affected by the two timescales characterizing the glassy dynamics, the time where the dynamical length reaches its maximum value, and the percolating time related to the relaxation of the system. At high densities, this makes non monotonic, as in Fig. 8.
7 Conclusion
We have shown that in the KA model relaxation process and DHs are characterized by two different timescales and , which implies that they are less tangled than expected. We explain this feature in the diffusing defect picture, where we relate the relaxation process to a reverse percolation transition, obtaining a geometrical interpretation of the different time-scales. Accordingly, to their definitions, occurs when a given large fraction of all sites has relaxed, while occurs when the correlations between the persistent particles decreases. Indeed, nothing forbids the correlations to decrease before a large fraction of all sites has relaxed, . However, in models of defects behaving as random walkers, one finds that [3]. Therefore, one may speculate that, in our case, the decoupling between the two time-scales is due to a complex nature of defects. For instance, they may be non-conservative and characterized by birth and death rate with a constant average number, or they may not diffuse as random walkers.
References
- [1] C. A. Angell, Formation of glasses from liquids and biopolymers, Science 267 (1995) 1924. M. D. Ediger, C. A. Angell and S. R. Nagel, Supercooled liquids and glasses, J. Phys. Chem. 100 (1996) 13200. P. G. Debenedetti and F. H. Stillinger, Supercooled liquids and the glass transition, Nature 410 (2001) 259. G. Adam and J. H. Gibbs, On the temperature dependence of cooperative relaxation properties in glass-forming liquids, J. Chem. Phys. 43 (1965) 139.
- [2] R. Pastore, A. Coniglio and M. Pica Ciamarra, From cage-jump motion to macroscopic diffusion in supercooled liquids, arXiv: 1311.5350 (2013).
- [3] C. Toninelli, M. Wyart, L. Berthier, G. Biroli and J.-P. Bouchaud, Dynamical susceptibility of glass formers: Contrasting the predictions of theoretical scenarios, Phys. Rev. E 71 (2005) 041505.
- [4] M. D. Ediger, Spatially heterogeneous dynamics in supercooled liquids, Annu. Rev. Phys. Chem. 51 (2000) 99. M. M. Hurley and P. Harrowell, Kinetic structure of a two-dimensional liquid, Phys. Rev. E 52 (1995) 1694. S. Franz and G. Parisi, On non-linear susceptibility in supercooled liquids, J. Phys. Condens. Matter 12 (2000) 6335. C. Donati, S. Franz, G. Parisi, and S. C. Glotzer, Theory of non-linear susceptibility and correlation length in glasses and liquids, J. Non-Cryst. Solids 307 (2002) 215. E. Weeks, J. C. Crocker, A. C. Levitt, A. Schofield, and D. A.Weitz, Three-dimensional direct imaging of structural relaxation near the colloidal glass transition, Science 287 (2000) 627.
- [5] P. Ballesta, A. Duri and L. Cipelletti, Unexpected drop of dynamical heterogeneities in colloidal suspensions approaching the jamming transition, Nature Physics 4 (2008) 550.
- [6] S. C. Glotzer, V. N. Novikov and T. B. Schrøoder, Time-dependent, four-point density correlation function description of dynamical heterogeneity and decoupling in supercooled liquids, J. Chem. Phys. 112 (2000) 509.
- [7] A. Fierro, A. de Candia and A. Coniglio, Static and dynamic heterogeneities in a model for irreversible gelation, Phys. Rev. E 62 (2000) 7715.
- [8] S. C. Glotzer and C. Donati, Quantifying spatially heterogeneous dynamics in computer simulations of glass-forming liquids, J. Phys.: Condens. Matter 11 (1999) A285.
- [9] W. Kob and H. C. Andersen, Kinetic lattice-gas model of cage effects in high-density liquids and a test of mode-coupling theory of the ideal-glass transition, Phys. Rev. E 48, (1993) 4364.
- [10] T. Abete, A. de Candia, D. Lairez and A. Coniglio, Percolation model for enzyme gel degradation, Phys. Rev. Lett. 93 (2004) 228301.
- [11] R. Pastore, Jamming transition in thermal and non-thermal systems, Ph.D. Thesis (2011) .
- [12] R. Pastore, M. Pica Ciamarra, A. de Candia and A. Coniglio, Dynamical Correlation Length and Relaxation Processes in a Glass Former, Phys. Rev. Lett. 107 (2011) 065703.
- [13] A. Coniglio, A. de Candia, T. Abete, A. Fierro, M. Pica Ciamarra, E. Del Gado, and R. Pastore, in Complex Materials in Physics and Biology, eds. F. Mallamace and H. E. Stanley (IOS press, 2012), p. 55 .
- [14] F. Ritort and P. Sollich, Glassy dynamics of kinetically constrained models, Advances in Physics 52 (2003) 219, and references therein.
- [15] S. Franz, R. Mulet and G. Parisi, Kob-Andersen model: A nonstandard mechanism for the glassy transition, Phys. Rev. E 65 (2002) 021506.
- [16] A. Lawlor, D. Reagan, G.D. McCullagh, P. De Gregorio, P. Tartaglia, and K.A. Dawson, Universality in lattice models of dynamic arrest: Introduction of an order parameter, Phys. Rev. Lett. 89 (2002) 245503.
- [17] P. Chaudhuri, S. Sastry and W. Kob, Tracking Heterogeneous Dynamics During the Relaxation of a Simple Glass Former, Phys. Rev. Lett. 101 (2008) 190601.
- [18] C. Toninelli, G. Biroli, D. S. Fisher, Spatial structures and dynamics of kinetically constrained models of glasses, Phys. Rev. Lett. 92 (2004) 18.
- [19] does not explicitly shows the two-time structure typical of dynamic correlation functions. By contrast, it is even more than a two-time function, since it keeps trace of the whole history in the interval : indeed, it can be written as multi-point function, , where is the usual occupation number of site at time ( if site is (is not) occupied by any particle at time ).
- [20] D. Chandler, J. P. Garrahan, R. L. Jack, L. Maibaum and A. C. Panel, Lengthscale dependence of dynamic four-point susceptibilities in glass formers, Phys. Rev. E 74 (2006) 051501.
- [21] L. Berthier, G. Biroli, J. P. Bouchaud and R. L. Jack, in Dynamical heterogeneities in glasses, colloids, and granular media, eds. L. Berthier, G. Biroli, J. P. Bouchaud, L. Cipelletti and W. van Saarloos (Oxford University Press, 2011), p.68.
- [22] L. Berthier and G. Biroli, Theoretical perspective on the glass transition and amorphous materials, Rev. Mod. Phys. 83 (2011) 587.
- [23] J. T. Bendler and M. F. Shlesinger, Generalized Vogel law for glass-forming liquids, Journal of Statistical Physics 53 (1998) 531.
- [24] A. S. Keys, L. O. Hedges, J. P. Garrahan, S. C. Glotzer and D. Chandler, Excitations are localized and relaxation is hierarchical in glass-forming liquids, Phys. Rev. X 1 (2011) 021013.
- [25] We are assuming that the diffusion coefficient of defects varies slowly in the investigated range of density.
- [26] S. B. Yuste, J. Klafter, and K. Lindenberg, Number of distinct sites visited by a subdiffusive random walker, Phys. Rev. E 77 (2008) 032101.
- [27] A. Ordemann, G. Berkolaiko, S. Havlin, and A. Bunde, Swelling-collapse transition of self-attracting walks, Phys. Rev. E 61 (2000) R1005.
- [28] V. Sidoravicius and A. S. Sznitman, Percolation for the vacant set of random interlacements,Comm. Pure Appl. Math. 62 (2009) 831.
- [29] R. Pastore, M. Pica Ciamarra and A. Coniglio, ’Flow and Jam’ of frictional athermal systems under shear stress, Phil. Mag. 91 (2011) 2006.
- [30] M. Pica Ciamarra, R. Pastore, M. Nicodemi and A. Coniglio, Jamming phase diagram for frictional particles, Phys. Rev. E 84 (2011) 041308.
- [31] R. Pastore, M. Pica Ciamarra and A. Coniglio, Absence of ’fragility’ and mechanical response of jammed granular materials, Granular Matter 14 (2012) 253.
- [32] A. Coniglio and R. Figari, Droplet structure in Ising and Potts models, J. Phys. A: Math. Gen. 16 (1983) L535.