AGN and Starburst Radio Emission from Optically Selected QSOs
Abstract
We used the 1.4 GHz NVSS to study radio sources in two color-selected QSO samples: a volume-limited sample of 1313 QSOs defined by in the redshift range and a magnitude-limited sample of 2471 QSOs with and . About 10% were detected above the 2.4 mJy NVSS catalog limit and are powered primarily by AGNs. The space density of the low-redshift QSOs evolves as . In both redshift ranges the flux-density distributions and luminosity functions of QSOs stronger than 2.4 mJy are power laws, with no features to suggest more than one kind of radio source. Extrapolating the power laws to lower luminosities predicts the remaining QSOs should be extremely radio quiet, but they are not. Most were detected statistically on the NVSS images with median peak flux densities and in the low- and high-redshift samples, corresponding to spectral luminosities and 24.1, respectively. We suggest that the faint radio sources are powered by star formation at rates in the moderate luminosity (median ) low-redshift QSOs and in the very luminous () high-redshift QSOs. Such luminous starbursts [ and 12.6, respectively] are consistent with “quasar mode” accretion in which cold gas flows fuel both AGN and starburst.
Subject headings:
galaxies: active—galaxies: starburst—quasars: general—radio continuum: galaxies1. Introduction
The radio emission from quasi-stellar objects (QSOs) has puzzled astronomers for nearly 50 years. The first QSOs to be recognized contain very strong radio sources similar to those powered by the active galactic nuclei (AGNs) of the most luminous radio galaxies, but % of bright optically selected QSOs are fainter than 1 mJy at 1.4 GHz. Also, the flux-density distribution of radio-loud QSOs is quite different from that of radio galaxies, and might even be bimodal. These differences led to longstanding debates about whether QSOs experience the same cosmological evolution as radio galaxies and whether there are two distinct types of radio sources in QSOs. In this paper, we use direct detections of radio sources stronger than 2.4 mJy and statistical detections of fainter sources in two large samples of QSOs to argue that (1) radio-loud QSOs are similar to powerful radio galaxies and do evolve, despite their differing flux-density distributions, and (2) radio-quiet QSOs really are different from radio-loud QSOs because most of their radio emission is powered by starbursts instead of AGNs. Since the problem of radio emission from QSOs has such a long and complicated history, we begin with a short review to set the stage and define common terms.
1.1. Quasars, QSGs, and QSOs
Hazard et al. (1963), Schmidt (1963), and Matthews & Sandage (1963) found the first quasi-stellar radio sources (quasars or QSSs) by optically identifying redshifted “stars” with radio sources whose luminosities are “not markedly different from other known strong radio sources like Cygnus A or 3C 295” (Greenstein & Matthews, 1963) in elliptical galaxies. The first optically selected quasi-stellar galaxies (QSGs) found by Sandage (1965) “resemble the quasi-stellar radio sources in many optical properties, but they are radio quiet” in the sense that only about one QSG per thousand brighter than appeared in the relatively insensitive all-sky radio catalogs of the time ( Jy at 178 MHz). All of the first quasars and QSGs appear starlike because their AGNs are far more luminous than their inferred host galaxies, assuming their redshifts are cosmological. The deliberately vague name “quasi-stellar object” (QSO) still used today for both quasars and QSGs was introduced by Hoyle & Burbidge (1966) because they doubted the redshifts of the QSGs were cosmological and so “at this stage we do not think enough is known about their nature for a definitive name to be chosen.”
Although QSGs were called “a major new constituent of the universe” by Sandage (1965), they are not a distinct constituent, only the luminous tail of a continuous distribution that includes Seyfert galaxies whose AGNs do not overwhelm their starlight. Schmidt & Green (1983) formally distinguished them from Seyfert galaxies by requiring QSOs contain AGNs brighter than , the absolute magnitude of the brightest galaxies of stars calculated using and . In the modern flat CDM cosmology with and , the brightest galaxies have , so the spirit of the Schmidt & Green (1983) criterion (QSOs contain AGNs brighter than any host galaxy of stars) would change the QSO cutoff to . However, like most authors, we follow the letter () of the Schmidt & Green (1983) criterion. Thus our least-luminous QSOs are actually about twice as luminous as the brightest galaxies. The value of this cutoff matters because such luminous QSOs are rarely found in spiral galaxies (Dunlop et al., 2003).
1.2. QSOs Versus Radio Galaxies
The cumulative radio flux-density distribution of the strongest radio galaxies rises slightly faster than the Euclidean rate
| (1) |
where is the cumulative number of sources per steradian stronger than and is the differential number per steradian with flux densities to . If the same were true of bright QSOs and there is one radio-loud QSO stronger than 10 Jy among 1000 optically selected QSOs, one might hope to find 30 radio sources stronger than 1 Jy and hundreds above 0.1 Jy. From this perspective, the first directed searches for radio emission from optically selected QSOs were surprisingly unsuccessful (Kellermann & Pauliny-Toth, 1966). Radio sources were detected in only about 10% of bright QSOs even after decades of increasingly sensitive searches (Katgert et al., 1973; Strittmatter et al., 1980; Miller et al., 1990) for sources as faint as 0.01 Jy at , or at . These low detection rates imply that the flux-density distribution of optically selected QSOs rises much more slowly and may even be bimodal. They might also indicate that QSOs and radio galaxies do not experience the same amount of cosmological evolution (Miller et al., 1990).
1.3. Are There Two Distinct Populations of QSOs?
Strittmatter et al. (1980) were the first to report a bimodal QSO flux-density distribution, with an observed peak near and an inferred peak at , albeit in a very small sample. Miller et al. (1990) noted a bimodal luminosity distribution implied by the bimodal flux-density distribution of their larger sample of QSOs in the redshift range . They found nine radio sources with spectral luminosities , 96 upper limits below , and nothing in between. The term “bimodal” is perhaps too strong: a bimodal distribution has two peaks. Neither Strittmatter et al. (1980) or Miller et al. (1990) actually detected the low-luminosity peak; its existence was only inferred from the large number of nondetections whose radio flux densities or luminosities would have to be spread smoothly over many orders of magnitude to not yield a second peak. For a recent analysis of bimodality in light of modern optical and radio data, see Baloković et al. (2012).
A bimodal flux-density or luminosity distribution suggests there may be two distinct populations of radio sources in QSOs. For example, Miller et al. (1990) associated their high-luminosity peak with AGNs in elliptical galaxies similar to the hosts of radio galaxies and the inferred low-luminosity peak with weaker AGNs in spiral galaxies. However, any nonuniformity or feature in these distributions is sufficient to suggest two distinct populations. Bimodality is sufficient but not necessary, so we suggest that debates about whether a clearly visible feature in a distribution makes it truly bimodal are not relevant to the fundamental question “Are there two distinct populations of QSOs?”
1.4. Further Complications
Three factors have complicated investigations of QSO radio luminosity functions:
(1) The radio/optical luminosity ratio of QSOs might be a better measure of radio loudness than absolute radio luminosity alone. Schmidt (1970) proposed that the radio luminosity function “depends on the optical luminosity in such a manner that the ratio has a universal distribution function” of the form
| (2) |
Equation 2 implies a linear correlation between radio and optical luminosities, so the radio/optical ratio
| (3) |
may be a better indicator of radio activity. Peacock et al. (1986) countered that almost no radio-loud QSOs are optically fainter than (for and , equivalent to for today’s CDM model), so that an apparent correlation in the data may only reflect differences between two populations of QSO host galaxies, optically luminous ellipticals and optically fainter spirals. Using FIRST (Becker, White, & Helfand, 1995) direct and statistical detections of QSOs in a very large sample, White et al. (2007) found a clear but nonlinear correlation of radio and optical luminosities . However, Appendix C of Ivezić et al. (2002) argues that selection effects are responsible for such apparent correlations.
(2) Flux-density boosting in relativistic [] radio jets may significantly broaden both the radio flux-density and the distributions of QSOs, whose optical emission does not appear to be strongly beamed (Scheuer & Readhead, 1979). Thus radio jets in optically selected QSOs should be randomly oriented relative to our line-of-sight, but only the small fraction of QSOs whose jets are aligned near our line-of-sight become radio-loud quasars. The geometry of relativistic beaming tends to flatten the differential count of QSO radio sources from towards [or ] for intrinsically steep-spectrum () sources.
(3) Like the optical emission from a QSO, the radio emission is the sum of two known components, one powered by the AGN and the other by the host galaxy of stars. Massive stars born within the past years and relativistic electrons accelerated by their supernova remnants power the radio emission from the host galaxy, so a “red and dead” elliptical galaxy with no recent star formation can be extremely radio-quiet (Walsh et al., 1989). A number of features can be used to distinguish between these two types of radio source. The most powerful nearby starburst is in the ultraluminous infrared galaxy Arp 220, whose spectral luminosity is . Although the western nucleus of Arp 220 appears to contain an obscured AGN with X-ray luminosity (Rangwala et al., 2011), the compact radio component in the western nucleus accounts for less than 25% of the integrated 1.4 GHz radio flux density (Mundell, Ferruit, & Pedlar, 2001), so the Arp 220 starburst luminosity is not less than . A starburst-powered radio source is roughly coextensive with the starburst and is not brighter than K at 1.4 GHz, has the steep spectrum at centimeter wavelengths typical of optically thin synchrotron radiation, obeys the far-infrared (FIR)/radio correlation (Condon, 1992), and is not strongly variable. In contrast, an AGN can produce a radio source several orders of magnitude more luminous than , its radio jets and lobes can extend far outside the host galaxy of stars, and its radio core can be small enough to vary significantly on time scales of years (Barvainis et al., 2005). The radio spectrum of an AGN can be nearly flat () over a wide frequency range, either from a synchrotron self-absorption “conspiracy” among compact components (Cotton et al., 1980) or from optically thin free-free radiation by a hot AGN disk wind (Blundell & Kuncic, 2007). However, Steenbrugge et al. (2011) found that “for 20 out of 22 PG quasars studied, free-free emission from a wind emanating from the accretion disc cannot mutually explain the observed radio and X-ray luminosity,” eliminating free-free emission as the cause of the radio-quiet peak in the luminosity distribution of QSOs.
Nearly all low-redshift () radio galaxies seem to be “red and dead” ellipticals whose radio sources are powered primarily by their AGNs. By analogy, low-redshift QSOs whose radio sources are (1) more luminous than , (2) have lower FIR/radio flux-density ratios than starburst galaxies, (3) are either larger than or very compact (Falcke et al., 1996; Blundell & Beasley, 1998; Ulvestad et al., 2005), (4) are strongly variable (Barvainis et al., 2005) or (5) have flat radio spectra probably reside in elliptical galaxies. This analogy is supported by high-resolution HST images of nearby QSO host galaxies (Boyce et al., 1998; Dunlop et al., 2003). QSOs close to the original Schmidt & Green (1983) luminosity limit often obey the FIR/radio correlation, may contain starburst-dominated radio sources (e.g., Barvainis, 1990; Sopp & Alexander, 1991; Barthel, 2006; de Vries et al., 2007), and may be in disc or merging galaxies (Boyce et al., 1998). In contrast, Dunlop et al. (2003) found that QSOs having nuclear luminosities (assuming , or in modern CDM cosmology) are virtually all massive ellipticals with no large-scale star formation. Weak radio emission correlated with the strength of the 4000 Å break indicates that star formation is quite common in the host galaxies of low-luminosity AGNs (de Vries et al., 2007). We conclude that the radio properties of QSO samples are likely to depend on the absolute magnitude cutoff, and samples containing low-luminosity AGNs should not be used to infer the radio properties of true QSOs.
The 1.4 GHz flux density of an ultraluminous starburst galaxy like Arp 220 would be only at and at , so exceptionally sensitive observations are needed to characterize the starburst radio emission from individual QSO host galaxies. Kellermann et al. (1989) detected most of the low-redshift () Palomar Bright Quasar Survey (PBQS) QSOs at 5 GHz and found a bimodal spectral luminosity distribution (not function) peaking at and . The low-luminosity peak for QSOs spans the range with a median . Miller et al. (1993) used high-resolution radio images and [O III] spectra of the PBQS QSOs as evidence for a circumnuclear starburst contribution to the low-luminosity peak. Recent results from significantly more sensitive Karl G. Jansky Very Large Array (VLA) observations of 179 SDSS (Sloan Digital Sky Survey) QSOs in the redshift range found a low-luminosity peak (Kimball et al., 2011) centered on and at GHz. The radio sources contributing to this peak have a median spectral index consistent with starburst radio emission. Unfortunately their median flux densities are only mJy at 6 GHz and mJy at 1.4 GHz, so making follow-up observations will be difficult. The Kimball et al. (2011) radio luminosity function suggests that most radio sources with at 6 GHz (or at 1.4 GHz) in low-redshift QSOs are powered primarily by AGNs, not starbursts.
Kellermann et al. (1994) reobserved “radio quiet” QSOs and low-luminosity AGNs from their BQS sample (Kellermann et al., 1989) at 5 GHz with and resolution and resolved a number of compact cores and extended lobes similar to those in radio-loud quasars, suggesting that central engines exist in galaxies and quasars over a wide range of radio luminosity. They noted, however, that their resolved “radio quiet” QSOs had radio luminosities well in excess of that expected from the underlying galaxy.
Several high-resolution radio observations have demonstrated that most mJy-level radio sources in QSOs contain radio components so compact that they must be AGN-powered. Three flat-spectrum () “radio intermediate” (defined by at GHz) QSOs were found to have brightness temperatures K (Falcke et al., 1996), much too high for starburst radio emission. However, only one of them (PG 1309+355 at ) satisfies our criterion for a QSO, and its 5 GHz radio luminosity is an order of magnitude higher than the most luminous starburst yet found in a low-redshift QSO. Blundell & Beasley (1998) imaged 12 “radio-quiet quasars” with the VLBA and found strong evidence for jet-producing central engines in eight of them. However, four of the “quasars” are low-luminosity AGNs with (Mrk 335, III Zw 2, Mrk 705, and II Zw 171). Five of the eight true QSOs were detected by the VLBA, but all five have radio luminosities in the range high enough that we expect a significant AGN contribution. Ulvestad et al. (2005) considered a sample of 11 “radio-quiet quasars” having total 5 GHz flux densities of 4 mJy or greater. Three have no compact cores stronger than 1 mJy and were discarded from the sample. New VLBA images were made of five, one of which (UGC 09412) is a low-luminosity AGN. Two of the true quasars are in the Blundell & Beasley (1998) sample above. The remaining QSOs (J0804+6459 at and UM 275 at ) have radio luminosities and , respectively, and 5 GHz radio/optical flux ratios and 22, respectively, much higher than we expect for radio sources powered only by starbursts. We believe their conclusion “Thus, the most likely explanation for their radio properties is simply the radio-quiet quasars are similar to their ’traditional’ radio-loud cousins but have less powerful radio jets.” (Ulvestad et al., 2005) applies only to QSOs containing radio sources stronger than starbursts produce. We conclude that, unfortunately, VLB observations are simply not sensitive enough () to address the question of starburst radio emission in large samples of radio-quiet quasars.
Finally, Barvainis et al. (2005) compared radio variability in samples of radio-quiet (defined by having ), radio-intermediate, and radio-loud quasars. They found that radio variability is independent of radio loudness. Of the 11 “radio-quiet quasars” monitored, four are low-luminosity AGNs (Mrk 335, Mrk 1148, UGC 11763, and PGC 070504). Four of the seven true QSOs are variable radio sources and three are not. Among the variable QSOs, only PG 0052+251 at is sufficiently radio quiet ( and ) that a starburst might have contributed significantly to its radio emission. This single source is consistent with the 6 GHz radio luminosity functions shown in Figure 6 of Kimball et al. (2011), which suggests that about one in four QSO radio sources with should be AGN-dominated. We believe their conclusion “…the radio emission from radio-quiet quasars originates in a compact structure intimately associated with the active nucleus. The alternative hypothesis, that the emission from radio-weak quasars is from a starburst, is ruled out.” (Barvainis et al., 2005) has been justified only for radio sources stronger than and in QSOs, not for the weaker radio sources expected from starbursts.
1.5. Outline of This Paper
QSOs have such broad radio luminosity functions that their radio emission can be characterized only via large unbiased samples of radio-detected QSOs. Sensitive directed searches for radio emission from QSOs have been impeded by the small numbers of radio detections. A typical VLA observing program might target QSOs. Detecting statistically useful numbers of radio sources requires either a detection rate near 100% or a much larger QSO sample if the detection rate is low (e.g., if the detection rate is only %).
Furthermore, nearby QSOs in which starburst-powered radio sources can be detected individually have such a low sky surface density that a statistically useful sample can be obtained only from an optical survey covering more than a steradian with uniformly accurate multicolor photometry. The SDSS DR7 (Data Release 7) QSO sample (Schneider et al., 2010) covers sr at Galactic latitudes and satisfies that requirement. This paper is based on NRAO VLA Sky Survey (NVSS) (Condon et al., 1998) 1.4 GHz flux densities of (1) a volume-limited sample of 1313 DR7 QSOs with (Sec. 2) and (2) a magnitude-limited sample of 2471 DR7 QSOs in the redshift range (Sec. 3).
Above the NVSS catalog limit mJy beam-1, the detection rate in each sample is only about 10%, but the QSO samples are large enough to yield hundreds of NVSS detections. In addition, most of the remaining QSOs can be detected statistically on the NVSS images at levels mJy beam-1. The main result of the direct detections is that the differential luminosity function of strong radio sources powered by the AGNs in QSOs is an extremely flat power law, so flat that extrapolating to lower luminosities predicts essentially no statistical detections at the mJy level. Our high statistical detection rate implies a “bump” in the radio luminosity function of QSOs in the range to 24, depending on redshift. We attribute this bump to radio emission powered by luminous starbursts in the host galaxies of most bright QSOs (Sec. 5).
2. The Volume-limited QSO Sample
The SDSS DR7 QSO catalog (Schneider et al., 2010) is complete to over a solid angle around the North Galactic Pole. It contains the small sample of 179 color-selected QSOs defined by in the narrow redshift range studied by Kimball et al. (2011) and the larger sample of 1313 QSOs in the wider redshift range discussed here. Note that these magnitudes were calculated for an CDM cosmology, so our QSO cutoff corresponds to for comparison with Schmidt & Green (1983) and should discriminate against the low-luminosity QSOs that can appear in spiral galaxies (Dunlop et al., 2003). Both samples are strictly volume limited because any QSO with is brighter than . There are no more color-selected QSOs with to be found in that 21% of the sky, so no observation made at this time and place in the universe can reduce our statistical errors by more than about a factor of two—our sample variance is approaching the “cosmic variance” limit set by the finite observable volume of the universe (Kamionkowski & Loeb, 1997).
2.1. Sources in the NVSS Catalog
The entire DR7 area is covered by the NVSS, whose source catalog is complete for statistical purposes above a peak flux density at 1.4 GHz. In the redshift range the 45 arcsec FWHM (full width between half-maximum points) beam of the NVSS spans 150 to 250 kpc, more than enough to cover the host galaxy of stars and most of the extended radio emission powered by an AGN. Consequently the NVSS sees most QSOs as point sources and the NVSS integrated flux-density limit is . For radio sources with spectral index , the corresponding GHz (in the source frame) NVSS spectral-luminosity detection limits range from at to at . Thus most of these sources are too luminous to be powered primarily by starbursts.
To ensure completeness even for radio sources larger than the NVSS beam, we examined all NVSS catalog entries within 120 arcsec of each QSO. We rejected components centered more than a few arcsec from the optical position unless their morphologies in the NVSS and/or higher-resolution (5.4 arcsec FWHM) FIRST (Becker, White, & Helfand, 1995) images plausibly link them with the QSO. Unresolved or symmetric NVSS sources are easily identified with QSOs by radio-optical position coincidence alone, but asymmetric multicomponent sources can be difficult. For example, the left panel of Figure 1 shows two marginally resolved NVSS components whose centers straddle the optical position (cross) of SDSS J091205.16+543141.2. Two lobes and a core are clearly resolved in the FIRST image (right panel), confirming the otherwise uncertain NVSS identification. Because the NVSS has low resolution, it has high surface-brightness sensitivity. The two NVSS components contain essentially all of the QSO flux density, 23.8 mJy, while the three FIRST components add up to only 6.6 mJy. This example illustrates how the NVSS and FIRST complement each other for identifying extended radio sources and measuring their flux densities.
We also found that the FIRST peak flux densities of QSOs fainter than are usually close to the NVSS flux densities, and very few faint NVSS sources are not in the FIRST catalog. This indicates that most of the fainter radio sources produced by these QSOs have half-power linear sizes and the likelihood that the NVSS has resolved out any faint sources is small. Unfortunately, radio sources powered by starbursts and and by low-luminosity jets from AGNs are both consistent with this size limit; sub-arcsecond resolution is needed to distinguish between them (Condon et al., 1991). FIRST probably does not resolve out many sources in the range either, but we have not included the FIRST flux densities for these sources in our statistical analysis because they are systematically low by about 0.25 mJy owing to “snapshot” bias (White et al., 2007). Also the FIRST source count (White et al., 1997) indicates a rapid fall in differential completeness below mJy. Although the NVSS image noise is higher, the snapshot bias is lower, so we chose to study all sources fainter 2.4 mJy statistically via their amplitude distribution on NVSS images (see Section 2.5 for a complete discussion of snapshot bias in FIRST and NVSS) instead.
A number of stronger sources are clearly resolved by the NVSS, but most have brightnesses well above the NVSS catalog limit. Thus the NVSS integrated flux densities of radio-loud QSOs should be accurate and the NVSS should not have missed any radio-loud QSOs. There are 163 NVSS detections with (Table 1), of which only 37 are in the narrow redshift range that was also covered by our more sensitive directed VLA observations at 6 GHz (Kimball et al., 2011).


2.2. The 1.4 GHz Flux-density Distribution of QSOs Stronger Than 2.4 mJy
Let be the differential number of sources per steradian in the flux-density range to . Then the brightness-weighted count is proportional to the contribution of sources in each logarithmic flux-density range to the sky background temperature:
| (4) |
The brightness-weighted count of all extragalactic sources at 1.4 GHz (mostly radio galaxies) is shown by the upper curve in Figure 2. The lower curve in Figure 2 shows that (1) the 1.4 GHz flux-density distribution of the QSOs is a smooth power law above 2.4 mJy and (2) the QSO detection rate grows very slowly with improvements in sensitivity. In the flux-density range , the unbinned maximum-likelihood power-law fit (Crawford et al., 1970) to the brightness-weighted differential source count of these QSOs is ; that is,
| (5) |
where is much lower than the static Euclidean . The Kolmogorov-Smirnov (K-S) test for goodness of fit yields the probability that the source count is consistent with the power-law fit. There are no gaps or other features in this QSO flux-density distribution to suggest more than one source population above mJy, where we expect primarily AGN-dominated radio emission.

Because the flux-density range spanned by these QSOs is large, it is also useful to consider the number of radio sources in each logarithmic flux-density interval centered on . We define by
| (6) |
so that
| (7) |
For our QSOs, . The QSO counts are “flat” in the sense that is nearly independent of . In each successively lower decade of flux density, the expected number of radio detections rises by only %. This is quite different from the “steep” counts of radio galaxies or of all sources in a static Euclidean universe, where regardless of the luminosity function, and the number of radio detections should increase by about % per decade.
The brightness-weighted count of our QSOs clearly peaks at the highest flux densities (Figure 2). The strongest 12 radio sources (those with mJy) comprise only 1% of the 1313 QSOs but contribute more than half of the total radio flux density from the whole sample, even if all 1148 radio sources not in the NVSS catalog had flux densities equal to their mJy NVSS upper limits.
2.3. The 1.4 GHz Luminosity Function and its Evolution,
The 1.4 GHz spectral luminosity distribution of QSOs in our sample is shown in Figure 3 as a function of the comoving volume in between the redshift cutoff at and the redshift of each QSO. The QSO sample is strictly volume limited and the radio detections are complete above the NVSS limit indicated by the curved line. Consequently the plotted density of points above the curved line is proportional to the 1.4 GHz spectral luminosity function
| (8) |
where “magnitude” and is the comoving space density of sources in the spectral luminosity range and . The QSOs in Figure 3 have been grouped into three absolute-magnitude bins: (large filled symbols), (small filled symbols), and (open symbols).

Figure 3 shows that: (1) The 1.4 GHz spectral luminosity function has no statistically significant features (regions of significantly low or high density) in the sampled range at any redshift . (2) The radio and optical luminosities do not appear to be correlated. However, the radio luminosities span three decades, while only five of the 163 QSOs are brighter than , one decade brighter than the optical cutoff, so a linear correlation would be difficult to discern even if there were one. The fact that a linear correlation would be difficult to discern suggests that studying radio/optical ratios (Schmidt, 1970) instead of flux densities is not likely to yield new insights into low-redshift optically selected QSOs. We note that Mahony et al. (2012) also found no correlation of radio and optical luminosities in their sample of low-luminosity X-ray selected QSOs. (3) The plotted density of points increases to the right, indicating radio density evolution.
We calculated the 1.4 GHz spectral luminosity function of color-selected QSOs brighter than in the redshift range using the standard method. If there are sources in the logarithmic bin of width centered on spectral luminosity , then
| (9) |
where is the comoving volume in the sample solid angle between the minimum redshift and the maximum redshift at which the source could have been detected. The rms statistical uncertainty of is
| (10) |
The binned luminosity function of QSOs averaged over the redshift range is shown in Figure 4. The data points can be fit by the power law
| (11) |
in the luminosity range . The power-law slope
| (12) |
is close to the slope of , as suggested in Section 2.2. It is somewhat flatter than the luminosity function of UGC radio galaxies powered by AGNs (upper curve in Figure 4).

At higher luminosities, the luminosity function must fall below this flat power law; otherwise the spectral power density contributed by the most luminous sources would diverge. The amount by which the observed luminosity function falls below the power-law fit can be approximated by the (somewhat arbitrary, but simple and yielding a satisfactory fit to the limited data) quadratic form indicated by the lower continuous curve in Figure 4:
| (13) |
when . Finally, the total number of optically selected QSOs is finite ( over in the redshift range ), so the total number of radio sources predicted by the luminosity function should not exceed this number. Any extrapolation of the fitted luminosity function to lower luminosities (dotted line in Figure 4) must cut off below prevent the total number of radio sources from exceeding the number of QSOs.
The NVSS catalog should contain all sources with spectral luminosities throughout the redshift range . Low-redshift radio sources this strong are probably dominated by emission from AGNs, not starbursts. The evolution of their luminosity function with redshift may be characterized in terms of pure density evolution (shifting the luminosity function horizontally in Figure 4)
| (14) |
or pure luminosity evolution (shifting the luminosity function vertically in Figure 4)
| (15) |
where the functions and specify the amounts of density and luminosity evolution, respectively. For power-law density evolution , is needed to match the 1.4 GHz data in this portion of the redshift–luminosity plane, and the fit is satisfactory []. Thus the evolving 1.4 GHz luminosity function of QSOs in the redshift range is well approximated by replacing Equation 2.3 with
| (16) |
and leaving the cutoff Equation 2.3 unchanged.
Pure luminosity evolution of the form is indistinguishable from pure density evolution in the power-law portion of a luminosity function. However, the small power-law slope of the QSO luminosity function means that very strong luminosity evolution is needed to have the same effect as moderate density evolution: . The high-luminosity cutoff cannot evolve this rapidly because there are only two sources with , so pure luminosity evolution does not fit our radio data.
2.4. Why is the QSO Flux-density Distribution So Flat?
The flat flux-density distribution of radio sources in low-redshift optically selected QSOs does not prove that they are significantly different from the radio sources in nearby optically selected galaxies. The open circles in Figure 2 show the weighted count of AGN-dominated radio sources in low-redshift () UGC galaxies (Condon, Cotton, & Broderick, 2002); their power-law slope is almost the same. (Their sky density is also nearly the same, but that is just a coincidence that depends on the size of the UGC sample.)
Why do these optically selected QSO and galaxy samples have such flat 1.4 GHz flux-density distributions? Consider the flux-density distributions in two extreme cases: (1) In an infinite static Euclidean universe, the slope of would be , for any luminosity function. (2) If all of the sources in a sample were at exactly the same distance, the slope of would equal the slope of the luminosity function . For the more realistic case of a sample of sources spanning a finite redshift range to , the flux-density distribution will be the convolution of the luminosity function with a smoothing function whose width is roughly , the range of flux densities for a source of fixed luminosity as it is moved across the redshift range.
For both the SDSS QSO and UGC galaxy samples, the power-law portions of their 1.4 GHz luminosity functions (Figure 4) are much wider than for steep-spectrum QSOs confined to . About of the volume in containing the AGN-dominated UGC galaxies is in the narrow redshift range for which the smoothing width is only . In the small-smoothing limit, the power-law slope of naturally approaches the power-law slope of the differential luminosity function expressed as a source density per log radio luminosity. Thus the flat and nearly equal flux-density distributions of both the SDSS QSO and the AGN-dominated UGC galaxy samples are telling us only that both samples have relatively broad and flat radio luminosity functions. If the AGN-powered radio sources in both optically selected samples are intrinsically similar, we should expect our QSOs to have a distinctly sub-Euclidean flux-density distribution.
The observed is also consistent with relativistic beaming, which tries to make (Scheuer & Readhead, 1979). However, relativistic beaming of the modestly luminous {typical } NVSS radio sources in our low-redshift QSO sample is probably insufficient to influence the radio flux-density distribuion. In beaming models, the most luminous sources are the most highly beamed, so that most of their flux densities arise in highly relativistic (–10) components approaching within radians of our line of sight. Relativistic jets are compact and one-sided, but the most luminous sources in our sample are not. Table 1 lists 26 sources with (apparent) , but only seven have even half of their flux density unresolved by FIRST; the rest are too extended (linear diameter ) and centered on their optical QSO positions to be strongly boosted. The seven fairly compact sources contribute only 34% of the total apparent luminosity of the 26 luminous sources, so removing them would reduce the total luminosity of the sample by at most . What we see is what we get, and we can calculate reasonably accurate intrinsic luminosities and luminosity functions by assuming isotropic radio emission.
2.5. NVSS Statistical Detections: Numerous Faint Sources Powered by Star Formation?
To detect radio sources weaker than mJy, we originally measured NVSS peak flux densities at the positions of all color-selected QSOs in the narrow redshift band (Kimball et al., 2011). The NVSS image noise has a nearly Gaussian amplitude distribution with rms and zero mean (Condon et al., 1998). A starburst with luminosity obeying the FIR/radio correlation should produce a radio source with spectral index and spectral luminosity at GHz in the source frame. Such a source would yield an observed 1.4 GHz flux density ranging from at to at . The NVSS is not sensitive enought to detect such faint sources individually, but the distribution of peak flux densities on QSO positions can be used to detect a large () sample of them statistically.
White et al. (2007) discovered a potential problem with statistical detections: the nonlinear CLEAN bias associated with the high dirty-beam sidelobes of snapshot surveys like FIRST and NVSS can produce a “snapshot bias” that lowers the image peak flux densities of sources fainter than the catalog limit. The snapshot bias for a faint source is about 40% of the peak flux density on a FIRST image. To see if snapshot bias might affect the peak flux densities of faint QSOs on NVSS images, we followed their technique and measured NVSS peak flux densities on the positions of faint sources found in the sensitive () 1.4 GHz VLA image covering the Spitzer First-Look Survey (Condon et al., 2003). This image was made from data having very good -plane coverage, so its snapshot bias should be extremely low. The results of this comparison are listed in Table 2. They show that the NVSS snapshot bias is too small to measure over the flux-density range .
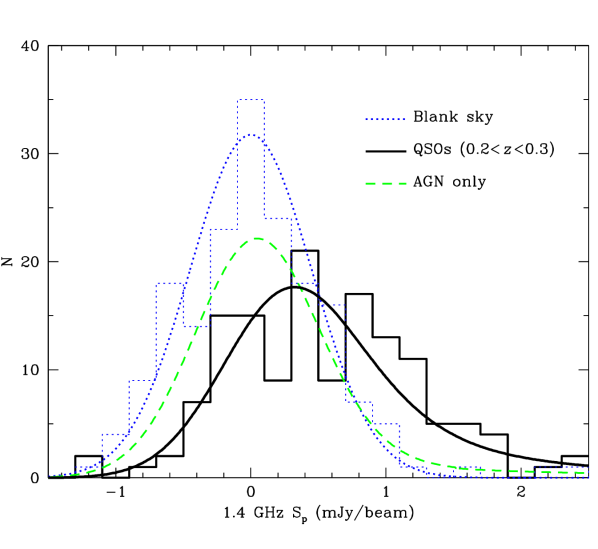
Figure 5 shows the distribution of NVSS peak flux densities at the optical positions of the 179 QSOs with (continuous histogram) and at the 179 “blank sky” positions exactly one degree north of the QSOs (dotted histogram). The blank-sky distribution is well fit by a Gaussian with mean and rms (dotted curve) consistent with NVSS image fluctuations. The whole distribution of peak flux densities on the QSO positions is clearly displaced from zero and has a long positive tail, indicating that the NVSS has detected most QSOs statistically at typical peak flux densities , which corresponds to an average spectral luminosity in this redshift range.
Our high detection rate is not consistent with a power-law extrapolation of the flat flux-density distribution of AGN-dominated QSOs, which would yield the dashed curve in Figure 2. The high detection rate of faint sources requires a peak or “bump” in the luminosity function near . This bump is confirmed by individual detections of nearly all of the QSOs at 6 GHz (Kimball et al., 2011).
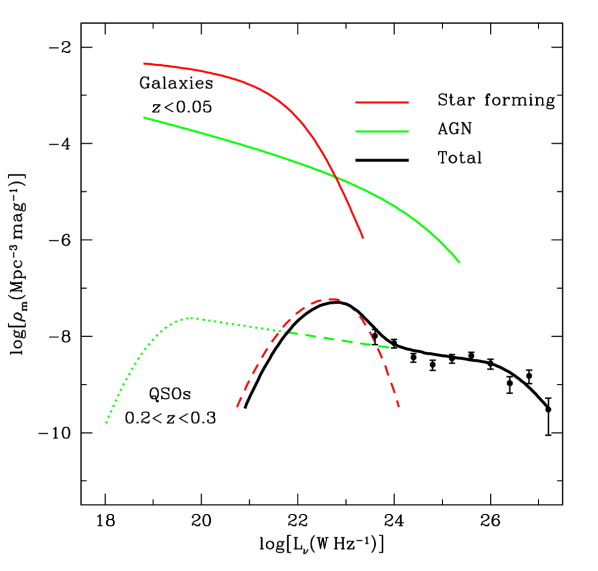
We hypothesize that the bump in the QSO luminosity function corresponds to the emergence of the host starburst galaxies as the dominant contributors to the radio emission. Figure 6 compares the 1.4 GHz luminosity functions of low-redshift () UGC galaxies (Condon, Cotton, & Broderick, 2002) whose radio emission is powered primarily by AGNs (continuous green curve) or by recent star formation (continuos red curve) with a simple model for the radio luminosity function of QSOs. The continuous black curves in Figures 5 and 6 correspond to our model luminosity function that fits both the NVSS detections and the distribution of nondetections. Our model assumes that the total radio emission of each QSO is the sum of statistically independent AGN- and starburst-powered components. The lower green curve in Figure 6 is similar to the extrapolated luminosity function of Figure 4, constrained by NVSS detections above , constrained statistically in the luminosity range (dashed green line), and at lower luminosities by requiring that the number of radio sources equal the number of QSOs (dotted green curve). The dashed red curve is the radio luminosity function of sources powered by recent star formation in the host galaxies needed to match the observed total luminosity function. The direct detections of faint sources reported in Kimball et al. (2011) match the dashed red curve very well. It suggests that most QSOs host starbursts whose luminosities are comparable with the more luminous starbursts in nearby galaxies. The typical star-formation rate can be estimated from the peak of the dashed red curve: corresponds to a star-formation rate (Condon, 1992).
2.6. Stacking
We note that measuring the full flux-density distribution of undetected QSOs is not the same as “stacking,” which collapses the distribution to a single statistic, the mean value of the peak flux density of the QSOs fainter than the catalog limit . The implicit assumptions needed to justify the use of stacking are (1) is a good statistic for describing the QSO flux-density distribution and (2) stacking divides the error in this mean by about . These assumptions fail if the flux-density distribution is a nearly flat power law, as we found for the cataloged NVSS QSOs. When is nearly independent of , then and is dominated by the small number of sources just fainter than , the fractional statistical uncertainty in is about , and depends more sensitively on the survey limit than on the intrinsic properties of the optically selected QSO sample.
Consider a QSO sample whose differential flux-density distribution is close to over a wide () flux-density range to . The value of is too low to measure; it is only inferred from the fraction of detected QSOs and the integral constraint that all QSOs must be stronger than . The average flux density of unresolved sources (so ) in a stack of images with is
| (17) |
If the fraction of individually detected sources is not close to unity, then and the numerator . The number of sources per logarithmic flux-density interval is constant between and when so
| (18) |
Using
| (19) |
yields
| (20) |
The stacking flux density depends almost linearly on the detection limit and only logarithmically on the intrinsic QSO flux-density distribution. For example, the NVSS detected of the DR7 QSOs with above mJy. If , then Equation 20 predicts , half of which is contributed by the small expected number of sources with .
White et al. (2007) made numerical simulations of stacking with Gaussian and exponential distributions and also concluded that the stack mean does not provide a very robust measurement. They studied the stack median as well, which should be better than the mean because it is less sensitive to the strongest sources. However, their simulations showed that the stack median recovered from exploiting low-SNR data (the usual reason for stacking) approaches the true mean, so they interpreted their stack medians as means.
Mahony et al. (2012) has independently noted several limitations of stacking.
We believe it is both safer and more sensitive to fit a model to the entire amplitude distribution (Figure 5) than to rely on any stacking statistic. In particular, if the whole distribution is shifted to positive flux densities, we can conclude that most of the QSOs are detectable radio sources.
2.7. Evolution of the Faint Radio Sources,
Encouraged by our statistical detection of 1.4 GHz emission at starburst luminosities from most of the 179 QSOs with and its confirmation by individual detections (Kimball et al., 2011), we measured NVSS peak flux densities at the positions of all 1313 QSOs with and divided them into five redshift bins (, , , , and ) to constrain the evolution of the hypothesized starburst radio emission over lookback times from 2.4 to 4.6 Gyr. The results are shown as histograms in Figure 7. The histogram of peak flux densities in 1313 “blank sky” positions one degree north of the QSOs is plotted in the top panel, and the matching smooth curve shows the Gaussian fit with mean and rms . The lower five panels contain the histograms of NVSS peak flux densities at the QSO positions, separated into redshift bins.

The NVSS detection rate in the QSO sample is only % above 2.4 mJy, so 88% of the 1313 QSOs have mJy beam-1 and models that match the numbers of sources in each redshift bin are constrained primarily by the numbers and hence density evolution of the optically selected QSOs. The radio data determine the flux-density distribution within each redshift bin and hence constrain the luminosity evolution of these low-luminosity radio sources.
As in Section 2.3, we describe the density evolution of the optically selected QSOs by . The best fit, shown by the smooth curves in Figure 7, is for . The best fit is poor [] because the numbers of optically selected QSOs in the redshift bins () and () are nearly equal but the comoving volumes (0.402 Gpc3 and 0.572 Gpc3, respectively) are not. These numbers favor slightly negative density evolution () in the redshift range. The positive value for the faint sources over the whole range is consistent with the value for the stronger (primarily AGN-powered) radio sources with .
If we model 1.4 GHz luminosity evolution of the fainter radio sources by the form , the best fit is consistent with no luminosity evolution: .
All of these results are actually consistent with each other and can be summarized as follows: The optically selected QSOs undergo strong density evolution over the reshift range . Both the weak and strong radio sources undergo a comparably strong density evolution with no detectable luminosity evolution. The likelihood of radio emission at any spectral luminosity from any particular QSO is independent of redshift in the range . Although the space density of optically selected QSOs evolves dramatically, the likelihood and strength of radio emission from each QSO appears to be independent of redshift.
3. The Magnitude-limited QSO sample
Many historical QSO samples favor the redshift range in which the Ly line is redshifted to the blue optical band. To test the statistical significance of the Miller et al. (1990) bimodal radio luminosity distribution of such high-redshift QSOs, we chose a magnitude-limited sample of all 2471 color-selected DR7 QSOs brighter than in that redshift range. These QSOs are all extremely luminous because our red magnitude limit corresponds to at and at .
The NVSS detected radio emission stronger than from only 191 (8%) of them (Table 3), consistent with the usual low detection rates at this sensitivity. The brightness-weighted 1.4 GHz flux-density distribution of the NVSS detections is shown by the points with error bars in the lower part of Figure 8. The power-law fit to their brightness-weighted differential source count is
| (21) |
in the flux-density range . Once again, the QSO counts are extremely flat in the sense that the number of sources per decade of flux density is nearly constant: . The strongest 13 of the 2471 QSOs (%) account for more than half of the total radio flux density from the high-redshift QSO sample.

Figure 9 shows the luminosity distribution of these QSOs as a function of the comoving volume beyond in . Our magnitude-limited high-redshift QSO sample is volume limited for those QSOs brighter than (filled points) above the line, where the plotted density of filled points is proportional to the evolving radio luminosity function. In the redshift range the density evolution of radio sources stronger than in high-redshift QSOs with is small or slightly negative, as expected: if , . The correlation of radio and optical luminosities is weak; if anything, the most luminous radio sources are under-represented among the optically most luminous QSOs (large filled points), many of which have radio luminosities near . As expected from the 1.4 GHz source count, the 1.4 GHz spectral luminosity function averaged over the redshift range is nearly flat (Figure 10) until it cuts off around , the highest radio luminosity found in this huge (77 Gpc3) comoving volume.


3.1. NVSS Statistical Detections: Faint Sources Powered Primarily by Star Formation?
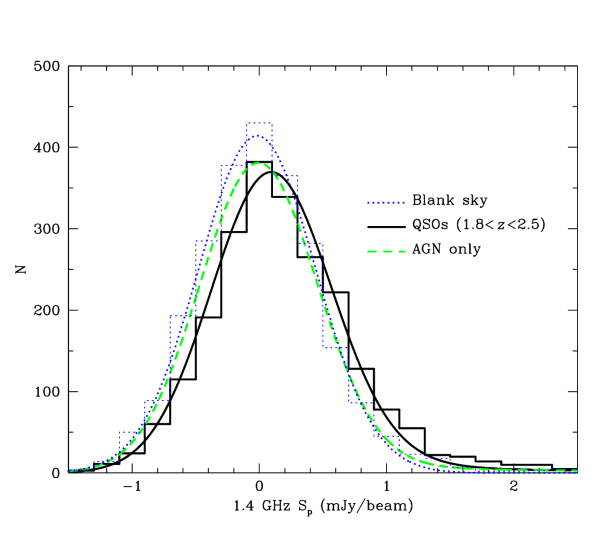
Using the technique described in Sec. 2.5, we obtained the NVSS peak flux densities at the positions of all 2471 high-redshift QSOs and at the 2471 “blank sky” positions offset by 1 deg of declination. Figure 11 shows the observed distributions of peak flux densities on the QSO positions (continuous histogram) and on the blank sky points (dotted histogram). The continuous histogram is clearly shifted to the right, indicating that most of the QSOs are weak radio emitters, and their median peak flux density is . The blank sky distribution is well approximated by a Gaussian (dotted curve) with mean and rms . Simply extrapolating the flat power-law flux-density distribution (Equation 21) of sources so luminous {} that they must be powered primarily by AGNs and convolving that flux-density distribution with the blank-sky Gaussian fit yields the dashed curve in Figure 11. The dashed curve is a poor match to the continuous QSO histogram because the extrapolation predicts that the peak flux densities of most QSOs are extremely low (). It is necessary to invoke a rise or peak in the flux-density distribution near mJy () to explain the high detection rate implied by the positive offset of the QSO histogram.
The dotted line in Figure 8 indicates the weighted faint-source count from the power-law extrapolation that (1) matches with the observed count at 2.4 mJy, (2) satisfies the integral constraint that the total number of radio sources must equal the total number of QSOs, and (3) best fits the observed flux-density distribution of faint sources; it is
| (22) |
and below . Of course, there is no reason to expect a break in the count slope to occur at the NVSS catalog limit, . At the midpoint of the QSO redshift range, , that break corresponds to a spectral luminosity , which is higher than the spectral luminosities of even the strongest starbursts.
Any more realistic extrapolation with a continuous count and count slope at 2.4 mJy must have a peak in at lower flux densities to match the statistical data, as shown by an illustrative model that yields the dashed curve in Figure 8. Convolving the model counts with the NVSS image noise distribution yields a good fit to the observed distribution of QSO peak flux densities; it is shown by the continuous curve in Figure 11). The median flux density of our high-redshift QSOs in this model is , so the median 1.4 GHz spectral luminosity in the source frame (calculated assuming a median spectral index ) is at . This is a factor of four higher than the 1.4 GHz spectral luminosity of Arp 220, and it might come from an AGN or a starburst. If it originates in a starburst obeying the FIR/radio correlation, an ultraluminous [] but not hyperluminous [] starburst is required.
4. Is QSO Radio Emission Bimodal?
The first published claim of a bimodal flux-density distribution (Strittmatter et al., 1980) features a strong-source peak too narrow to be consistent with relativistic beaming. The Strittmatter et al. (1980) flux-density distribution plot is reproduced in Figure 12. The narrow peak in the quantity (where is the number of sources stronger than and is the logarithmic width of each flux-density bin) near is an apparently significant factor of dex higher than the long tail of fainter sources. We have inserted the actual numbers of radio sources contributing to each logarithmic flux-density bin into Figure 12. The peak is produced by only two sources, as goes from 1 to 3, so and as plotted. However, the quantity is not the usual logarithmic differential source count or flux-density distribution . The thin curve shows the distribution of that would result from the same total number of radio sources (ten) having a constant in the plotted flux-density range. Thus there is no significant peak in the nearly constant logarithmic differential flux-density distribution of these QSOs, which is consistent with our Equation 21.

Miller et al. (1990) made sensitive 5 GHz observations of 105 bright QSOs with selected by their emission lines. They found nine with but none with . All nine detections have , far above their detection limit. This is evidence for bimodal flux-density and luminosity distributions, but at what statistical significance? The nine detections have flux densities 21, 28, 28, 51, 76, 98, 105, 111, and 136 mJy. The likelihood of no weaker detections above 0.6 mJy depends on how the flux densities are binned. The bin limits should not be chosen a posteriori to minimize this probability. In bins of width dex(1) starting at the detection limit, there are detections with , detections with , and detections with . If the flux-density distribution of QSOs is flat in logarithmic bins (as in Equation 21), there should be equal numbers in each bin. The average number of detections per bin is , so the Poisson probability of no detections in the faintest bin is . Thus the lack of detections fainter than 6 mJy in this small sample may just be the result of bad luck, which we did not encounter in our much larger high-redshift QSO sample.
We prefer to study evolving QSO luminosity functions, which are intrinsic properties of QSOs, rather than flux-density distributions or luminosity distributions, which depend on observational parameters. We found that the luminosity functions of radio sources so powerful that they must be produced by AGN are smooth and nearly flat power laws with no peaks or other features. There are “bumps” in the radio luminosity functions of QSOs, but they appear only at such low radio luminosities that the resulting radio flux densities are well below 1 mJy. The “bump” luminosities are consistent with significant starburst contributions (recall Figure 6): for our moderate-luminosity QSOs at low () redshifts and , corresponding to an ultraluminous starburst, for the most luminous QSOs at higher redshifts, .
5. The AGN and Host Galaxy Components of QSO Radio Emission
The radio emission from a QSO is the sum of contributions from its AGN and from star formation in its host galaxy. If the luminosities of the two contributions are nearly independent of each other at every redshift, the spectral luminosity function of QSOs will be the convolution of the AGN and starburst spectral luminosity functions.
5.1. Low-redshift QSOs
The AGN-powered portion of the luminosity function in the redshift range (Figure 4) was estimated from 163 NVSS detections of luminous sources. There are only 37 NVSS detections in the narrow redshift range , too few for statistical accuracy, so we estimated the AGN luminosity function from the evolving AGN luminosity function in the redshift range . The luminosity function in the range is lower than the luminosity function by (Sec. 2.3). This estimate is shown by the data points with error bars in Figure 6. For comparison, the 1.4 GHz local () luminosity functions of galaxies (Condon, Cotton, & Broderick, 2002) whose radio emission is dominated either by AGNs (continuous green curve) or by star formation (continuous red curve) are also shown. The radio luminosity function produced by AGNs in local galaxies is flatter and extends to higher radio luminosities than the luminosity function of star-forming galaxies, so local AGN-powered radio sources are more common above and star-forming galaxies have higher space densities than AGNs at lower luminosities. The luminosity of the galaxy M82 is typical for a nearby radio-selected star-forming galaxy.
Even allowing for starburst luminosity evolution, it is likely that the radio emission of low redshift ( QSOs stronger than is dominated by AGNs. To estimate the luminosity function that would result if all QSO radio emission were powered by only by AGNs, even at lower luminosites, we made the smooth power-law extrapolation (dashed green line in Figure 6) of the observed QSO luminosity function to lower luminosities. This extrapolation must be truncated below , as suggested by the dotted green curve in Figure 6, to keep the number of radio sources from exceeding the total number of low-redshift QSOs (1313). The details of the AGN luminosity function below are not well known but don’t matter because any luminosity function in this range always predicts that most of the low-redshift QSOs powered by entirely by AGN would be too radio quiet () to be statistically detectable by the NVSS. The dashed curve in Figure 5 shows the AGN-only flux-density distribution predicted by this model for the QSOs. The distribution peak flux density is much lower than the observed . The AGN-only distribution is distinguishable from the blank-sky distribution (dotted curve) only because its height has been depressed by the loss of QSOs in the long tail of strong sources above , which are off scale on this plot. The failure of the dashed curve to fit the data suggests that most of the low-redshift QSOs are not in “red and dead” elliptical galaxies with little or no ongoing star formation.
Any QSO luminosity function that is consistent with both the NVSS direct detections of sources stronger than 2.4 mJy and the distribution of peak flux densities in Figure 5 must rise sharply just below and fall fairly quickly at lower luminosities lest it imply more than 1313 SDSS QSOs with . Kimball et al. (2011) proposed that radio emission from the star-forming host galaxies is the cause of that rise. The peak of the the QSO host-galaxy radio luminosity function (dashed red curve in Figure 6) is at . If the faint radio sources are dominated by emission from the star-forming host galaxies, their radio spectral indices between 1.4 GHz and 6 GHz should be , which is the observed value (Kimball et al., 2011).
As it must, the radio luminosity function of the low-redshift QSO host galaxies lies below the radio luminosity function of all nearby galaxies powered primarily by star formation, but it is not much lower at the highest radio luminosities because many low-redshift QSOs seem to have high star-formation rates. The radio luminosity function of QSO host galaxies must fall rapidly below to satisfy the constraint that its integral not exceed the total number of SDSS QSOs in . In this respect, it differs from the radio luminosity function of all nearby star-forming galaxies (red curve in Figure 6), which rises slowly but monotonically even at very low luminosities. This difference is not surprising: most of the faintest nearby radio sources lie in low-mass galaxies with low star-formation rates (Condon, Cotton, & Broderick, 2002), while QSOs are found only in massive galaxies. The real surprise to radio astronomers accustomed to comparing QSOs with radio galaxies is that massive elliptical galaxies with low star-formation rates are so rare in our low-redshift QSO sample.
5.2. High-redshift QSOs
The high statistical detection rate of QSOs reported in Sec. 3.1 shows that most of these very luminous (median ) high-redshift QSOs contain radio sources with median spectral luminosity . This high detection rate is not consistent with a power-law extrapolation from higher radio luminosities of the AGN luminosity function; there must also be a “bump” in the QSO radio luminosity function at high redshifts. As illustrated in Figure 8, the bump must lie in a fairly narrow flux-density range to be consistent with the distribution of NVSS peak flux densities (Figure 11). Such a bump is consistent with, but does not by itself require, radio emission from ultraluminous [] starbursts in the host galaxies of the most luminous QSOs. Should we expect that most luminous, high-redshift QSOs contain ultraluminous starbursts?
The presence of a luminous QSO implies a high rate of radiatively efficient accretion onto a supermassive black hole. During “quasar mode” or “cold mode” accretion (Croton et al., 2006), cold gas is rapidly fed via an accretion disk to the black hole. The reservoir of cold gas that feeds the AGN may also produce a burst of star formation, as suggested by recent observations starbursts in the host galaxies of high-luminosity ( W) X-ray QSOs with (Rovilos et al., 2012) and of infrared emission from cold dust in the host galaxies of the fairly luminous () QSOs found in the Herschel ATLAS survey (Bonfield et al., 2011). Bonfield et al. (2011) associated the total () infrared luminosity with the star-formation luminosity and found it is related to the QSO luminosity via
| (23) |
where and . Using the FIR/radio correlation (Condon, 1992) and the median 1.4 GHz spectral luminosity, we estimate the median starburst luminosity for our low-redshift QSOs at typical redshift . The median absolute magnitudes of the low- and high-redshift QSOs are and , for a QSO luminosity ratio . Inserting these values into Equation 23 indicates that our high-redshift () QSOs should have a median starburst luminosity and a median radio spectral luminosity , only one sigma below our observed median for SDSS QSOs in the redshift range .
6. Summary
We investigated the 1.4 GHz radio emission from large optically selected samples of SDSS DR7 QSOs in two redshift ranges: and . As expected, only about 10% of the QSOs are sufficiently radio loud to be detected above the NVSS catalog limit. Such sources are so luminous that the bulk of their radio emission must be powered by AGNs. The 1.4 GHz luminosity functions of AGN-powered sources both samples (Figures 4 and 10) are flat power laws, so flat that the number of sources per decade of flux density or luminosity is nearly constant. These luminosity functions show no features or signs of bimodality that might indicate two or more distinct QSO types among the % of QSOs that are in the NVSS catalog.
Extrapolating the flat luminosity functions to lower luminosities predicts that most of the undetected QSOs should be extremely faint radio sources. However, the distributions of peak flux densities at QSO positions on the NVSS images reveal that most QSOs are moderately luminous radio sources, so there must be peaks or “bumps” in their 1.4 GHz luminosity functions in both redshift ranges. QSOs with have a median peak flux density (Figure 5) and median spectral luminosity ; QSOs in the redshift range have a median peak flux density (Figure 11) and median spectral luminosity . The reality of the statistical detections in the narrow redshift range was confirmed by individual detections of nearly all of these QSOs by the VLA at 6 GHz (Kimball et al., 2011), and the median spectral index of these sources is , typical of optically thin synchrotron emission from either AGNs or star-forming galaxies.
We suggest that the faint radio sources found in most bright optically selected QSOs are primarily powered by star formation. The median radio luminosities correspond to star-formation rates and for the moderately luminous () QSOs with and the extremely luminous () QSOs with , respectively. The total infrared luminosities of such starbursts can be estimated from the FIR/radio correlation. They are for the QSOs and for the QSOs. Such powerful starbursts may be fueled by the same cold gas reservoirs that flow into the central supermassive black holes that power the QSOs themselves. Our starburst interpretation of the low-luminosity QSO radio emission is supported by (1) far-infrared detections of cold dust in QSO host galaxies (Bonfield et al., 2011), and (2) agreement of our radio results with their empirical scaling of with QSO luminosity and redshift.
With cm-wavelength radio data alone, it is difficult to test our hypothesis that star formation in the host galaxies of most QSOs powers the faint radio sources that make the “bumps” in our otherwise flat radio luminosity functions and source counts. One way would be to show that the faint radio sources in QSOs follow the tight FIR/radio correlation obeyed by nearly all starburst galaxies. However, it is necessary to distinguish the FIR emission from a large mass of cool dust heated by stars from the mid-infrared (MIR) emission from a small mass of warmer dust heated by an AGN (Morić et al., 2010), so it is preferable that the the dust flux density be measured in the Rayleigh-Jeans tail at submillimeter wavelengths, by ALMA for example. Alternatively, ALMA submillimeter spectroscopy of molecular and ionic lines sensitive to X-ray dominated regions might reveal deeply buried AGNs (Rangwala et al., 2011).
References
- Baloković et al. (2012) Baloković, M., Smolčić, V., Ivezić, Z., et al. 2012, ApJ, in press (arXiv:1209.1099B)
- Barthel (2006) Barthel, P. D. 2006, A&A, 458, 1007
- Barvainis (1990) Barvainis, R. 1990, ApJ, 353, 419
- Barvainis et al. (2005) Barvainis, R., Lehár, J., Birkinshaw, M., Falcke, H., & Blundell, K. M. 2005, ApJ, 618, 108
- Becker, White, & Helfand (1995) Becker, R. H., White, R. L., & Helfand, D. J. 1995, ApJ, 450, 559
- Blundell & Beasley (1998) Blundell, K. M., & Beasely, A. J. 1998, MNRAS, 299, 165
- Blundell & Kuncic (2007) Blundell, K. M., & Kuncic, Z. 2007, ApJ, 668, L103
- Bonfield et al. (2011) Bonfield, D. G., Jarvis, M. J., Hardcastle, M. J. et al. 2011, MNRAS, 416, 13
- Boyce et al. (1998) Boyce, P. J., Disney, M. J., Blades, J. C., et al. 1998, MNRAS, 298,121
- Condon (1992) Condon, J. J. 1992, ARA&A, 30, 575
- Condon, Cotton, & Broderick (2002) Condon, J. J., Cotton, W. D., & Broderick, J. J. 2002, AJ, 124, 675
- Condon et al. (1991) Condon, J. J., Huang, Z.-P., Yin, Q. F., & Thuan, T. X. T. 1991, ApJ, 378, 65
- Condon & Mitchell (1984) Condon, J. J., & Mitchell, K. J. 1984, AJ, 89, 610
- Condon et al. (1998) Condon, J. J., Cotton, W. D., Greisen, E. W., et al. 1998, AJ, 115, 1693 (NVSS)
- Condon et al. (2003) Condon, J. J., Cotton, W. D., Yin, Q. F., et al. 2003, AJ, 125, 2411
- Cotton et al. (1980) Cotton, W. D., Wittels, J. J., Shapiro, I. I. et al. 1980, ApJ, 238, L123
- Crawford et al. (1970) Crawford, D. F., Jauncey, D. L., & Murdoch, H. S. 1970, ApJ, 162, 405
- Croton et al. (2006) Croton, D. J., Springel, V., White, S. D. M. et al. 2006, MNRAS,365, 11
- de Vries et al. (2007) de Vries, W. H., Hodge, J. A., Becker, R. H., White, R. L., & Helfand, D. J. 2007, AJ, 134, 457
- Dunlop et al. (2003) Dunlop, J. S., McLure, R. J., Kukula, M. J., et al. 2003, MNRAS, 340, 1095
- Falcke et al. (1996) Falcke, H., Patnaik, A. R., & Sherwood, W. 1996, ApJ, 473, L13
- Greenstein & Matthews (1963) Greenstein, J. L., & Matthews, T. A. 1963, Nature, 197, 1041
- Hazard et al. (1963) Hazard, C., Mackey, M. B., & Shimmins, A. J. 1963, Nature, 197, 1037
- Hoyle & Burbidge (1966) Hoyle, F., & Burbidge, G. R. 1966, ApJ, 144, 534
- Ivezić et al. (2002) Ivezić, Z., Menou, K., Knapp, G. R., et al. 2002, AJ, 124, 2364
- Kamionkowski & Loeb (1997) Kamionkowski, M., & Loeb, A. 1997, Phys.Rev.D, 56, 4511
- Katgert et al. (1973) Katgert, P., Katgert-Merkelijn, J. K., Le Poole, R. S., & van der Laan, H. 1973, A&A, 23, 171
- Kellermann & Pauliny-Toth (1966) Kellermann, K. I., & Pauliny-Toth, I. I. K. 1966, Nature, 212, 781
- Kellermann et al. (1989) Kellermann, K. I., Sramek, R., Schmidt, M., Shaffer, D. B., & Green, R. 1989, AJ, 98, 1195
- Kellermann et al. (1994) Kellermann, K. I., Sramek, R. A., Schmidt, M., Green, R. F., & Shaffer, D. B. 1994, AJ, 108, 1163
- Kimball et al. (2011) Kimball, A. E., Kellermann, K. I., Condon, J. J., Ivezić, Z., & Perley, R. A. 2011, ApJ, 739, L29
- Mahony et al. (2012) Mahony, E., Sadler, E. M., Croom, S. M. et al. 2012, ApJ, 754, 12
- Matthews & Sandage (1963) Matthews, T. A., & Sandage, A. R. 1963, ApJ, 138, 30
- Miller et al. (1990) Miller, L., Peacock, J. A., & Mead, A. R. G. 1990, MNRAS, 24, 207
- Miller et al. (1993) Miller, P., Rawlings, S., & Saunders, R. 1993, MNRAS, 263, 425
- Mitchell & Condon (1985) Mitchell, K. J., & Condon, J. J. 1985, AJ, 90, 1957
- Morić et al. (2010) Morić, L., Smolčić, V., Kimball, A., et al. 2010, ApJ, 724, 779
- Mundell, Ferruit, & Pedlar (2001) Mundell, C. G., Ferruit, P., & Pedlar, A. 2001, ApJ, 560, 168
- Peacock et al. (1986) Peacock, J. A., Miller, L., & Longair, M. S. 1986, MNRAS, 218, 265
- Rangwala et al. (2011) Rangwala, N., Maloney, P. R., Glenn, J., et al. 2011, ApJ, 743:94
- Rovilos et al. (2012) Rovilos, E., Comastri, A., Gilli, R. et al. 2012, A&A, in press (arXiv:1207.7129)
- Sandage (1965) Sandage, A. 1965, ApJ, 141, 1560
- Scheuer & Readhead (1979) Scheuer, P. A. G., & Readhead, A. C. S. 1979, Nature, 277, 182
- Schmidt (1963) Schmidt, M. 1963, Nature, 197, 1040
- Schmidt (1970) Schmidt, M. 1970, ApJ, 162, 371
- Schmidt & Green (1983) Schmidt, M., & Green, R. F. 1983, ApJ, 269, 352
- Schneider et al. (2010) Schneider, D. P., Richards, G. T., Hall, P. B. et al. 2010, AJ, 139, 2360
- Sopp & Alexander (1991) Sopp, H. M., & Alexander, P. 1991, MNRAS, 251, 14P
- Steenbrugge et al. (2011) Steenbrugge, K. C., Jolley, E. J. D., Kuncic, Z., & Blundell, K. M. 2011, MNRAS, 413, 1735
- Strittmatter et al. (1980) Strittmatter, P. A., Hill, P., Pauliny-Toth, I. I. K., Steppe, H., & Witzel, A. 1980, A&A, 88, L12
- Ulvestad et al. (2005) Ulvestad, J. S., Antonucci, R. R. J., & Barvainis, R. 2005, ApJ, 621, 123
- Walsh et al. (1989) Walsh, D. E. P., Knapp, G. R., Wrobel, J. M., & Kim, D.-W. 1989, ApJ, 337, 209
- White et al. (1997) White, R. L., Becker, R. H., Helfand, D. J., & Gregg, M. D. 1997, ApJ, 475, 479
- White et al. (2007) White, R. L., Helfand, D. J., Becker, R. H., Glikman, E., & de Vries, W. 2007, ApJ, 654, 99
| Redshift | |||||
|---|---|---|---|---|---|
| RA (J2000) DEC | (mJy) | (W Hz-1) | |||
| 07 54 03.61 | +48 14 28.1 | 0.2755 | 23.478 | 7.3 | 24.19 |
| 08 06 44.43 | +48 41 49.2 | 0.3701 | 23.769 | 901.7 | 26.57 |
| 08 20 15.61 | +59 42 28.4 | 0.3676 | 25.461 | 5.6 | 24.36 |
| 08 33 53.88 | +42 24 01.9 | 0.2491 | 23.903 | 248.6 | 25.62 |
| 08 36 58.91 | +44 26 02.3 | 0.2544 | 24.999 | 6.6 | 24.07 |
| 08 43 10.79 | +39 53 45.1 | 0.4036 | 23.765 | 2.6 | 24.12 |
| 08 43 47.85 | +20 37 52.5 | 0.2273 | 23.034 | 59.7 | 24.92 |
| 08 49 40.01 | +09 49 21.1 | 0.3656 | 23.425 | 587.2 | 26.37 |
| 08 50 39.96 | +54 37 53.3 | 0.3673 | 23.076 | 166.5 | 25.83 |
| 08 55 16.21 | +56 16 56.8 | 0.4422 | 23.759 | 5.3 | 24.52 |
| 08 56 32.99 | +59 57 46.9 | 0.2830 | 23.858 | 239.4 | 25.73 |
Note. — Table 1 is published in its entirety in the electronic edition of the Astrophysical Journal. A portion is shown here for guidance regarding its form and content.
| FLS flux density | Number of | NVSS bias |
|---|---|---|
| (Jy) | sources | () |
| 115–160 | 937 | |
| 160–230 | 821 | |
| 230–460 | 771 | |
| 115–460 | 2550 |
| Redshift | |||||
|---|---|---|---|---|---|
| RA (J2000) DEC | (mJy) | (W Hz-1) | |||
| 08 06 20.47 | 50 41 24.4 | 2.4565 | 28.38 | 16.9 | 26.75 |
| 08 11 41.98 | 51 57 10.9 | 2.1763 | 27.65 | 5.1 | 26.12 |
| 08 21 53.82 | 50 31 20.4 | 2.1326 | 27.93 | 58.5 | 27.16 |
| 08 27 54.25 | 33 36 04.2 | 1.8056 | 27.04 | 31.5 | 26.72 |
| 08 33 50.61 | 38 39 22.8 | 2.0143 | 27.53 | 2.7 | 25.76 |
| 08 34 00.05 | 43 01 48.1 | 2.3916 | 27.39 | 19.0 | 26.78 |
| 08 37 22.41 | 58 25 01.8 | 2.1010 | 27.89 | 690.4 | 28.21 |
| 08 45 06.24 | 42 57 18.4 | 2.0945 | 27.38 | 224.0 | 27.72 |
| 08 45 47.19 | 13 28 58.1 | 1.8834 | 28.40 | 413.4 | 27.88 |
| 08 50 51.80 | 15 22 15.0 | 2.0183 | 27.85 | 520.2 | 28.05 |
Note. — Table 3 is published in its entirety in the electronic edition of the Astrophysical Journal. A portion is shown here for guidance regarding its form and content.