The Nature of -ray Loud Narrow Line Seyfert I Galaxies PKS 1502+036 and PKS 2004447
Abstract
Variable -ray emission has been discovered in five Radio-loud Narrow Line Seyfert 1 (NLSy1) galaxies by the Large Area Telescope (LAT) onboard the Fermi Gamma-Ray Space Telescope. This has clearly demonstrated that these NLSy1 galaxies do have relativistic jets similar to two other cases of -ray emitting Active Galactic Nuclei (AGN), namely blazars and radio galaxies. We present here our results on the multi-band analysis of two -ray emitting NLSy1 galaxies namely PKS 1502+036 ( = 0.409) and PKS 2004447 ( = 0.240) using archival data. We generate multi-band long term light curves of these sources, build their spectral energy distribution (SED) and model them using an one zone leptonic model. They resemble more to the SEDs of the flat spectrum radio quasar (FSRQ) class of AGN. We then compare the SEDs of these two sources with two other Fermi detected AGN along the traditional blazar sequence, namely the BL Lac Mrk 421 ( = 0.03) and the FSRQ 3C 454.3 ( = 0.86). The SEDs of both PKS 1502+036 and PKS 2004447 are found to be intermediate to the SEDs of Mrk 421 and 3C 454.3. In the -ray spectral index v/s -ray luminosity plane, both these NLSy1 galaxies occupy a distinct position, wherein, they have luminosity between Mrk 421 and 3C 454.3, however steep -ray spectra similar to 3C 454.3. Their Compton dominance as well as their X-ray spectral slope also lie between Mrk 421 and 3C 454.3. We argue that the physical properties of both PKS 1502+036 and PKS 2004447 are in general similar to blazars and intermediate between FSRQs and BL Lac objects and these sources thus could fit into the traditional blazar sequence.
Subject headings:
galaxies: active gamma rays: galaxies quasars: individual(PKS 1502+036, PKS 2004-447 galaxies: Seyfert1. Introduction
The extra-galactic sky in the high energy -ray band is dominated by a special class of Active Galactic Nuclei (AGN) called blazars (Abdo et al. 2010b). These blazars which come under two sub-classes namely Flat Spectrum Radio Quasars (FSRQs) and BL Lacs (see, for e.g., Urry & Padovani 1995), have similar broad band continuum properties, such that they emit variable non-thermal emission over the entire electromagnetic spectrum. They both have flat radio spectra (), at GHz frequencies, high optical polarization, exhibits superluminal pattern at radio-frequencies and also show rapid flux and polarization variations (Wagner & Witzel 1995; Andruchow et al. 2005). However, the distinction between FSRQs and BL Lacs is made on the difference in the strength of their optical emission lines. BL Lacs have weak optical emission lines with rest frame equivalent widths less than 5 Å(Stocke et al. 1991; Stickel et al. 1991). The observed broad band emission of blazars is believed to originate from relativistic jets which are aligned closely to the observer (Begelman et al. 1984). Their spectral energy distribution (SED) shows two prominent and distinct peaks: the low energy peak due to synchrotron emission, lies between the far-infrared and the X-ray band, and the high energy peak due to inverse Compton (IC) radiation, lies in the MeV to GeV energy range. The seed photons for IC emission can be synchrotron photons itself (Synchrotron Self Compton, SSC; Konigl 1981; Marscher & Gear 1985; Ghisellini & Maraschi 1989) or photons external to the jet (external Compton, EC; Begelman & Sikora 1987; Melia & Konigl 1989; Dermer et al. 1992). The plausible sources of seed photons for EC can be accretion disc (Dermer & Schlickeiser 1993; Boettcher et al. 1997), broad line region (BLR) (Sikora et al. 1994; Ghisellini & Madau 1996), dusty torus (Błażejowski et al. 2000; Ghisellini & Tavecchio 2008), bulge of the host galaxy, or cosmic microwave background radiation (Ghisellini & Tavecchio 2009). In the -ray regime, FSRQs are more luminous and exhibit softer spectral index than BL Lacs (Abdo et al. 2009a). It has been noted by Fossati et al. (1998) and Ghisellini et al. (1998) that both FSRQs and BL Lacs follow the so called blazar sequence. However, recently Giommi et al. (2012) has argued that the existence of blazar sequence could be due to selection effects.
In addition to blazars which are dominating the -ray extra-galactic sky, Fermi has also discovered variable -ray emission from five Narrow Line Seyfert 1 (NLSy1) galaxies (Abdo et al., 2009b, c; D’Ammando et al., 2012; Calderone et al., 2011). A few more NLSy1 sources are suspected to be -ray emitters, although the detection significance is still low (Foschini, 2011). NLSy1 galaxies are a separate class of AGN with peculiar properties. Their optical spectra are similar to the conventional broad line Seyfert 1 galaxies except that they have narrow Balmer lines (FWHM (Hβ) 2000 km/sec), weak [O iii] ([O iii]/H 3) and strong optical Fe ii lines (Osterbrock & Pogge, 1985; Goodrich, 1989). They also have steep soft X-ray spectra (Boller et al., 1996; Wang et al., 1996; Leighly, 1999a) and show rapid X-ray flux variations (Pounds et al., 1995; Leighly, 1999b). These peculiar observational characteristics are attributed to them having low-mass black holes (106108 M⊙) and accreting close to the Eddington limit (Peterson et al., 2000; Hayashida, 2000; Grupe & Mathur, 2004; Zhou et al., 2006; Xu et al., 2012). However, recently, Calderone et al. (2012), using multi-wavelength data, have shown that radio-loud NLSy1 (RL-NLSy1) galaxies have black hole masses similar to blazars. These RL-NLSy1 galaxies comprising about 7% of NLSy1 galaxy population, exhibit compact core-jet structure, flat/inverted radio spectra, high brightness temperature and superluminal motion (Komossa et al., 2006; Doi et al., 2006). Recently, kiloparsec-scale radio structures are found in six RL-NLSy1 galaxies (Doi et al. 2012). The SEDs of some RL-NLSy1 galaxies are found to be similar to those of high frequency peaked BL Lac objects and some of them also show a hard X-ray component in their bright optical/UV state (Yuan et al. 2008). Though these characteristics are indicative of the presence of relativistic jets in these sources that are closely aligned to the observer, the detection of -rays in five of them has confirmed their presence (Abdo et al., 2009b, c; D’Ammando et al., 2012) similar to the blazar class of AGN. Also, it has been recently reported that the optical and infra-red (IR) flux variations of some of these sources are similar to blazars (Liu et al. 2010; Paliya et al. 2013; Jiang et al. 2012; Maune et al. 2013). However, these similarities are at odds with the common belief that NLSy1 galaxies are hosted in spiral galaxies with low mass black holes, while, blazars with powerful relativistic jets are hosted in elliptical galaxies with high mass black holes. Therefore, detailed studies of these sources will enable us to understand the physical properties of relativistic jets hosted in AGN with low mass central black holes and high accretion rates. In this work, we have carried out a detailed analysis of two such sources, namely, PKS 1502+036 and PKS 2004447 to see (i) the similarities and/or differences of them vis-a-vis the blazars detected by Fermi and (ii) their place in the traditional blazar sequence. The detailed analysis of these sources are presented here for the first time. Throughout the work, we adopt =0.27, =0.73 and Hubble constant H0 = 70 km s-1 Mpc-1.
2. Sample
Among the 5 known -ray emitting NLSy1 (-NLSy1) galaxies, we have selected two of them, namely, PKS 1502+036 and PKS 2004447. They have intermediate redshifts when compared to other -NLSy1 galaxies. PKS 1502+036 has a very compact core on observations with the Very Large Array (VLA; Orienti et al. 2012; Kimball et al. 2011). However, when observed at 15 GHz, using Very Long Baseline Array (VLBA) at parsec scale resolution, it was found to have a core-jet structure (Orienti et al. 2012). This NLSy1 galaxy, with a central black hole mass of 4 106 M⊙, has a brightness temperature of 1012 K (Yuan et al., 2008). It is a faint, but persistent -ray emitter (Calderone et al. 2011; Abdo et al. 2009c) and also show intra-night optical variability (INOV; Paliya et al. 2013) and rapid IR variability (Jiang et al. 2012).
PKS 2004447 has been classified as a NLSy1 galaxy by Oshlack et al. (2001) and Gallo et al. (2006) but Komossa et al. (2006) classify it as narrow-line radio galaxy owing to the presence of weak Fe II lines in its optical spectra. It has a steep spectrum above 8.4 GHz (Orienti et al., 2012), however, has a flat spectrum below 5 GHz (Healey et al., 2007). At 20 GHz, it shows a fractional polarization of 3.8 (Murphy et al., 2010). The general properties of both sources are given in Table 1.
| Name | RA (2000) | Dec (2000) | zaafootnotemark: | MBaafootnotemark: | Vaafootnotemark: | bbfootnotemark: | Rccfootnotemark: | F0.1-300GeV | TS | ddfootnotemark: | |
| (h m s) | (d m s) | (mag) | (mag) | ||||||||
| (1) | (2) | (3) | (4) | (5) | (6) | (7) | (8) | (9) | (10) | (11) | (12) |
| PKS 1502+036 | 15:05:06.5 | +03:26:31 | 0.409 | 22.8 | 18.64 | 0.41 | 3364 | 5.15 0.42 | 2.67 0.06 | 419.28 | 3.93 |
| PKS 2004447 | 20:07:55.1 | -44:34:43 | 0.240 | 21.6 | 19.30 | 0.38 | 6358 | 1.66 0.33 | 2.58 0.12 | 67.67 | 3.17 |
3. Data Reduction and Analysis
3.1. FERMI-Large Area Telescope
The Fermi-Large Area Telescope (LAT; Atwood et al. 2009) data used in this work were collected over the last four years of Fermi operation, from 2008 August 05 00:00:00 UT to 2012 July 24 00:00:00 UT. LAT photons of event class 2 between 100 MeV to 300 GeV were extracted from Fermi Science Support Center444http://fermi.gsfc.nasa.gov/ssc/data within 30∘ circular region of interest centered around the position of the objects. Analysis of the data was done with the LAT software package ScienceTools v9r27p1 along with the use of post-launch instrument response functions P7SOURCEV6 and the corresponding Galactic and isotropic diffuse background models. Additionally, a cut on the zenith angle ( 100∘) was applied in order to exclude the contamination from Earth’s-albedo. The spectral analysis were performed using an unbinned maximum likelihood method. The data were fitted with a simple power law model. In the analysis, we consider the source to be detected if test statistic (TS) 9. This corresponds to 3 detection (Mattox et al., 1996). For TS 9, 2 upper limits were calculated. Systematic uncertainties in the flux were estimated as 10 at 0.1 GeV, 5 at 560 MeV and 20 at 10 GeV and above555http://fermi.gsfc.nasa.gov/ssc/data/analysis/LATcaveats.html. Results of the average analysis are given in Table 1.
3.2. SWIFT (BAT, XRT, UVOT)
We have searched for the data from all the three telescopes onboard Swift (Gehrels et al. 2004), namely the Burst Alert Telescope (BAT; Barthelmy et al. 2005) operating in the 15150 keV band, the X-ray telescope (XRT; Burrows et al. 2005) operating in the 0.310 keV band and the Ultra-Violet Optical Telescope (UVOT; Roming et al. 2005) which can observe in 6 filters; namely V, B, U, UVW1, UVM2 and UVW2. We extracted all publicly available optical/UV/X-ray data for the sources from HEASARC archives. The data were analyzed using latest Swift tools included in HEASOFT v.6.12.0 together with calibration data files (CALDB) updated on 2012 April 02.
Both -NLSy1s could not be detected in the 15150 keV band. We analyzed the XRT data using the XRTDAS software package developed at the ASI Science Data Center (ASDC) and distributed by HEASARC within the HEASoft package (v.6.12.0). Data were cleaned with standard filtering criteria and calibrated using the xrtpipeline task with default parameters and single-to-quadruple events (grades 112). We did not find any evidence of pile-up. Events for spectral analysis were selected within a circle of 50′′ radius, centered on the source position, while the background was selected from a nearby source-free region with 100′′ radius. To generate lightcurves we first rebinned the spectrum to have at least 1 count per bin (using grppha) and then calculated the likelihood using C-statistics (Cash 1979). The data were fitted with absorbed power-law model with Galactic absorption values taken from Kalberla et al. (2005). For lightcurve analysis, we have not corrected the XRT data for galactic absorption. For SED analysis, the individual XRT event files were combined together using the XSELECT package and the average spectrum was extracted from summed event files. Depending on the total detected counts, we grouped the spectrum so as to have at least 5 counts per bin for PKS 1502+036 and 15 counts per bin for PKS 2004447. Model fitting was done using XSPEC (Arnaud 1996). Finally, the SED data were corrected for Galactic absorption and then binned appropriately for both sources.
Swift-UVOT has observed these sources in all six filters for most of the observations but not always. The UVOT data were integrated with uvotimsum task and then analyzed with uvotsource task. The source region was chosen as a circle of 5′′ radius for optical filters and 10′′ radius for UV, while the 1′ sized background region was extracted from nearby source-free regions. The observed magnitudes were de-reddened using the extinction laws of Cardelli et al. (1989) and converted to flux units using the zero points and conversion factors of the Swift-CALDB (Poole et al. 2008).
4. Results
4.1. Multi-band temporal behaviour
The long-term multi-band light curves of the two sources PKS 1502+036 and PKS 2004447 are shown in Figure 1 and 2 respectively. In the -ray band, flux values were obtained over 30 day binning, whereas in the other bands, each flux point corresponds to one observation of Swift. For PKS 1502+036, only four sets of Swift data were available. As the data are sparse, no strong claims of variability could be made. However, visual examination show some hints of variability in the UVOT bands. In the -ray band, the source was mostly in the low activity state, however, was found to be in a relatively bright state between MJD 55592 and 55622. It is also found to be variable at 15 GHz when observed from Ovens Valley Radio Observatory (OVRO)666http://www.astro.caltech.edu/ovroblazars/data/data.php.
For PKS 2004447, the sparseness of the data precluded us to provide any estimates of the variability of the source. Visual examination of the lightcurves in the UVOT bands give hints that the source has shown variability. Source has also shown significant variability in the X-ray band. When observed first time on MJD 55696, its observed flux was (4.421.23) 10-13 erg cm-2 s-1, which increased by 3 times when observed again on MJD 55821 but diminished to (5.362.20) 10-13 erg cm-2 s-1 when observed on MJD 56130. In the -ray band, the source was detected only in two epochs when analyzed using a 30 day binning. Comparing the counts at those two epochs we find that the source has varied in flux.
4.2. X-ray spectral fit
For PKS1502+036, all Swift/XRT observations were integrated (global exposure = 19.25 ksec) and then fitted with an absorbed power law. We find photon index, = 1.700.20, the normalization at 1 KeV = (4.490.67) 10-5 ph cm-2 s-1 keV-1 and the integrated flux in the 0.310 keV energy band = (2.900.69) 10-13 erg cm-2 s-1.
On fitting an absorbed power law model to the integrated data (global exposure = 45.89 ksec) of PKS 2004447, we find = 1.530.09 and the normalization at 1 keV = (8.140.57) 10-5 ph cm-2 s-1 keV-1. The flux in the 0.310 keV energy band = (6.260.73) 10-13 erg cm-2 s-1.
4.3. -ray spectral variability analysis
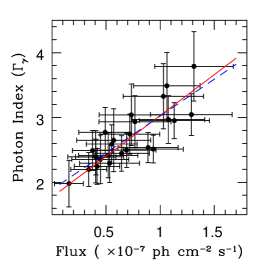
In Figure 3, we show the correlation of the 0.1300 GeV flux against the -ray spectral slope for the source PKS 1502+036, when 30 day time binning was used. The photon index values were obtained by fitting a power law model to the Fermi-LAT data. Clear evidence of spectral softening when brightening was found for this source when the data was fit using both the unweighted least squares method and weighted linear least squares fit that takes into account the errors on both the dependent and independent variables (Press et al. 1992). In the case of PKS 2004447, we have only two detections at the epochs MJD 55232 and MJD 55802. The flux values at these two epochs are (7.93 2.74) 10-8 and (4.72 1.91) 10-8 ph cm-2 s-1 respectively. The photon indices at MJD 55232 and MJD 55802 are 3.12 0.38 and 2.56 0.31. Thus, between the two epochs of detection, the -ray spectral index shows a softening when brightening trend. This behavior of the photon index is contradictory to the harder when brighter trend seen in the brightest FSRQ 3C 454.3 (Abdo et al. 2010a).
4.4. Spectral Energy Distribution
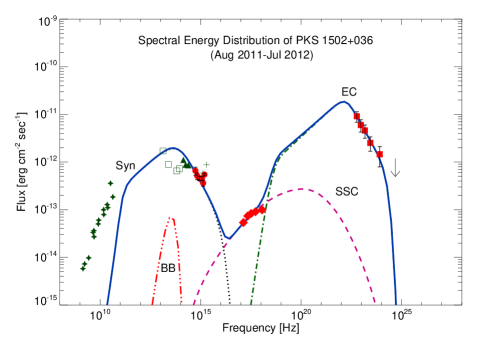
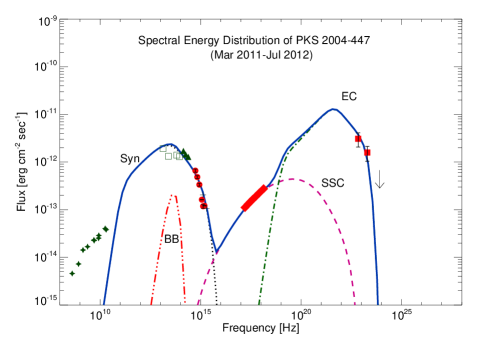
To investigate the physical characteristics of these sources, we have built optical/UV to -rays SEDs using quasi-simultaneous data. For PKS 1502+036, we have used the data sets between MJD 55800 and 56130, whereas for PKS 2004447, the data sets spanning the period MJD 55680 and 56130 were used. These time periods are shown as vertical dashed lines in Figure 1 and 2 for PKS 1502+036 and PKS 2004447 respectively. The derived flux values in optical/UV, X-ray and -rays are given in Table 2. Both the SEDs were modeled using a simple one zone leptonic emission model described in Sahayanathan & Godambe (2012). In this model the emission region is assumed to be a spherical blob moving down the jet at relativistic speed with bulk Lorentz factor . The emission region is filled with a broken power law electron distribution with indices and before and after the break energy, respectively. The particles lose their energy through synchrotron radiation in a randomly oriented magnetic field () and inverse Compton radiation. The target photons for the inverse Compton radiation are the synchrotron photons (SSC) and an external photon field which is assumed to be a blackbody for simplicity. Considering the magnetic field to be in equipartition with the relativistic particle distribution, the main parameters governing the SED can be deduced/constrained using the observed information available in optical/X-ray and -ray energies. The kinetic power of the jet can then be calculated by assuming the inertia of the jet being provided by cold protons whose number density is equal to that of non-thermal electrons. This model does not take into account UV/optical emission from the accretion disk and X-ray emission from the hot corona. For the model fitting we assume a variability time scale of 1 day, which is typically seen in the -ray lightcurves of blazars.
The resultant model fits to the SEDs for PKS 1502+036 and PKS 2004447 are shown in Figure 4. The optical-UV flux can be reproduced by synchrotron emission and the X-ray flux by SSC emission. The explanation of the -ray flux as an outcome of EC process demands the temperature of the external photon field to be in case of PKS 1502+036 and for PKS 2004447. The spectrum of this external photon field black body component with luminosities of 8.19 1043 erg s-1 and 6.26 1043 erg s-1 for PKS 1502+036 and PKS 2004447 respectively is shown in Figure 4. We compared the luminosity of this black body component with the observed luminosity (which is the sum of thermal and non-thermal components) in 2MASS and WISE bands and as expected they are lower than the observed luminosities. Also the deduced temperatures are consistent with the temperature generally observed for the dusty torus (Jaffe et al. 2004). The archival data from NED is shown with green color in Figure 4. The radio observation may be contaminated by the core emission and emissions from other extended region and hence do not satisfy the model curve. The model fitting parameters are given in Table 3. We note that many of the parameters obtained from our modelling of the broad band SED of these two sources differ from the paramaters obtained for the same sources by Abdo et al. (2009c). This might be partly due to the quality of the data sets used for SED modelling. Here we use nearly simultaneous data sets compared to the non-simultaneous multi-wavelength data used by Abdo et al. (2009c).
5. Discussion
Aligned relativistic jets are invoked to explain the extreme power generated by the blazar class of AGN, with a large fraction of the power being emitted in the -ray band. RL-NLSy1 galaxies also have many observed characteristics similar to blazars, namely, flat/inverted radio spectra, compact core-jet structure on VLBI scales (Giroletti et al., 2011; Orienti et al., 2012), high brightness temperature, superluminal jet components (Doi et al., 2006), INOV (Paliya et al. 2013; Liu et al. 2010) and rapid infra-red flux variability (Jiang et al. 2012). However, the detection of variable -ray emission in five RL-NLSy1 galaxies (Abdo et al., 2009b, c; D’Ammando et al., 2012; Calderone et al., 2011) clearly shows that NLSy1 galaxies could also have relativistic jets similar to the blazars hosted in elliptical galaxies. If the NLSy1 galaxies are hosted in spiral galaxies we should revisit the paradigm that jets can only be launched in elliptical galaxies (Marscher 2009). The blazar like behavior shown by these -NLSy1 galaxies, powered by smaller mass black holes and accreting close to the Eddington limit, also, poses questions on the nature of them vis-a-vis blazars and their place in the traditional blazar sequence. Thus an understanding of these sources will enable one to probe jet physics at a different mass range compared to blazars. We have presented here a detailed analysis of two such RL-NLSy1 galaxies namely PKS 1502+036 and PKS 2004447 using multi-wavelength data and modeling. Our multi-wavelength lightcurves clearly show the objects to be variable; however, owing to the sparseness of the data, correlations if any on the flux variations between different frequency bands could not be ascertained.
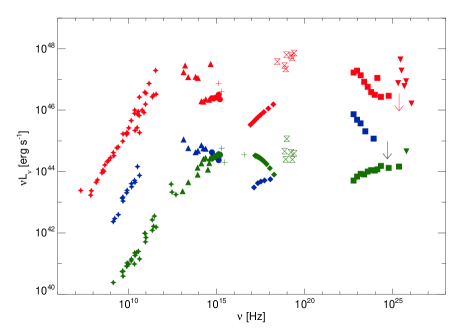
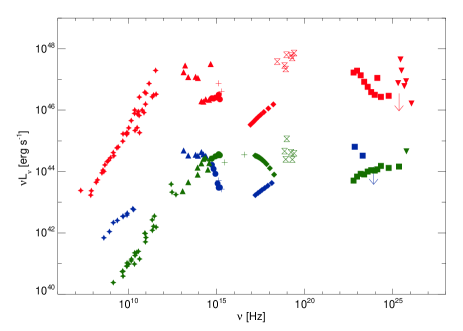
From the modeling of the SEDs of both PKS 1502+036 and PKS 2004447, using the one zone leptonic model of Sahayanathan & Godambe (2012), we find that, for these sources, the UV-optical data are well fit with synchrotron emission, the X-ray data are fit with SSC and the -ray points are fit with EC scattering of IR photons from the torus. The power of the jet estimated from the fit parameters is larger for PKS 1502+036 compared to PKS 2004447. To see how the SEDs of these two -NLSy1 galaxies match with that of blazars, we also built two other SEDs, one for the well studied FSRQ 3C 454.3 ( = 0.859) and the other for the BL Lac Mrk 421 ( = 0.030). For both 3C 454.3 and Mrk 421, we utilized data that covered the same period as that used for the two -NLSy1 galaxies studied here. The data for both 3C 454.3 and Mrk 421 were analyzed using the procedures outlined in Section 3 except for the XRT analysis of Mrk 421 wherin we have used a log-parabola model (Massaro et al. 2004a, b). The results of the spectral analysis for 3C 454.3 and Mrk 421 are given in Table 4. In Figure 5, we show the SEDs of PKS 1502+036 and PKS 2004447 along with the FSRQ 3C 454.3 and BL Lac Mrk 421. In this Figure too, the archival data are from NED and BZCAT777http://www.asdc.asi.it/bzcat/. We found that during the period considered for spectral analysis, 3C 454.3 was in quiescent state while Mrk 421 was in exceptional bright state.
From Figure 5, it is clear that for 3C 454.3, the synchrotron emission peaks in the IR region, whereas the high energy EC emission peaks in the MeVGeV range. However, for Mrk 421, the synchrotron emission peaks in the UVX-ray spectral band and the high energy SSC emission peaks in the GeVTeV region. While the optical/UV luminosities of the two -NLSy1 galaxies are comparable to that of Mrk 421, their -ray luminosities are significantly higher than the flaring Mrk 421. This clearly demonstrates that SSC alone cannot account for the high energy emission from these two -NLSy1 galaxies and that EC is needed. Such EC model is frequently invoked to explain the high energy emission from FSRQs (Dermer et al. 1992; Sikora et al. 1994, 2009). In the powerful FSRQ, PKS 1510089, based on the observed coincidence of -ray flux to the appearance of new knots, Marscher et al. (2010) hint that the -rays are produced from a region well beyond the radius of the BLR, most likely in the IR torus. Thus, the high energy emission from these -NLSy1 galaxies clearly resemble that of FSRQs and likely due to IC scattering of IR photons from the dusty torus. Another supporting fact for the above mentioned theory is that nominal temperature of molecular torus is about 300 K (Landt et al., 2010) to 1200 K (Cleary et al., 2007; Malmrose et al., 2011) with hot emitting region expected to be nearer to the central super massive black holes (SMBHs). The IR torus temperature which we obtained from SED analysis is about 600700 K for both sources, which means that the dissipation region may lie outside the BLR. Recently, Zhang et al. (2012) too have noted that the observed broad band SEDs of four NLSy1 galaxies detected by Fermi are in close resemblance to FSRQs than BL Lacs. In the SEDs of these NLSy1 galaxies (see Figure 5), it is clear that the low energy bump is in the IR regime, while the high energy bump is in the MeVGeV band. Also, it is clear from Figure 5, that both the low and high energy peaks of these -NLSy1 galaxies are intermediate to that of 3C 454.3 and Mrk 421. Thus, both PKS 1502+036 and PKS 2004447 (and may be other -NLSy1 galaxies) could fit very well into the traditional blazar sequence (Fossati et al. 1998; Foschini et al. 2010).


| Fermi-LAT | ||||||||
| Source | Time coveredaafootnotemark: | Fluxbbfootnotemark: | Photon Indexccfootnotemark: | Test Statisticddfootnotemark: | ||||
| PKS 1502+036 | 55800-56130 | 2.10.31 | 2.930.19 | 87.17 | ||||
| PKS 2004-447 | 55680-56130 | 0.710.19 | 2.930.30 | 19.17 | ||||
| Swift-XRT | ||||||||
| Source | Time coveredaafootnotemark: | Exp.eefootnotemark: | fffootnotemark: | Fluxggfootnotemark: | Normalizationhhfootnotemark: | Stat.iifootnotemark: | ||
| PKS 1502+036 | 56042-56103 | 14.58 | 1.880.22 | 2.880.72 | 5.280.82 | 14.26/21 | ||
| PKS 2004-447 | 55696-56130 | 45.89 | 1.530.09 | 6.260.73 | 8.140.57 | 36.69/37 | ||
| Swift-UVOT | ||||||||
| Source | Time coveredaafootnotemark: | vjjfootnotemark: | bjjfootnotemark: | ujjfootnotemark: | uvw1jjfootnotemark: | uvm2jjfootnotemark: | uvw2jjfootnotemark: | |
| PKS 1502+036 | 56042-56130 | 6.541.26 | 5.080.82 | 4.560.48 | 4.530.40 | 3.610.51 | 5.470.32 | |
| PKS 2004-447 | 55696-56130 | 6.590.52 | 4.840.34 | 3.350.23 | 1.620.02 | 1.180.12 | 1.210.02 |
| Parameter | Symbol | PKS 1502+036 | PKS 2004447 |
|---|---|---|---|
| Redshift | 0.409 | 0.240 | |
| Particle spectral index (low energy) | p | 2.22 | 2.10 |
| Particle spectral index (high energy) | q | 4.5 | 4.00 |
| Magnetic field (equipartition) | B | 0.60 G | 0.72 G |
| Bulk Lorentz factor | 12 | 9 | |
| Comoving emission region size | R | 2.86 1016 cm | 2.32 1016 cm |
| IR dust temperature in AGN frame | T∗ | 605 K | 694 K |
| IR torus energy density in AGN frame | u∗ | 1.02 10-3 erg cm-3 | 1.75 10-3 erg cm-3 |
| IR black body luminosity in AGN frame | L∗ | 8.19 1043 erg s-1 | 6.26 1043 erg s-1 |
| Particle energy density | Ue | 1.43 10-2 erg cm-3 | 2.06 10-2 erg cm-3 |
| Minimum electron Lorentz factor | 30 | 60 | |
| Break electron Lorentz factor | 1870 | 1176 | |
| Maximum electron Lorentz factor | 1.8 104 | 7.5 103 | |
| Jet power | Pj | 3.1 1045 erg s-1 | 8.5 1044 erg s-1 |
| Fermi-LAT | ||||||||||
| Source | Time covered | Flux | Photon index | Test Statistic | ||||||
| 3C 454.3 | 55680-56130 | 4.90.29 | 2.610.06 | 742.73 | ||||||
| Mrk 421 | 55680-56130 | 11.40.27 | 1.790.02 | 10971.46 | ||||||
| Swift-XRT | ||||||||||
| Source | Time covered | Exp. | NH | aafootnotemark: | aafootnotemark: | Flux bbfootnotemark: | Normalizationccfootnotemark: | Stat. | ||
| 3C 454.3 | 55729-55924 | 17.41 | 6.58 | 1.490.05 | (6.540.38) 10-12 | (8.430.35) 10-4 | 86.77/74 | |||
| Mrk 421 | 55621-56078 | 112.4 | 1.91 | 2.3080.001 | 0.4370.004 | (3.420.01) 10-10 | (8.960.01) 10-2 | 1177.25/675 | ||
| Swift-UVOT | ||||||||||
| Source | Time covered | v44Galactic absorption in units of 1020 cm-2 from Kalberla et al. (2005)Significance of detection using likelihood analysis. | b44Swift V, B, U, W1, M2 and W2 band fluxes in the units of 10-12 erg cm-2 s-1 | u44Swift V, B, U, W1, M2 and W2 band fluxes in the units of 10-12 erg cm-2 s-1 | uvw144Swift V, B, U, W1, M2 and W2 band fluxes in the units of 10-12 erg cm-2 s-1 | uvm244Swift V, B, U, W1, M2 and W2 band fluxes in the units of 10-12 erg cm-2 s-1 | uvw244Swift V, B, U, W1, M2 and W2 band fluxes in the units of 10-12 erg cm-2 s-1 | |||
| 3C 454.3 | 55729-55924 | 7.130.13 | 6.940.10 | 7.460.13 | 7.630.16 | 9.280.16 | 6.590.13 | |||
| Mrk 421 | 55621-56078 | 132.984.34 | 156.318.24 | 167.591.04 | 183.968.48 | 169.829.91 |
Recently, Chen & Bai (2011) has reported that the -NLSy1 galaxies occupy low luminosity-low frequency region in synchrotron peak frequency ()-luminosity (Ls) plane. This trend can also be very well seen in Figure 5, where Ls of both PKS 1502+036 and PKS 2004447 are similar to that of Mrk 421, whereas, their corresponding peak frequencies are quite different. Both of them have in the lower frequency region compared to Mrk 421. Again the possible explanation for such low luminosity - low frequency behaviour of both PKS 1502+036 and PKS 2004447 could be due to their low black hole masses (Chen & Bai, 2011; Ghisellini & Tavecchio, 2008).
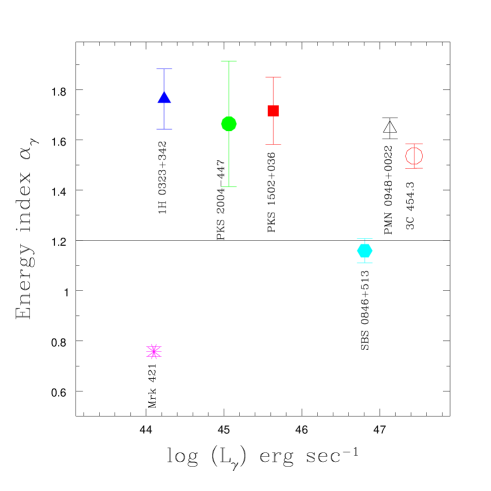
In Figure 6, we have shown the position of the two NLSy1 galaxies studied here, in the -ray spectral index v/s K-corrected -ray luminosity plane along with the FSRQ 3C 454.3 and the BL Lac Mrk 421. Also shown in Figure 6, are the other three known -ray emitting NLSy1 galaxies namely 1H 0323+342 ( = 0.063), SBS 0846+513 ( = 0.584) and PMN J0948+0022 ( = 0.584). The K-corrected -ray luminosities were evaluated following Ghisellini et al. (2009). Considering only the sources studied here, namely, PKS 1502+036 and PKS 2004447, we find that their -ray luminosities are intermediate to the FSRQ 3C 454.3 and BL Lac Mrk 421 and, they have steep -ray spectral index similar to FSRQs (Ghisellini et al. 2009). However, considering all the Fermi detected NLSy1 galaxies till now, we found that they have a wide range of -ray luminosities overlapping the region occupied by BL Lacs and FSRQs (Ghisellini et al. 2009, 2011), however, the steep -ray spectral index displayed by most of them, leads us to argue that in terms of the -ray spectral index behavior, Fermi detected NLSy1 galaxies are similar to FSRQs.
Further, as discussed by Costamante (2009), FSRQs are more Compton-dominated (Compton-dominance is the ratio between Compton and synchrotron luminosities, CD L) than BL Lacs and on average show a sequence of values from 100 in FSRQs to 1 in high energy peaked BL Lac objects (HBLs). If we calculate CD for our sources, it comes 10 for both of them. Finally, X-ray spectra of low-energy peaked BL Lac objects (LBL) and FSRQs are believed to be dominated by IC emission of low-energy electrons and thus a flat spectral index ( 1) is expected. As we move from LBL to HBL sources, the peak shifts toward higher energies and tail of the synchrotron emission starts to dominate and a steep spectrum ( 1) is expected. If we calculate the X-ray spectral indices for our sources (see Table 2 and 4), we found that both PKS 1502+036 and PKS 2004447 are having flat spectral indices (0.88 and 0.53, respectively), which are intermediate to 3C 454.3 (0.49) and Mrk 421 (1.31).
Thus, from an analysis of the presently available multi-wavelength data set of PKS 1502+036 and PKS 2004447, we find that many properties of them are intermediate to the FSRQ 3C 454.3 and the BL Lac Mrk 421. Further, our analysis also suggests that these sources may be low black hole mass counterparts of powerful FSRQs. However, we caution that as of now there are no unambiguous observational evidence for these two sources in particular and NLSy1 galaxies in general, to be hosted by spiral galaxies having low mass black holes. However, going by the present widely considered notion that NLSy1 galaxies are powered by low mass black holes in spiral galaxies, the current observational evidence for the presence of aligned jets in the NLSy1 galaxies detected by Fermi goes against the prevailing idea of jets being launched only by elliptical galaxies. A clear picture on the nature of these sources will emerge when more observations become available in the future.
6. Conclusions
In this work, we have analyzed the two intermediate redshifted -NLSy1 galaxies using all available data covering IR, optical, UV, X and -ray regimes to understand their physical characteristics. We also compare the results obtained, with two other well studied sources namely the FSRQ 3C 454.3 and the BL Lac Mrk 421. We arrive at the following conclusions.
-
1.
The broad-band SEDs of PKS 1502+036 and PKS 2004447 resemble more, although less powerful, to the SEDs of the FSRQ class of AGN. A possible interpretation is that they could be the low black hole mass counterparts of powerful FSRQs. However, the potential connection between NLSy1 galaxies and FSRQs needs further detailed investigation.
-
2.
The Compton dominance and X-ray spectral index of PKS 1502+036 and PKS 2004447 are between the values found for 3C 454.3 and Mrk 421. In the -ray luminosity spectral index plane, these sources have luminosities intermediate to that of 3C 454.3 and Mrk 421, however, they have steep -ray spectral index similar to the FSRQ 3C 454.3. On inclusion of the other three -ray emitting NLSy1 galaxies (see Figure 6), we found that -NLSy1 galaxies may have a wider range of -ray luminosities between FSRQs and BL Lacs, however, they have -ray spectral index more like FSRQs. The derived spectral properties of the two sources studied here are, in general, similar to blazars and intermediate between the FSRQ 3C 454.3 and BL Lac Mrk 421. They thus, could fit well into the traditional blazar sequence.
-
3.
In the -ray band, spectral softening when brightening trend is clearly seen for PKS 1502+036. Similar trend is also seen in PKS 2004447 between the available two epochs of observations. This is against the harder when brighter trend seen in the FSRQ 3C 454.3.
References
- Abdo et al. (2009a) Abdo, A. A., et al. 2009a, ApJ, 700, 597
- Abdo et al. (2009b) —. 2009b, ApJ, 699, 976
- Abdo et al. (2009c) —. 2009c, ApJ, 707, L142
- Abdo et al. (2010a) —. 2010a, ApJ, 710, 1271
- Abdo et al. (2010b) —. 2010b, ApJ, 715, 429
- Anderhub et al. (2009) Anderhub, H., et al. 2009, A&A, 498, 83
- Andruchow et al. (2005) Andruchow, I., Romero, G. E., & Cellone, S. A. 2005, A&A, 442, 97
- Arnaud (1996) Arnaud, K. A. 1996, in Astronomical Society of the Pacific Conference Series, Vol. 101, Astronomical Data Analysis Software and Systems V, ed. G. H. Jacoby & J. Barnes, 17
- Atwood et al. (2009) Atwood, W. B., et al. 2009, ApJ, 697, 1071
- Barthelmy et al. (2005) Barthelmy, S. D., et al. 2005, Space Sci. Rev., 120, 143
- Begelman et al. (1984) Begelman, M. C., Blandford, R. D., & Rees, M. J. 1984, Reviews of Modern Physics, 56, 255
- Begelman & Sikora (1987) Begelman, M. C., & Sikora, M. 1987, ApJ, 322, 650
- Błażejowski et al. (2000) Błażejowski, M., Sikora, M., Moderski, R., & Madejski, G. M. 2000, ApJ, 545, 107
- Boettcher et al. (1997) Boettcher, M., Mause, H., & Schlickeiser, R. 1997, A&A, 324, 395
- Boller et al. (1996) Boller, T., Brandt, W. N., & Fink, H. 1996, A&A, 305, 53
- Burrows et al. (2005) Burrows, D. N., et al. 2005, Space Sci. Rev., 120, 165
- Calderone et al. (2011) Calderone, G., Foschini, L., Ghisellini, G., Colpi, M., Maraschi, L., Tavecchio, F., Decarli, R., & Tagliaferri, G. 2011, MNRAS, 413, 2365
- Calderone et al. (2012) Calderone, G., Ghisellini, G., Colpi, M., & Dotti, M. 2012, ArXiv e-prints
- Cardelli et al. (1989) Cardelli, J. A., Clayton, G. C., & Mathis, J. S. 1989, ApJ, 345, 245
- Cash (1979) Cash, W. 1979, ApJ, 228, 939
- Chen & Bai (2011) Chen, L., & Bai, J. M. 2011, ApJ, 735, 108
- Cleary et al. (2007) Cleary, K., Lawrence, C. R., Marshall, J. A., Hao, L., & Meier, D. 2007, ApJ, 660, 117
- Costamante (2009) Costamante, L. 2009, International Journal of Modern Physics D, 18, 1483
- D’Ammando et al. (2012) D’Ammando, F., et al. 2012, MNRAS, 426, 317
- Dermer & Schlickeiser (1993) Dermer, C. D., & Schlickeiser, R. 1993, ApJ, 416, 458
- Dermer et al. (1992) Dermer, C. D., Schlickeiser, R., & Mastichiadis, A. 1992, A&A, 256, L27
- Doi et al. (2006) Doi, A., Nagai, H., Asada, K., Kameno, S., Wajima, K., & Inoue, M. 2006, PASJ, 58, 829
- Doi et al. (2012) Doi, A., Nagira, H., Kawakatu, N., Kino, M., Nagai, H., & Asada, K. 2012, ApJ, 760, 41
- Foschini (2011) Foschini, L. 2011, in Narrow-Line Seyfert 1 Galaxies and their Place in the Universe
- Foschini et al. (2010) Foschini, L., Fermi/Lat Collaboration, Ghisellini, G., Maraschi, L., Tavecchio, F., & Angelakis, E. 2010, in Astronomical Society of the Pacific Conference Series, Vol. 427, Accretion and Ejection in AGN: a Global View, ed. L. Maraschi, G. Ghisellini, R. Della Ceca, & F. Tavecchio, 243–248
- Fossati et al. (1998) Fossati, G., Maraschi, L., Celotti, A., Comastri, A., & Ghisellini, G. 1998, MNRAS, 299, 433
- Gallo et al. (2006) Gallo, L. C., et al. 2006, MNRAS, 370, 245
- Gehrels et al. (2004) Gehrels, N., et al. 2004, ApJ, 611, 1005
- Ghisellini et al. (1998) Ghisellini, G., Celotti, A., Fossati, G., Maraschi, L., & Comastri, A. 1998, MNRAS, 301, 451
- Ghisellini & Madau (1996) Ghisellini, G., & Madau, P. 1996, MNRAS, 280, 67
- Ghisellini & Maraschi (1989) Ghisellini, G., & Maraschi, L. 1989, ApJ, 340, 181
- Ghisellini et al. (2009) Ghisellini, G., Maraschi, L., & Tavecchio, F. 2009, MNRAS, 396, L105
- Ghisellini & Tavecchio (2008) Ghisellini, G., & Tavecchio, F. 2008, MNRAS, 387, 1669
- Ghisellini & Tavecchio (2009) —. 2009, MNRAS, 397, 985
- Ghisellini et al. (2011) Ghisellini, G., Tavecchio, F., Foschini, L., & Ghirlanda, G. 2011, MNRAS, 414, 2674
- Giommi et al. (2012) Giommi, P., Padovani, P., Polenta, G., Turriziani, S., D’Elia, V., & Piranomonte, S. 2012, MNRAS, 420, 2899
- Giroletti et al. (2011) Giroletti, M., et al. 2011, A&A, 528, L11
- Goodrich (1989) Goodrich, R. W. 1989, ApJ, 342, 224
- Grupe & Mathur (2004) Grupe, D., & Mathur, S. 2004, ApJ, 606, L41
- Hayashida (2000) Hayashida, K. 2000, New A Rev., 44, 419
- Healey et al. (2007) Healey, S. E., Romani, R. W., Taylor, G. B., Sadler, E. M., Ricci, R., Murphy, T., Ulvestad, J. S., & Winn, J. N. 2007, ApJS, 171, 61
- Jaffe et al. (2004) Jaffe, W., et al. 2004, Nature, 429, 47
- Jiang et al. (2012) Jiang, N., et al. 2012, ApJ, 759, L31
- Kalberla et al. (2005) Kalberla, P. M. W., Burton, W. B., Hartmann, D., Arnal, E. M., Bajaja, E., Morras, R., & Pöppel, W. G. L. 2005, A&A, 440, 775
- Kimball et al. (2011) Kimball, A. E., Ivezić, Ž., Wiita, P. J., & Schneider, D. P. 2011, AJ, 141, 182
- Komossa et al. (2006) Komossa, S., Voges, W., Xu, D., Mathur, S., Adorf, H.-M., Lemson, G., Duschl, W. J., & Grupe, D. 2006, AJ, 132, 531
- Konigl (1981) Konigl, A. 1981, ApJ, 243, 700
- Landt et al. (2010) Landt, H., Buchanan, C. L., & Barmby, P. 2010, MNRAS, 408, 1982
- Leighly (1999a) Leighly, K. M. 1999a, ApJS, 125, 297
- Leighly (1999b) —. 1999b, ApJS, 125, 317
- Liu et al. (2010) Liu, H., Wang, J., Mao, Y., & Wei, J. 2010, ApJ, 715, L113
- Malmrose et al. (2011) Malmrose, M. P., Marscher, A. P., Jorstad, S. G., Nikutta, R., & Elitzur, M. 2011, ApJ, 732, 116
- Marscher (2009) Marscher, A. P. 2009, arXiv:0909.2576
- Marscher & Gear (1985) Marscher, A. P., & Gear, W. K. 1985, ApJ, 298, 114
- Marscher et al. (2010) Marscher, A. P., et al. 2010, ApJ, 710, L126
- Martin et al. (2005) Martin, D. C., et al. 2005, ApJ, 619, L1
- Massaro et al. (2004a) Massaro, E., Perri, M., Giommi, P., & Nesci, R. 2004a, A&A, 413, 489
- Massaro et al. (2004b) Massaro, E., Perri, M., Giommi, P., Nesci, R., & Verrecchia, F. 2004b, A&A, 422, 103
- Mattox et al. (1996) Mattox, J. R., et al. 1996, ApJ, 461, 396
- Maune et al. (2013) Maune, J. D., Miller, H. R., & Eggen, J. R. 2013, ApJ, 762, 124
- Melia & Konigl (1989) Melia, F., & Konigl, A. 1989, ApJ, 340, 162
- Murphy et al. (2010) Murphy, T., et al. 2010, MNRAS, 402, 2403
- Orienti et al. (2012) Orienti, M., D’Ammando, F., Giroletti, M., & for the Fermi-LAT Collaboration. 2012, ArXiv e-prints
- Oshlack et al. (2001) Oshlack, A. Y. K. N., Webster, R. L., & Whiting, M. T. 2001, ApJ, 558, 578
- Osterbrock & Pogge (1985) Osterbrock, D. E., & Pogge, R. W. 1985, ApJ, 297, 166
- Paliya et al. (2013) Paliya, V. S., Stalin, C. S., Kumar, B., Kumar, B., Bhatt, V. K., Pandey, S. B., & Yadav, R. K. S. 2013, MNRAS, 428, 2450
- Peterson et al. (2000) Peterson, B. M., et al. 2000, ApJ, 542, 161
- Poole et al. (2008) Poole, T. S., et al. 2008, MNRAS, 383, 627
- Pounds et al. (1995) Pounds, K. A., Done, C., & Osborne, J. P. 1995, MNRAS, 277, L5
- Press et al. (1992) Press, W. H., Teukolsky, S. A., Vetterling, W. T., & Flannery, B. P. 1992, Numerical recipes in C. The art of scientific computing
- Roming et al. (2005) Roming, P. W. A., et al. 2005, Space Sci. Rev., 120, 95
- Sahayanathan & Godambe (2012) Sahayanathan, S., & Godambe, S. 2012, MNRAS, 419, 1660
- Shukla et al. (2012) Shukla, A., et al. 2012, A&A, 541, A140
- Sikora et al. (1994) Sikora, M., Begelman, M. C., & Rees, M. J. 1994, ApJ, 421, 153
- Sikora et al. (2009) Sikora, M., Stawarz, Ł., Moderski, R., Nalewajko, K., & Madejski, G. M. 2009, ApJ, 704, 38
- Skrutskie et al. (2006) Skrutskie, M. F., et al. 2006, AJ, 131, 1163
- Stickel et al. (1991) Stickel, M., Padovani, P., Urry, C. M., Fried, J. W., & Kuehr, H. 1991, ApJ, 374, 431
- Stocke et al. (1991) Stocke, J. T., Morris, S. L., Gioia, I. M., Maccacaro, T., Schild, R., Wolter, A., Fleming, T. A., & Henry, J. P. 1991, ApJS, 76, 813
- Urry & Padovani (1995) Urry, C. M., & Padovani, P. 1995, PASP, 107, 803
- Véron-Cetty & Véron (2010) Véron-Cetty, M.-P., & Véron, P. 2010, A&A, 518, A10
- Wagner & Witzel (1995) Wagner, S. J., & Witzel, A. 1995, ARA&A, 33, 163
- Wang et al. (1996) Wang, T., Brinkmann, W., & Bergeron, J. 1996, A&A, 309, 81
- Wright et al. (2010) Wright, E. L., et al. 2010, AJ, 140, 1868
- Xu et al. (2012) Xu, D., Komossa, S., Zhou, H., Lu, H., Li, C., Grupe, D., Wang, J., & Yuan, W. 2012, AJ, 143, 83
- Yuan et al. (2008) Yuan, W., Zhou, H. Y., Komossa, S., Dong, X. B., Wang, T. G., Lu, H. L., & Bai, J. M. 2008, ApJ, 685, 801
- Zhang et al. (2012) Zhang, J., Sun, X. N., Zhang, S. N., & Liang, E. W. 2012, arXiv:1210.5294
- Zhou et al. (2006) Zhou, H., Wang, T., Yuan, W., Lu, H., Dong, X., Wang, J., & Lu, Y. 2006, ApJS, 166, 128