A Monte Carlo study to measure the energy spectra of the primary cosmic-ray components at the knee using a new Tibet AS core detector array
Abstract
A new hybrid experiment has been started by AS experiment at Tibet, China, since August 2011, which consists of a low threshold burst-detector-grid (YAC-II, Yangbajing Air shower Core array), the Tibet air-shower array (Tibet-III) and a large underground water Cherenkov muon detector (MD). In this paper, the capability of the measurement of the chemical components (proton, helium and iron) with use of the (Tibet-III+YAC-II) is investigated by means of an extensive Monte Carlo simulation in which the secondary particles are propagated through the (Tibet-III+YAC-II) array and an artificial neural network (ANN) method is applied for the primary mass separation. Our simulation shows that the new installation is powerful to study the chemical compositions, in particular, to obtain the primary energy spectrum of the major component at the knee.
1 Introduction
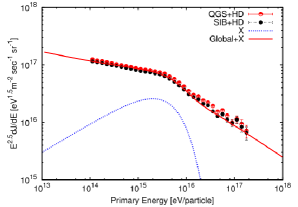
The all-particle energy spectrum of primary cosmic rays is well discriminated by a power law dN/dE E-γ over many orders of magnitude, with changes sharply from 2.7 to 3.1 at about 4 PeV [1]. The break of the all-particle energy spectrum is called the ”knee”, and the corresponding energy range is called ”knee region”. Although the existence of the knee is well confirmed by experiments, there still is controversy on its origin. In order to explain the sharpness of the knee, two scenarios [2] (model A and model B) are proposed as shown in Fig.1 and Fig.2.
In model A, an excess component is assumed to overlap the global component, and its spectrum shape suggests that it can be attributed to nearby source(s) because it is surprisingly close to the expected source spectrum of the diffuse shock acceleration. Middle composition is predicted by this model at the knee. In model B, a hard observed energy spectrum of each element from a given source is assumed. The sharp knee can be explained by a rigidity-dependent acceleration limit and the hard spectrum due to nonlinear effects. Iron-dominant composition is predicted by this model at the knee and beyond. In order to distinguish between Model A and Model B and many other models, measurements of the chemical composition around the knee, especially measurements of the primary spectra of individual component till their knee will be essentially important. Therefore, we have developed the Yangbajing Air shower Core detector (YAC) which is operated along with Tibet air-shower array (Tibet-III) and underground water Cherenkov muon detector array (MD) simultaneously, as shown in Fig.3, and the second phase of YAC is so called YAC-II. In this paper, the capability of the measurement of the chemical components with use of the (Tibet-III+YAC-II) is investigated. The simulation results using (Tibet-III+YAC-II+MD) will be reported in the near further.
2 A New Tibet Hybrid Experiment
The Tibet new hybrid experiment (Tibet-III+YAC-II) has been operated in Tibet, China, since August, 1st, 2011. The merit of this experiment is that the atmosphere depth of the experimental site (4300 m above sea level; 606 g/cm2) is close to the maximum of the air shower development with energies around the knee and the shower maximum values are almost independent of the masses of primary cosmic rays. The Tibet-III consists of 789 detectors while the YAC-II consists of 124 detectors (as shown in Fig.3). The inner 100 plastic scintillator units of YAC-II are arranged as an array (1010 grid) each with an area of 50 cm 80 cm, with 1.875 m interval; and the outer 24 plastic scintillator units are arranged around the inner array each with an area of 50 cm 100 cm. The outer 24 units are used to reject non core events whose shower cores are far from the YAC-II array. Each detector of YAC-II consists of lead plates with a thickness of 3.5 cm above the scintillator to convert high energy electrons and gammas to electromagnetic showers. Each unit of YAC-II is attached with two photomultipliers of high-gain (HAMAMATSU: R4125) and low-gain (HAMAMATSU: R5325) to cover the wide dynamic range from 1 MIP (Minimum Ionization Particle) to 106 MIPs. The hardware of YAC-II is described in [3].
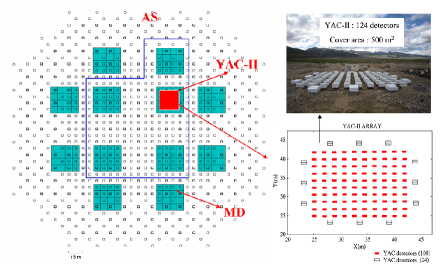
The area of YAC-II array is about 500 m2, locating near the center of the Tibet-III, and operating simultaneously with it. For an air shower event, the Tibet-III provides the arrival direction (), the air shower age () and the air shower size () which is interrelated to primary energy, the YAC-II measures the high energy electromagnetic particles in the core region so as to obtain the characteristic parameters of air-shower cores. When a YAC event is triggered, its accompanying air shower is simultaneously recorded. The matching between an AS and a YAC event is made by their arrival time stamps. The air-shower direction can be estimated with an error smaller than 0.10 above 100 TeV, and the primary energy resolution is estimated to be 12% at energies around 1015 eV by our simulation.
3 Simulation and Analysis
A Monte Carlo (MC) simulation has been carried out on the development of extensive air showers in the atmosphere and the response in YAC-II and Tibet-III. The simulation code CORSIKA (version 6.024) including QGSJET2 hadronic interaction models [4] is used to generate AS events. Considering the aim of this simulation is just to check the capability of the hybrid experiment, QGSJET2 interaction model and heavy dominated (HD) [1] primary composition model are used. Primaries isotropically incident at the top of the atmosphere within the zenith angles from 0 to 60 degrees are injected into the atmosphere. The simulated data were analyzed in the same manner as in the procedure for the experimental data analysis. The electromagnetic showers in the lead layer induced by electrons or photons that hit any detector unit of the array are simulated by a subroutine which is based on the detector simulation code EPICS [5]. The detector performance, the trigger efficiency of detectors and the effective area are adequately taken into account based on the experimental conditions. Normally, the following quantities of YAC-II are used to characterize an air-shower core event:
- the number of shower particles under the lead plate of a detector unit;
- the number of ”fired” detector units with a given threshold value;
top - the maximum burst size among fired detectors;
- the total burst size of all fired detector units;
- the mean lateral spread, =/(-1);
- the mean energy-flow spread,
=()/, where and are the burst size in the fired detector unit and the lateral distance from the air shower core to the center of the fired detector, respectively.
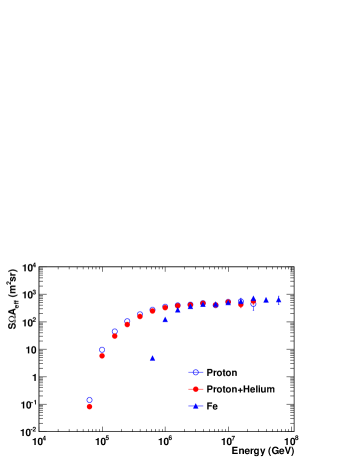
We divided the MC data into two datasets. Due to the difference of the detection efficiency, the first dataset selects events that are enriched with proton+helium origin (called tagged-I dataset), while the second dataset contains events of heavy-primary origin (called tagged-II dataset). The final select conditions for tagged-I and tagged-II are as follows:
(1) 100, 12, top 3000, 1105;
(2) 100, 20, top 1500, 5105.
Besides, the detector unit with top is requested to be located at inner 88 grid for both data-sets. Then, we obtain 1.43105 and 5.17104 events for the tagged-I and tagged-II dataset, respectively. The detection efficiency S is shown in Fig.4 .
The separation of the primary mass is realized by use of a feed-forward artificial neural network (ANN[6]) method, whose applicability to our experiment was well confirmed by the MC simulation [7]. For one thing, we need to separate protons from other nuclei by training the network with a proton flag, and then separate proton+helium from other nuclei by training the network with a proton+helium flag, thus we can get the helium energy spectrum by subtracting the number of proton events from the proton+helium events, so does iron. The following 8 parameters are input to the ANN with 40 hidden nodes and 1 output unit: (1), (2)top, (3), (4), (5), (6), (7), (8), where the first five parameters are given by YAC-II, and the last three are obtained by Tibet-III.
4 Results and Discussion
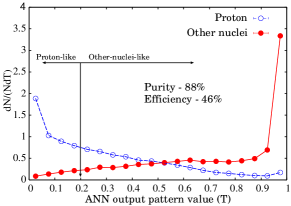
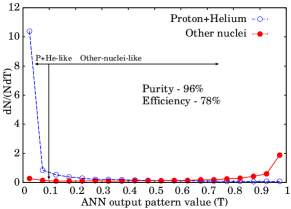
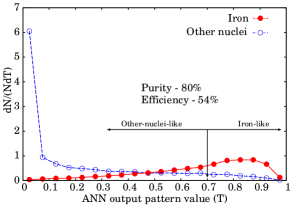
The ANN training results of proton, proton+helium and iron are presented in Fig.5, where average purity and selection efficiency over whole energy range are shown. The ANN output value is used to separate the primary nuclei groups. In this paper, the events with (or ) are regarded as proton or proton+helium group (or iron group). The value , purity (p) and selection rate () of events satisfying the criterion at various energy regions are summarized in Table 1.
| Primary Energy | eV | eV | eV | ||||
| p | p | p | |||||
| P | 0.2 | 87.6 1.1 | 45.5 0.5 | 77.3 5.9 | 19.5 1.2 | ||
| P+He | 0.1 | 96.7 0.8 | 80.8 0.6 | 87.3 3.5 | 39.1 1.3 | ||
| Fe | 0.7 | 81.6 1.6 | 55.3 1.0 | 81.6 8.5 | 69.4 7.0 | ||
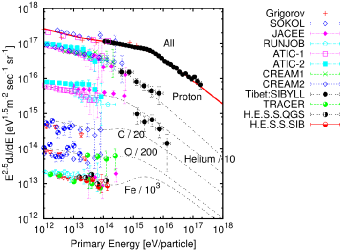
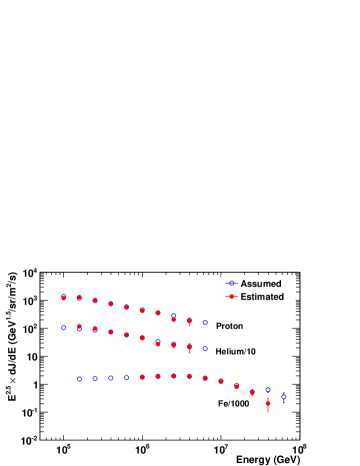
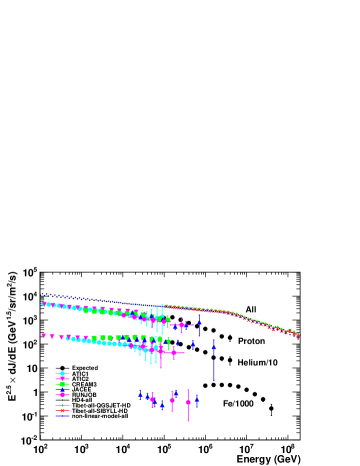
The Fig.6 shows the estimated primary energy spectra of proton, helium and iron compared with the assumed ones. One can see that the assumed primary energy spectrum of proton, helium and iron are well reproduced by the estimated ones respectively, and the estimated ones could well connect with the results obtained by direct observation, as shown in Fig.7. It needs to be remarked that the iron spectra seem to be higher than the observed ones, just because of the HD model we used. The results above show that the new burst detector array is powerful to study the chemical composition, in particular, to obtain the primary energy spectrum of the major component at the knee.
5 Acknowledgements
This work is supported by the Chinese Academy of Sciences (H9291450S3) and the Key Laboratory of Particle Astrophysics, Institute of High Energy Physics, CAS. The Knowledge Innovation Fund (H95451D0U2 and H8515530U1) of IHEP, China and the project Y0293900TF of NSFC also provide support to this study.
References
- [1] M. Amenomori et al., ApJ., 678:1165-1179, 2008.
- [2] M. Shibata, Y. Katayose, J. Huang and D. Chen, ApJ., 716, 1076 C1083, 2010.
- [3] M. Amenomori et al., ICRC 32 (HE 1.4 ID: 1241), 2011.
- [4] D. Heck et al., Report FZKA 6019, 1998; J. Knapp, D. Heck et al., Report FZKA 3640, 1997; D. Heck et al., Report FZKA 5828, Forshungszentru Karldruhe, 1996. Available from http://www-ik3.fzk.deheck/corsika /physics-description/corsika-phys.html.
- [5] K. Kasahara et al., http://eweb.b6.kanagawa-u.ac.jp/ Kasahara/ResearchHome/EPICSHome/Index.html.
- [6] L. Lonnblad et al., Comp. Phys. Com. 81, 185 (1994).
- [7] M. Amenomori et al., Physics Letters B, 632, 58-64, 2006.