BSG alignment of SDSS galaxy groups
Abstract
We study the alignment signal between the distribution of brightest satellite galaxies (BSGs) and the major axis of their host groups using SDSS group catalog constructed by Yang et al. (2007). After correcting for the effect of group ellipticity, a statistically significant () major-axis alignment is detected and the alignment angle is found to be . More massive and richer groups show stronger BSG alignment. The BSG alignment around blue BCGs is slightly stronger than that around red BCGs. And red BSGs have much stronger major-axis alignment than blue BSGs. Unlike BSGs, other satellites do not show very significant alignment with group major axis. We further explore the BSG alignment in semi-analytic model (SAM) constructed by Guo et al. (2011). We found general good agreement with observations: BSGs in SAM show strong major-axis alignment which depends on group mass and richness in the same way as observations; and none of other satellites exhibit prominent alignment. However, discrepancy also exists in that the SAM shows opposite BSG color dependence, which is most probably induced by the missing of large scale environment ingredient in SAM. The combination of two popular scenarios can explain the detected BSG alignment. The first one: satellites merged into the group preferentially along the surrounding filaments, which is strongly aligned with the major axis of the group. The second one: BSGs enter their host group more recently than other satellites, then will preserve more information about the assembling history and so the major-axis alignment. In SAM, we found positive evidence for the second scenario by the fact that BSGs merged into groups statistically more recently than other satellites. We also found that most of BSGs () were BCGs before they merged into groups and earlier merged BSGs tend to be closer to their BCGs than other BSGs. On the other hand, although is opposite in SAM, the BSG color dependence in observation might indicate the first scenario as well.
Subject headings:
BSG – alignment – group of galaxies – SAM – SDSS1. Introduction
In the current understanding of the hierarchical structure formation scenario of cold dark matter (CDM), small dark matter halos form first from the anisotropic collapse of overdensities in the mass distribution, while larger halos grow by accreting surrounding material and/or by merging with other halos. It is well believed that satellites in clusters or groups trace the distribution of dark matter halos. Therefore, it is popular to study the shape or mass distribution of dark matter halos using the distribution or kinematics of satellite galaxies (Plionis et al. 2004, 2006; Wang et al. 2008; Ragone-Figueroa et al. 2010; More et al. 2009a, b, 2011; Dutton et al. 2010; Schneider et al. 2012; Guo et al. 2012). Among others, a power tool is to measure the alignment signals between the distribution of satellites and the reference directions, e.g. the major axes of central galaxies, groups or halos, etc.
Intrinsic alignment of galaxies relative to their host dark matter halos encodes plenty of information of galaxy formation and evolution history and their surrounding filamentary structures (Aragón-Calvo et al. 2007; Bailin & Steinmetz 2005; Lee et al. 2008; Slosar & White 2009; Vera-Ciro et al. 2011; Libeskind et al. 2012). Observationally, three types of alignment have been extensively studied in the literatures: (1) the satellite alignment, between the distribution of all satellite galaxies and the major axis of their central galaxy (Holmberg 1969; Sharp et al. 1979; MacGillivray et al. 1982; Zaritsky et al. 1997; Sales & Lambas 2004, 2009; Brainerd 2005; Yang et al. 2006; Agustsson & Brainerd 2010; Azzaro et al. 2007; Faltenbacher et al. 2007, 2009; Wang et al. 2008; Steffen & Valenzuela 2008; Wang et al. 2010; Nierenberg et al. 2011; Hao et al. 2011); (2) the radial alignment, between the orientation of satellite galaxies and the central-satellite connection line or the orientation of brightest central galaxies (BCGs) (Pereira & Kuhn 2005; Agustsson & Brainerd 2006b; Faltenbacher et al. 2007; Hao et al. 2011); (3) the alignment between the shape of groups and the large scale structure (Paz et al. 2008, 2011; Faltenbacher et al. 2009; Wang et al. 2009). It is notable that the measurements of alignment between satellites and their host galaxies have a long and confused history. Some studies reported a minor axis alignment, while most of others preferred a major axis alignment. We refer those who are interested in this history to Yang et al. (2006) and Wang et al. (2008) for summaries. Now it is clear that the satellites preferentially lie along the major axis of host galaxies, i.e. a major axis alignment. Moreover, the alignment depends on the properties of the host halos, such as halo mass, color of central galaxies and satellites. For example, more massive halos usually show stronger alignment, and red BCGs and satellites show stronger alignment than the blue ones. These are consistent with the simulation results, where the distribution of subhalos is aligned with major axis of their host halos and more massive halos show a stronger alignment signal (Libeskind et al. 2005; Wang et al. 2005; Zentner et al. 2005; Kang et al. 2007; Faltenbacher et al. 2008; Knebe et al. 2008a, b, 2010).
Many dynamical processes can contribute to the alignment of satellites associated with groups, which can be roughly divided into two classes - large scale environment and the impact of group potential (Hartwick 2000; Wang et al. 2010). The filamentary structures surrounding the group may readjust the satellites pointing toward the group. Additionally, the anisotropic accretion along these filaments will make the satellites preferentially distributed along the group major axis. While, phase-mixing effect and relaxation will smear the memory of assembling history of satellites when they merged into the potential well of the groups. In this respect, more recently accreted or merged satellites contain more information about the assembling history and should show stronger alignment with the major axis of the host halo than other satellites.
It is expected that the brightest satellite galaxies (BSGs) enter the host group mainly through major mergers and play a determinant role in shaping the host group. If the BSGs enter the host halos statistically more recently, they will preserve the most information about the merger history. In this case, BSGs will be good tracers of the structure formation of their host groups.
In this paper, we investigate the alignment of BSGs with the major axis of their host groups using the SDSS DR4 galaxy group catalog constructed by Yang et al. (2007). Different from the previous satellite alignment measurements, we focus on the alignment signal between the distribution of BSGs and the major axis of their host halos, not the major axis of the central galaxies. While the major axis of the central galaxy itself is misaligned with the projected major axis of the host, e.g. at the level of (Wang et al., 2008). Our observational measurements are then compared with the BSG alignment in semi-analytic model (SAM) of galaxy formation catalog constructed by Guo et al. (2011). We also investigate the distribution of the time when BSGs merged and compare them with those for other satellites in SAM.
This paper is organized as following. In §2, we introduce the SDSS group catalog and SAM model briefly. The alignment estimator we used is described in §3. Then we show the results of BSG alignment in SDSS groups in §4 and in SAM in §5. In §5 we also show the distribution of BSG merger time. Finally a brief summary and discussions are given in §6.
2. Data
2.1. Groups of galaxies
Our analysis is based on the SDSS DR4 galaxy group catalog, which is constructed by Yang et al. (2007) (hereafter Y07) using an adaptive halo-based group finder (Yang et al. 2005). For a full description of the catalog the reader is referred to their paper, but the major part of the catalog is presented briefly here.
The base galaxy catalog is the New York University Value-Added Galaxy Catalogue of SDSS-DR4 (NYU-VAGC; Blanton et al. 2005). As described in Y07, three group samples were constructed: Sample I, which only uses the 362,356 galaxies with measured -band magnitudes and redshifts from the SDSS, Sample II which also includes 7,091 galaxies with SDSS -band magnitudes and redshifts taken from other surveys, and Sample III which includes an additional 38672 galaxies that fail to get redshifts due to fiber collisions and are assigned the redshifts of their nearest neighbors (Zehavi et al. 2005). Our analysis is based on Sample III.
All magnitudes are extinction corrected (Schlegel et al. 1998) and k-corrected (Blanton et al. 2003a) and evolved to rest-frame magnitudes at using the evolving luminosity model of Blanton et al. (2003b). Stellar mass of galaxies are estimated according to the fitting formula of Bell et al. (2003). The galaxies are assigned red or blue color according to their bi-normal distribution in the color (Baldry et al. 2004; Li et al. 2006). The galaxy is red if , where , and blue otherwise (Yang, Mo, & van den Bosch, 2008). The dark matter halo mass of group is estimated based on the ranking of the characteristic group stellar mass. Survey edge effects have been taken into account by removing groups () that suffer severely from edge effects. Since the redshifts assigned according to the nearest neighbors are not very reliable, we discard groups whose brightest or second brightest galaxies have assigned redshifts. The total number of groups in the resulted catalog is 8,513.
The brightest galaxy in the group is taken as the central galaxy and all others are satellite galaxies. In addition, we also considered the most massive galaxy (in terms of stellar mass) as the central galaxy (MCG). As we have checked, the difference of the alignment signals between the luminosity (e.g. BCG) and stellar mass (e.g. MCG) indicators is too small to be noted.
2.2. Semi-analytic model
The semi-analytic catalog of galaxy population used in this paper was constructed by Guo et al. (2011) based on the combination of Millennium (MS) and MS-II simulation. The MS and MS-II simulation are run by the Virgo Consortium (Boylan-Kolchin et al. 2009) and both contain particles. They adopted the same cosmology with parameters , , , , , and . MS has a box size of and each particle has mass , while the box size of MS-II is and particle mass is . Dark matter halos in MS and MS-II simulation are found by a friend-of-friend (FOF) method with linking length being 0.2 times of the mean separation of particles (Davis et al. 1985). The SUBFIND algorithm (Springel et al. 2001) was applied to each group to identify all bound substructures (subhalos).
The galaxy formation models are implemented by allowing the galaxies to grow at the potential minima of the halos and subhalos in simulation. Each FOF group contains a central galaxy at the potential minimum of its main subhalo. Other satellite galaxies may reside at the potential minima of satellite subhalos, or be “orphans” which no longer correspond to any subhalos. Various semi-analytic effects are considered, such as tidal torque, dynamical friction, star formation, gastrophysics, supernova and active galactic nucleus feedback and galaxy mergers and etc. We refer those who are interested to Guo et al. (2011) for more details about the SAM catalog. Here galaxies are also assigned red and blue colors according to the color bi-normal distributions within these SAM galaxies.
3. Method
For a given galaxy group, the principal axis and its orientation on the sky can be calculated from the inertia tensor
| (1) |
where is the number of group members, are the projected coordinates (with BCG as origin) of the nth satellite galaxy, and is the distance between BCG and group members. The weight is used to avoid overweighting on the group members at outskirts. The semi-major and semi-minor axes of the ellipse, and , can be derived by solving the eigenvalue problem,
| (2) |
The direction of the major axis is given by the eigenvector , while the ellipticity, , and the axis ratio, , are
| (3) |
We quantify the distribution of BSGs relative to the group major axes by the distribution function,
| (4) |
where is the angle between the group major axis and the BSG-BCG connection line. The angle is constrained in the range , where indicates that the BSGs lie along the major (minor) axis of the host group.
The strength of alignment can be quantified by the average of ,
| (5) |
Then indicates the alignment of BSGs with the group major axes, otherwise minor axes. The alignment is stronger if is further from and there is no alignment at all if . This estimator works well only if the groups are spherical. For elliptical groups, the alignment angle defined as this will generally depart from , even if the BSGs are randomly distributed. To consider the effect of group shape, one can generate mock samples in which the BSGs are randomly distributed according to the projected two dimensional axes of groups. To get the true alignment signals of the BSGs with respect to other satellite galaxies in the non-spherical groups, we define with the normalization factor , which can be calculated by , and the alignment angle . In practice, we construct mock catalog by randomly selecting the satellites as the BSGs in the groups, which reflect the distribution of all satellites. The ellipticity effect and shot noise are included automatically. The distribution functions for these mock samples are measured and averaged to get the mean angle, , which are merely contributed by the shape of groups. We generated 1000 mock samples to calculate the errors of distribution function and alignment angle.
4. Alignment of BSGs in SDSS groups
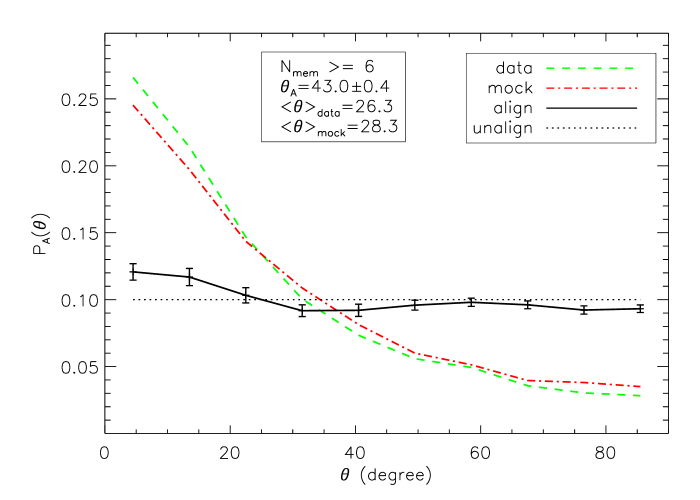
In this section, we study the alignment signal between BSG-BCG connection line and the major axis of the host group. Firstly we measure the distribution function and alignment signal for the full sample in which each group has at least 6 members. The results are shown in FIG. 1. The true alignment distribution function, , is shown as black solid line with error bars come from 1000 mock samples. A significant group major axis alignment of BSGs is detected. This can be seen from the shape of the alignment distribution function, and the resulting alignment angle which is and smaller than .
As a comparison, the distribution functions, , for data and mock sample are also shown in FIG. 1 as green dashed line and red dot-dashed line respectively. Although the distribution function for data is much steeper and the corresponding mean angle, , is much smaller, when the ellipticity effect is subtracted using mock sample, the true alignment signal is reconstructed.
In the following we explore the dependence of BSG alignment on various group properties, including halo mass of groups in §4.1, BCG and BSG color in §4.2 and group richness in §4.3. To answer the question whether the BSGs are different from other satellites, we compare the alignment signal of BSG with that of other satellites in §4.4.
4.1. Dependence on group mass
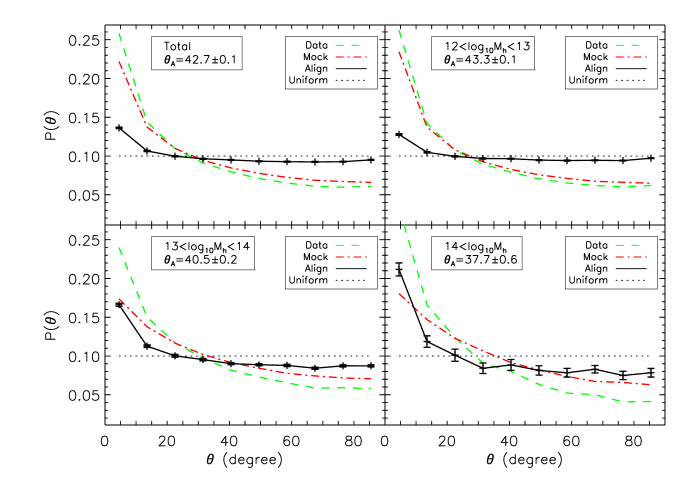
Previous alignment studies in groups, which measure the alignment between the distributions of satellites and the major axes of central galaxies, have shown clear mass dependence, i.e., the alignment is stronger in more massive groups (Yang et al. 2006; Wang et al. 2008 and references there in). In this section, we explore whether this mass dependence exists for BSG alignment. Limited by the size of SDSS group catalog, we divide them in to 2 subsamples according to their halo mass. Low mass sample contains groups with mass and high mass sample contains others. Where is halo mass with unit . The BSG alignment for them are shown in FIG. 2.

4.2. Dependence on BCG and BSG color
In this section we study how the BSG alignment depends on the color of BCG and BSG. Following Yang et al. (2006) and Wang et al. (2008), we divide the groups into four subsamples according to the color of BCGs and BSGs and measure the alignment signal of BSGs for them. The results are shown in FIG. 3. BSGs in groups with either red BCGs or blue BCGs show significant alignment with major axis of their host groups, with a little bit stronger alignment in groups with blue BCGs. On the other hand, the results do show quite prominent BSG color dependence in that red BSGs show much stronger alignment with major axis of their host groups.

4.3. Effect of group richness
To study the effect of group richness, we construct subsamples for groups with different richness and compare the alignment signal for them. The results for groups with at least 6, 8, 10 and 12 members are shown in FIG. 4. Although the measurement errors for rich groups are relatively larger, the trend that BSGs in richer groups are more strongly aligned with the major axis of their host groups, is clearly shown.

4.4. Comparison with other satellites
Finally, we study the alignment of other satellites with respect to the group major axis to see whether the BSG is special in this respect. In FIG. 5, we show the results for the second to fifth brightest satellites. Interestingly, all of them do not show any significant alignment, with alignment angles consistent with at 2- level.

5. BSG Alignment and Merger time in SAM
In this section, we study the BSG alignment with group major axis in SAM galaxy formation model constructed by Guo et al. (2011). To explore the origin of the BSG alignment, we also measure the time when BSGs merged into their host halos.
5.1. BSG Alignment
In SAM galaxy formation model, we select groups which have at least 6 members with stellar mass greater than . The group major axis is estimated using the method discussed in §3. BSGs are selected by their rank of stellar mass in each group. The BSG alignment with group major axis in SAM and their dependence on group halo mass are shown in FIG. 6. Clearly, BSGs show major-axis alignment and the alignment angle is . Furthermore, more massive groups show stronger BSG alignment. Especially in massive groups with , the alignment angle is much smaller than that obtained in SDSS observation. This can be understood in several ways. The first possibility is that as discussed in Kang et al. (2007), the various observational selection effects the group catalog suffered from, such as interlopers (groups members do not actually belong to the same group) and incompleteness, tend to blur the true alignment signal. Additionally, the hydrodynamical simulations, including baryon physics, have indicated that the condensation of baryons tend to make halo more spherical or axisymmetric and cause the misalignment between observations and N-body simulations (Lin et al. 2006; Debattista et al. 2008; Pedrosa et al. 2010; Tissera et al. 2010; Bryan et al. 2012; Bryan et al. 2013; Zemp et al. 2012 and references therein).
In FIG. 7, we show the color dependence of the alignment signals. First, for BCGs of different colors, the BSG alignments are quite similar to observations and no significant color dependence is found. Second, for BSGs of different colors, quite similar to the observations, there exhibit prominent color dependence, however, in opposite direction. This discrepancy is quite interesting. As the stronger alignment of the BSGs with respect to the group major axes indicates the more recent accretion along the filaments, both results in SDSS observation and SAM are rather expected. In observation, the real Universe, these BSGs before their accretion into groups, are preferentially located in filaments where the gas temperature might be quite high due to shock heating, etc., and are thus quenched and red. On the other hand, in SAM, although these BSGs before accretion might also be preferentially located in the filaments, since SAM only make use of the halo merger trees where such kind of filament environment is not taken into account, and thus these BSGs (BCGs before accretion) might still be star forming and blue.
Finally we show in FIGs. 8 and 9 the richness dependence of the BSGs and the alignment signals of other satellite galaxies. All these results are quite similar to those obtained from the SDSS observations, except that the second brightest satellite galaxies in SAM still show some weak major-axis alignment.


5.2. BSG Merger Time
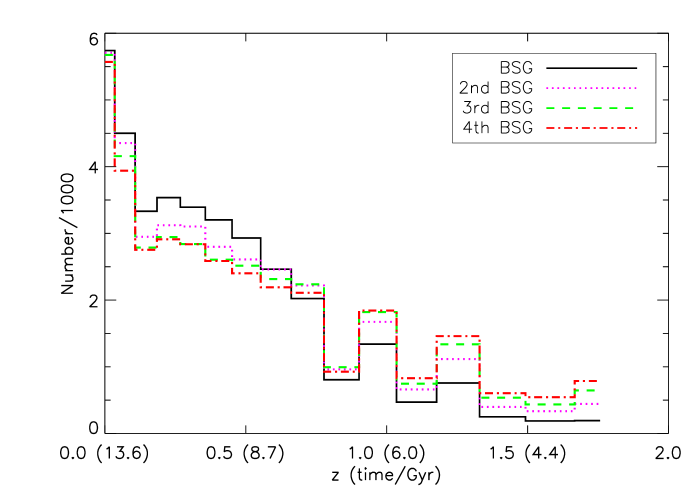
Now we explore the time when BSGs merged into the host halos. We select all FOF halos with mass larger than at . We look back the progenitors of BCG and BSG in each FOF halo along the merger tree, until we find the snapshot in which the progenitors of BCG and BSG belong to different halos for the first time. Then we define this snapshot as the BSG merger snapshot. We also get the merger time for other satellites (the second, third and fourth brightest in r band magnitude) using the same method. The distributions of merger time for the BSGs and other satellites are shown in FIG. 10. Here one can see that there are more BSGs merged at low redshifts than other satellites. The average time when BSGs merged is 9.87 Gyrs. While for the second, third and fourth BSGs, the average merger time are 9.58, 9.37 and 9.23 Gyrs respectively. These support the conjecture that BSGs merged into the groups statistically more recently than other satellites, although the signal is weak. Furthermore, BSGs in their progenitor halos are BCGs before they merged with other halos.
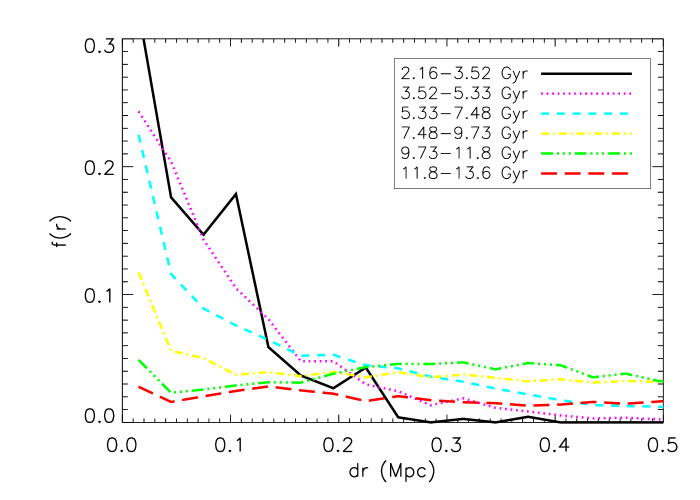
Finally, we check the scenario that earlier merged BSGs are closer to BCGs at redshift , by dividing the SAM catalog into 6 subsamples according to the time when BSGs merged and calculating the distribution function of distances between BCGs and BSGs at . As shown in FIG. 11, most of earlier merged BSGs are located within 0.2 Mpc to their BCGs. While only a tiny fraction of later merged BSGs are located within 0.2 Mpc to their BCGs and most of them are far from the BCGs.
6. Summary and Discussions
In this work, we studied the alignment of BSG-BCG connection line with group major axis using the SDSS DR4 group catalog constructed by Y07 and the SAM constructed by Guo et al. (2011). We found good agreement of major-axis alignment of BSGs in observations and SAM. We also studied the distribution of merger time for BSGs and other satellites in SAM and found positive evidence to support the scenario that BSGs merged into their host groups more recently than other satellites, and preferentially along the filaments. The main results are summarized as following:
-
•
A significant group major-axis alignment of BSG is detected. The alignment angle is . The confidence level of BSG alignment detection reaches , owing to the large group catalog. BSGs in more massive groups and richer groups show stronger alignment with the major axis of their host groups. Furthermore, the BSG alignment around blue BCGs is slightly stronger than that around red BCGs. And red BSGs have much stronger major-axis alignment than blue BSGs.
It is worth to distinguish our BSG alignment from other satellite alignment measurements. Most of them reflect the global distribution of all satellites along the major or minor axes of groups, while we measure the preference of BSG distribution along the major or minor axes relative to the other satellites.
-
•
Satellites other than BSGs do not show any significant alignment. This may indicate that the BSGs are quite different from other satellites in the formation history of groups.
-
•
In SAM, BSGs are found to have major-axis alignment with similar strength as in observations. The alignment show strong dependence on group mass and richness in the same way as observations, except that this dependence in SAM is stronger.
-
•
Discrepancy also exists in that the SAM shows opposite BSG color dependence, which is most probably induced by the fact that SAM does not contain any large scale environment ingredient.
-
•
BSGs in SAM are found to be merged into the host halos statistically more recently. And most of the BSGs () were BCGs before their merger and earlier merged BSGs are closer to their BCGs at redshift .
The detected alignment of BSGs along the group major axes and no alignment for other satellites can be understood if the two popular scenarios of galaxy formation are both true. The first scenario is that the accretion of satellites are preferentially along the filamentary structures surrounding the dark matter halos of host galaxies. The second one is that most massive satellites are accreted into the host halos more recently and so they have experienced less phase-mixing and relaxation and better preserved the memory of their accretion history. Using SAM galaxy catalog, we find positive evidence to support the second scenario. To fully understand the detected alignment of BSGs, detailed analysis of the accretion history of BSGs in SAM are necessary, which is beyond the scope of this paper. However, although is opposite in SAM, the BSG color dependence in observation might indicate the first scenario as well.
Acknowledgments
We thank the referee for the comments and suggestions, which helped to improve the paper. We thank Qi Guo for her kind help of using SAM data and STAR cluster and giving us so many good suggestions and comments. This work is supported by the National Science Foundation of China (NSFC, Nos. 11073024, 11121062, 11233005). XC also acknowledges the support from the John Templeton Foundation. Y.G.W. acknowledges the support by the National Science Foundation of China (Grant No. Y011061001 and No. Y122071001). XW is supported by Gordon and Betty Moore Foundations.
References
- Agustsson & Brainerd (2006a) Agustsson I., Brainerd T. G., 2006a, ApJ, 650, 550
- Agustsson & Brainerd (2006b) Agustsson I., Brainerd T. G., 2006b, ApJ, 644, L25
- Agustsson & Brainerd (2010) Agustsson I., Brainerd T. G., 2010, ApJ, 709, 1321
- Aragón-Calvo et al. (2007) Aragón-Calvo M. A., van de Weygaert R., Jones B. J. T., van der Hulst J. M., 2007, ApJ, 655, L5
- Azzaro et al. (2007) Azzaro M., Patiri S. G., Prada F., Zentner A. R., 2007, MNRAS, 376, L43
- Bailin & Steinmetz (2005) Bailin J., Steinmetz M., 2005, ApJ, 627, 647
- Baldry et al. (2004) Baldry I. K., Glazebrook K., Brinkmann J., Ivezić Ž., Lupton R. H., Nichol R. C., Szalay A. S., 2004, ApJ, 600, 681
- Bell et al. (2003) Bell E. F., McIntosh D. H., Katz N., Weinberg M. D., 2003, ApJS, 149, 289
- Bett (2012) Bett P., 2012, MNRAS, 420, 3303
- Blanton et al. (2003a) Blanton M. R. et al., 2003a, AJ, 125, 2348
- Blanton et al. (2003b) Blanton M. R. et al., 2003b, ApJ, 592, 819
- Blanton et al. (2005) Blanton M. R. et al., 2005, AJ, 129, 2562
- Boylan-Kolchin et al. (2009) Boylan-Kolchin M., Springel V., White S. D. M., Jenkins A., Lemson G., 2009, MNRAS, 398, 1150
- Brainerd (2005) Brainerd T. G., 2005, ApJ, 628, L101
- Bryan et al. (2012) Bryan S. E., Mao S., Kay S. T., Schaye J., Dalla Vecchia C., Booth C. M., 2012, MNRAS, 422, 1863
- Bryan et al. (2013) Bryan, S. E., Kay, S. T., Duffy, A. R., et al. 2013, MNRAS, 566
- Davis et al. (1985) Davis M., Efstathiou G., Frenk C. S., White S. D. M., 1985, ApJ, 292, 371
- Deason et al. (2011) Deason A. J. et al., 2011, MNRAS, 415, 2607
- Debattista et al. (2008) Debattista V. P., Moore B., Quinn T., Kazantzidis S., Maas R., Mayer L., Read J., Stadel J., 2008, ApJ, 681, 1076
- Dutton et al. (2010) Dutton A. A., Conroy C., van den Bosch F. C., Prada F., More S., 2010, MNRAS, 407, 2
- Faltenbacher et al. (2008) Faltenbacher A., Jing Y. P., Li C., Mao S., Mo H. J., Pasquali A., van den Bosch F. C., 2008, ApJ, 675, 146
- Faltenbacher et al. (2007) Faltenbacher A., Li C., Mao S., van den Bosch F. C., Yang X., Jing Y. P., Pasquali A., Mo H. J., 2007, ApJ, 662, L71
- Faltenbacher et al. (2009) Faltenbacher A., Li C., White S. D. M., Jing Y.-P., Shu-DeMao, Wang J., 2009, Research in Astronomy and Astrophysics, 9, 41
- Guo et al. (2012) Guo Q., Cole S., Eke V., Frenk C., 2012, ArXiv e-prints
- Guo et al. (2011) Guo Q. et al., 2011, MNRAS, 413, 101
- Hao et al. (2011) Hao J., Kubo J. M., Feldmann R., Annis J., Johnston D. E., Lin H., McKay T. A., 2011, ApJ, 740, 39
- Hartwick (2000) Hartwick F. D. A., 2000, AJ, 119, 2248
- Holmberg (1969) Holmberg E., 1969, Arkiv for Astronomi, 5, 305
- Kang et al. (2007) Kang X., van den Bosch F. C., Yang X., Mao S., Mo H. J., Li C., Jing Y. P., 2007, MNRAS, 378, 1531
- Knebe et al. (2008a) Knebe A., Draganova N., Power C., Yepes G., Hoffman Y., Gottlöber S., Gibson B. K., 2008a, MNRAS, 386, L52
- Knebe et al. (2010) Knebe A., Libeskind N. I., Knollmann S. R., Yepes G., Gottlöber S., Hoffman Y., 2010, MNRAS, 405, 1119
- Knebe et al. (2008b) Knebe A., Yahagi H., Kase H., Lewis G., Gibson B. K., 2008b, MNRAS, 388, L34
- Lee et al. (2008) Lee J., Springel V., Pen U.-L., Lemson G., 2008, MNRAS, 389, 1266
- Li et al. (2006) Li C., Kauffmann G., Jing Y. P., White S. D. M., Börner G., Cheng F. Z., 2006, MNRAS, 368, 21
- Libeskind et al. (2005) Libeskind N. I., Frenk C. S., Cole S., Helly J. C., Jenkins A., Navarro J. F., Power C., 2005, MNRAS, 363, 146
- Libeskind et al. (2012) Libeskind N. I., Hoffman Y., Knebe A., Steinmetz M., Gottlöber S., Metuki O., Yepes G., 2012, MNRAS, 421, L137
- Lin et al. (2006) Lin W. P., Jing Y. P., Mao S., Gao L., McCarthy I. G., 2006, ApJ, 651, 636
- MacGillivray et al. (1982) MacGillivray H. T., Dodd R. J., McNally B. V., Corwin, Jr. H. G., 1982, MNRAS, 198, 605
- Mandelbaum et al. (2006a) Mandelbaum R., Hirata C. M., Broderick T., Seljak U., Brinkmann J., 2006a, MNRAS, 370, 1008
- Mandelbaum et al. (2006b) Mandelbaum R., Hirata C. M., Ishak M., Seljak U., Brinkmann J., 2006b, MNRAS, 367, 611
- More et al. (2009a) More S., van den Bosch F. C., Cacciato M., 2009a, MNRAS, 392, 917
- More et al. (2009b) More S., van den Bosch F. C., Cacciato M., Mo H. J., Yang X., Li R., 2009b, MNRAS, 392, 801
- More et al. (2011) More S., van den Bosch F. C., Cacciato M., Skibba R., Mo H. J., Yang X., 2011, MNRAS, 410, 210
- Nierenberg et al. (2011) Nierenberg A. M., Auger M. W., Treu T., Marshall P. J., Fassnacht C. D., 2011, ApJ, 731, 44
- Okumura et al. (2009) Okumura T., Jing Y. P., Li C., 2009, ApJ, 694, 214
- Paz et al. (2011) Paz D. J., Sgró M. A., Merchán M., Padilla N., 2011, MNRAS, 414, 2029
- Paz et al. (2008) Paz D. J., Stasyszyn F., Padilla N. D., 2008, MNRAS, 389, 1127
- Pedrosa et al. (2010) Pedrosa S., Tissera P. B., Scannapieco C., 2010, MNRAS, 402, 776
- Pereira & Kuhn (2005) Pereira M. J., Kuhn J. R., 2005, ApJ, 627, L21
- Plionis et al. (2006) Plionis M., Basilakos S., Ragone-Figueroa C., 2006, ApJ, 650, 770
- Plionis et al. (2004) Plionis M., Basilakos S., Tovmassian H. M., 2004, MNRAS, 352, 1323
- Ragone-Figueroa et al. (2010) Ragone-Figueroa C., Plionis M., Merchán M., Gottlöber S., Yepes G., 2010, MNRAS, 407, 581
- Sales & Lambas (2004) Sales L., Lambas D. G., 2004, MNRAS, 348, 1236
- Sales & Lambas (2009) Sales L., Lambas D. G., 2009, MNRAS, 395, 1184
- Schlegel et al. (1998) Schlegel D. J., Finkbeiner D. P., Davis M., 1998, ApJ, 500, 525
- Schneider et al. (2012) Schneider M. D., Frenk C. S., Cole S., 2012, J. Cosmology Astropart. Phys, 5, 30
- Sharp et al. (1979) Sharp N. A., Lin D. N. C., White S. D. M., 1979, MNRAS, 187, 287
- Slosar & White (2009) Slosar A., White M., 2009, J. Cosmology Astropart. Phys, 6, 9
- Springel et al. (2001) Springel V., White S. D. M., Tormen G., Kauffmann G., 2001, MNRAS, 328, 726
- Steffen & Valenzuela (2008) Steffen J. H., Valenzuela O., 2008, MNRAS, 387, 1199
- Tissera et al. (2010) Tissera P. B., White S. D. M., Pedrosa S., Scannapieco C., 2010, MNRAS, 406, 922
- Vera-Ciro et al. (2011) Vera-Ciro C. A., Sales L. V., Helmi A., Frenk C. S., Navarro J. F., Springel V., Vogelsberger M., White S. D. M., 2011, MNRAS, 416, 1377
- Wang et al. (2005) Wang H. Y., Jing Y. P., Mao S., Kang X., 2005, MNRAS, 364, 424
- Wang et al. (2010) Wang Y., Park C., Hwang H. S., Chen X., 2010, ApJ, 718, 762
- Wang et al. (2009) Wang Y., Park C., Yang X., Choi Y.-Y., Chen X., 2009, ApJ, 703, 951
- Wang et al. (2008) Wang Y., Yang X., Mo H. J., Li C., van den Bosch F. C., Fan Z., Chen X., 2008, MNRAS, 385, 1511
- Yang et al. (2005) Yang, X., Mo, H. J., van den Bosch, F. C., & Jing, Y. P. 2005, MNRAS, 356, 1293
- Yang et al. (2006) Yang X., van den Bosch F. C., Mo H. J., Mao S., Kang X., Weinmann S. M., Guo Y., Jing Y. P., 2006, MNRAS, 369, 1293
- Yang et al. (2007) Yang X., Mo H. J., van den Bosch F. C., Pasquali A., Li C., Barden M., 2007, ApJ, 671, 153
- Yang, Mo, & van den Bosch (2008) Yang X., Mo H. J., van den Bosch F. C., 2008, ApJ, 676, 248
- Zaritsky et al. (1997) Zaritsky D., Smith R., Frenk C. S., White S. D. M., 1997, ApJ, 478, L53
- Zehavi et al. (2005) Zehavi I. et al., 2005, ApJ, 630, 1
- Zemp et al. (2012) Zemp M., Gnedin O. Y., Gnedin N. Y., Kravtsov A. V., 2012, ApJ, 748, 54
- Zentner et al. (2005) Zentner A. R., Kravtsov A. V., Gnedin O. Y., Klypin A. A., 2005, ApJ, 629, 219