Apparent increase in the thickness of superconducting particles at low temperatures measured by electron holography
Abstract
We predict that superconducting particles will show an apparent increase in thickness at low temperatures when measured by electron holography. This will result not from a real thickness increase, rather from an increase in the mean inner potential sensed by the electron wave traveling through the particle, originating in expansion of the electronic wavefunction and resulting negative charge expulsion from the interior to the surface of the superconductor, giving rise to an increase in the phase shift of the electron wavefront going through the sample relative to the wavefront going through vacuum. The temperature dependence of the observed phase shifts will yield valuable new information on the physics of the superconducting state of metals.
I introduction
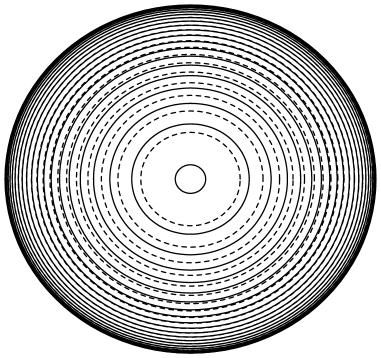
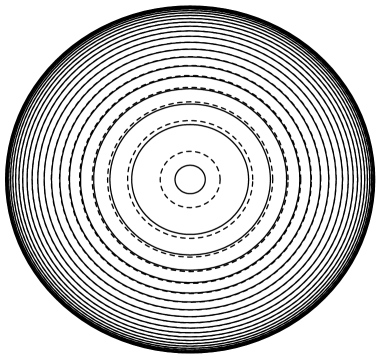
Electron holography is a sensitive tool to measure the thickness of small particlestonomura , as demonstrated experimentally already several decades ago. Initially, experiments yielded a resolution of only tens of nanometersendo corresponding to phase difference of between neighboring contour lines. However it was soon shown that the resolution could be improved by large factors using phase difference amplification techniques, and phase shift differences of could be detectedendo2 . Interference micrographs such as shown in Figs. 1 and 2 depict contours of constant phase shift, and for a spherical sample the contours are circles as shown in those figures. The phase difference between neighboring contours in Figs. 1 and 2 is (two-times phase difference amplification).
A given circle of radius in the contour map corresponds to a given phase shift . Imagine the thickness of the sample were to increase as the temperature is lowered. The phase shift for that value of will increase, so the radius of the circle that will give to the original phase shift has to increase. In other words, the contours of given phase shift will move as shown in Figs. 1 and 2 by the dashed lines. In this paper we predict that this will be observed for any superconducting particle cooled sufficiently below its critical temperature.
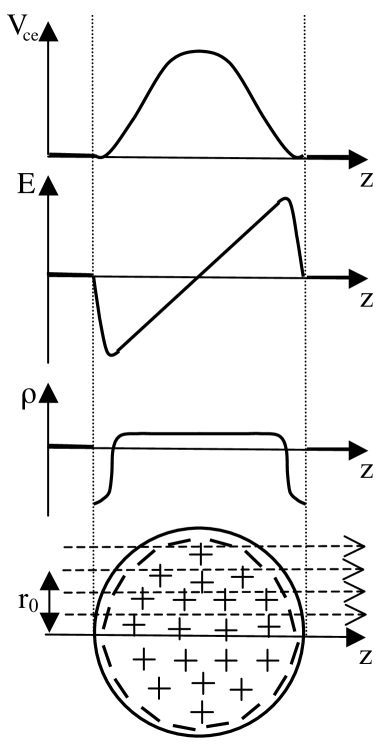
The contour shift will appear to indicate that the sphere becomes a prolate ellipsoid of revolution with the longer axis along the beam direction. In reality, no change in the physical dimensions of the sample will have occurred. The behavior shown in Figs. 1 and 2 will signal that a change in the mean inner potential sensed by the electron beam will have occurred, originating in electronic charge redistribution inside the superconductor: namely, that negative charge has moved from the interior of the superconductor to the surface. The predicted charge distribution, electric field and electric potential inside the superconductor is shown schematically in Figure 3. For a spherical particle no electric field outside the particle is generated through this charge redistribution due to the spherical symmetry and the fact that the particle remains charge neutral.
II phase shift
In an electron holography experiment, the phase shift of the electron wave going through the particle at a distance from the center of the sphere, relative to a reference wave going through vacuum is given bytonomura
| (1) |
where
| (2) |
with the kinetic energy of the electron, the electron rest energy and the electron wavelength. The points where the electron wave enters and exits the spherical particle for a phase contour of radius are , with
| (3) |
with the radius of the particle. is the ordinary mean inner potentialmip1 ; mip2 of the solid which is expected to be constant inside the material. The additional potential resulting from the charge redistribution shown in Fig. 3 is not constant but depends on the radial distance to the center of the sphere:
| (4) |
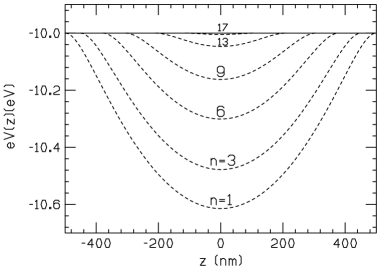
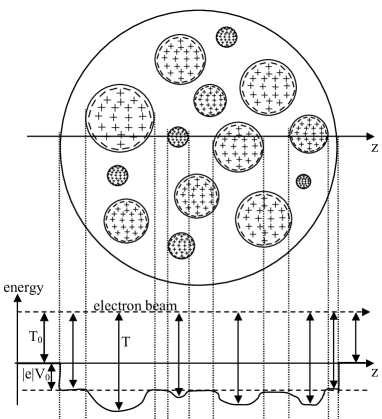
The total potential energy of the electron wave inside the material
| (5) |
depends on the position along the electron trajectory, as shown in Fig. 4 for several values of . This additional potential well increases the phase shift of the high energy electron wave going through the material, giving rise to the contour shifts shown in Figs. 1 and 2. For the examples of Figs. 1 and 2 we used , .
III electric potential due to charge expulsion
The theory of hole superconductivityhole1 predicts that the charge distribution in any superconductor at sufficiently low temperatures is macroscopically inhomogeneous, with more negative charge near the surface and more positive charge in the interior, resembling a ‘giant atom’giantatom , as shown schematically in Figure 3. The charge inhomogeneity is very small: the excess negative charge resides within a London penetration depth (typically several hundreds Angstrom) of the surface and is only of order 1 extra electron per 1 million atomselectrospin .
There is no direct experimental evidence of this physics so far, nor, we argue, is it ruled out by any existing experiment. Electron holography experiments on superconductors performed in the pastbonevich have not tested this physics. A compelling reason in favor of this scenario is that it provides a explanation of the Meissner effectsm , not provided by the conventional BCS theory: in essence, magnetic field lines are dragged outward by outward electron flow.
The charge density distribution in the interior of a spherical superconductor of radius is predicted to bechargeexp
| (6a) | |||
| (6b) | |||
| (6c) |
is the uniform positive charge density deep in the interior of the superconductor. The resulting electric field in the interior of the sphere is
| (7) |
or, for
| (8) |
giving the behavior shown qualitatively in Fig. 3. is the maximum value attained by the electric field near the surface in samples of radius much larger than , and is given by
| (9) |
which is essentially the lower magnetic critical field of a type II superconductortinkham . The resulting electric potential is
The potential is always positive in the interior of the sample, of parabolic form except near the surface where it approaches zero with vanishing slope. This positive potential enters in the expression for the phase shift Eq. (1) giving always an in the phase shift relative to the situation where the charge is uniform in the interior of the particle. The situation is similar to the case of a planar slab of material discussed in Ref. holog1 .
IV non-homogeneous samples
For a perfectly homogeneous sample the theory predicts the situation shown in Fig. 3. One may wonder whether the expected effect would be washed out in non-homogeneous samples, because of random positive and negative phase shifts cancelling out.
In fact, that is what happens. Consider a sample that has random regions of superconducting material embedded in normal material, with the superconducting regions of spherical shape for simplicity, as shown in Fig. 5. As the high energy electron enters a superconducting region within the sample it will always first, decreasing its wavelength and hence increasing its phase shift relative to the situation where the entire sample is normal, and it will slow down to its original speed when exiting the superconducting region. These increased phase shifts add up, all with the same sign, as the electron travels through a non-homogeneous sample with superconducting inclusions.
The reason that all the phase shifts are of the same sign is that the superconducting regions of the sample electrons. As a consequence, the electric field inside the superconducting region points the nearest boundary surface to a normal region and acts to the electron entering through that surface. If instead a superconducting region would have higher positive charge near its boundary and higher negative charge in the interior, the beam electron traveling through that region would indeed slow down and acquire a negative phase shift. However such a situation happens within the theory discussed here.
V temperature and material dependence
The expressions for electric field and potential given in the previous section are the limiting values achieved at zero temperature where only the behavior of the superconducting condensate is taken into account. At finite temperatures, in a two-fluid description of the superconductor there will also be non-superconducting electrons, i.e. excited quasiparticles, that will tend to screen the electric field produced by the charge redistribution of the condensate. Due to the existence of a superconducting energy gap, the density of quasiparticles goes to zero exponentially fast as the temperature is lowered. In Ref. holog1 we estimated that at temperature the density of excited quasiparticles becomes sufficiently small that the electric field and electric potential resulting from charge expulsion start to become visible. That estimate is likely to be an underestimate, since it ignored the fact that the charge of the excited quasiparticles is much smaller than the electron charge. In a more accurate calculation taking this fact into account we estimated recently that these effects should start to become visible at temperatures explast .
However, we don’t discount the possibility that small potential changes and resulting positive phase shifts may start to become observable immediately after the material is cooled below , i.e. at temperatures close to , due to more complicated effects that have not been taken into account in the existent theory. Even in the absence of macroscopic charge redistribution there should be charge rearrangement resulting from expansion of the electronic wavefunction in the superconducting statesm , giving rise to a gradual increase in the mean inner potential as the material is cooled below . The observation of the phase shifts behaviors as a function of temperature in high resolution electron holography experiments should play a key role in providing experimental input for further development of the theory.
This theory is expected to applied to all superconductors, both the class termed “conventional” and the classes termed “unconventional”. The properties of the particular superconducting material enter the predicted phase shifts through the values of and (which is the same as ). Smaller values of make the predicted effects larger, but they are usually associated with smaller values of , putting larger demands on the experimental setup. For the contours calculated in Figure 2, we assumed only two-times phase amplification and the parameters associated with the high temperature superconductor , namely and . With a critical temperature of , these effects should be observable at temperatures of order and possibly substantially higher. All these conditions are well within the reach of current experimental facilities.
VI discussion
Electron holography provides a unique tool for the measurement of electrostatic potentials in the interior of materials, and thus is ideally suited for examination of the physics discussed here. The spherical samples discussed in this paper should make the interpretation of the observed results particularly simple because of the absence of electric fields outside the sample, but the predicted effect should also be seen for more general shapes. For non-spherical shapes, electric fields outside the sample are also predicted to be generated as a consequence of charge expulsionellipsoid , with electric field lines going from regions of low suface curvature to regions of high surface curvature. In a subsequent step it will be interesting to use electron holography to study such samples and detect electric potential variations both inside and outside the sample to confront with the theoretical predictions.
Admittedly, the examples of phase shifts shown in Figs. 1 and 2 are for sample thicknesses somewhat larger than typically used in electron holography experiments (a few hundred nm). As the sample thickness increases one has to worry about effects such as (i) inelastic scattering processes that would increase the tempearature of the sample, and (ii) generation of secondary electrons and resulting positive charging of the sample. On (i) we note that it can be minimized by reducing the intensity of the electron beam. On (ii) we point out that any such charging effect would presumably occur both above and below so that one can still hope to discern the effect discussed here specifically due to superconductivity. We also point out that the examples shown in Figs. 1 and 2, with particle radii 500 nm, assumed only two-times phase amplification. With phase shift sensitivity of e.g. endo2 one would detect an effect for the superconducting material parameters assumed in Figs. 1 and 2 for particle radii as small as approximately 130 nm and 250 nm respectively.
With the high spatial resolution currently attainable in electron holography experiments it should be possible to measure the magnitude of the shift of a contour line as function of the radius of the contour line very accurately, and contrast it with the predictions resulting from our theory, Eqs. (1), (4), (5) and (10). It should also be of great interest to obtain spatial maps of phase shifts, potentials and charge densities for non-homogeneous samples, and in particular to study the temperature dependence of these quantities in the neighborhood of grain boundariesgrain .
Another prediction of this theory that may be amenable to test by electron holography is that electrons will “spill out” from the surface of the sample as the temperature is lowered below giantatom . This may have an observable effect on Fresnel fringes arising from diffraction from the edge of a superconducting sample and will be explored in future work.
The apparent increase in thickness referred to in the title of this paper is of course not a real change in thickness but a virtual one, a pictorial way of describing the increase in the mean inner potential predicted to take place in superconductors at low temperatures. Alternatively, one may describe the predicted effect as an apparent increase of the atomic number of the ions in the material, . It is interesting to note that the theory predicts the largest tendency for superconductivity for materials where conduction occurs through negatively charged ionsmaterials , hence the effective ionic charge sensed by the conduction electrons in the normal state is smallest, and the excess negative charge in the conducting substructures is largest. As the sample becomes superconducting it attempts to counter these effects.
It is also interesting to note that the mean inner potential is related to the diamagnetic susceptibility of a materialdiamag : materials with higher mean inner potential have higher diamagnetic susceptibilitydiamag ; diamag2 ; diamag3 . As a system goes superconducting its diamagnetic susceptibility of course increases dramatically, and thus it could be argued that it is not surprising that its mean inner potential should increase, as predicted here. However, conventional BCS theory of superconductivity does predict such an effect. The relation between diamagnetic susceptibility and mean inner potential follows from the fact that both can be shown to be proportional to the mean square atomic radius of the electronic wavefunctionbethe ; mip1 . Within our theory, superconductivity is associated with of the electronic wavefunctionexplast ; meissner , and thus it is natural that it is associated with an increase in the mean inner potential. This is not the case in BCS theory.
Or, put another way: as discussed in ref.mip1 , the mean inner potential “has two important interpretations - first, as a measure of diamagnetic susceptibility, and secondly, as a measure of the ‘size’ of an atom”. Within our theory, a superconductor is a ‘giant atom’ because of its magnetic electric properties that include charge redistributiongiantatom , and the connection remarked by Spencemip1 qualitatively holds. In the conventional theory of superconductivity superconductors have also been described as ‘giant atoms’ by Londonlondon and otherslondon2 ; london3 but only with respect to their magnetic properties, hence no implication for the mean inner potential results from it and the connection between mean inner potential and diamagnetic susceptibility does not exist. The fact that within our theory the connection between diamagnetic susceptibility and mean inner potential does exist strongly suggests that small positive phase shifts will onset immediately below , as the diamagnetic susceptibility starts to increase due to wavefunction expansionmeissner . However only far below should the larger phase shifts resulting from macroscopic charge redistribution discussed here appear.
Note that when the temperature of a material is lowered, its dimensions usually decrease rather than increase. A key contrary example is the behavior of superfluid , which as the temperature is lowered below the transition. We have proposed elsewherehelium ; helium2 that the negative thermal expansion of in its superfluid state is intimately related to the physics discussed here for superconductors, and results from the fact that both the transitions to the superfluid state and to the superconducting state of metals are driven by lowering of kinetic energykinetic ; meissner , or equivalently quantum pressureemf . Still another example of this physics is the anomalously small thermal expansion observed in metallic ferromagnetsferrothermal , which can also be understood if metallic ferromagnetism is driven by lowering of kinetic energyferro .
As we have discussed for homogeneous as well as non-homogeneous samples, the predicted phase shifts for electrons traveling through superconducting regions are always positive. In other words, the beam electron’s kinetic energy increases. This fact reflects the fundamental electron-hole asymmetry on which the theory of superconductivity discussed here is basedehasym : if positive rather than negative charge would sometimes be expelled from the interior of superconducting regions towards the surface, the phase shifts for beam electrons traveling through those regions would be negative. That will happen according to our theory. It is interesting that the kinetic energy of the superconducting electrons predicted by our theorykinetic that is associated with the negative charge expulsion is mirrored by the kinetic energy of the beam electrons traveling through the sample predicted to take place in electron holography experiments.
The physics underlying the properties of the superconducting state discussed here is expansion of the electronic wave function and associated expansion of the negative charge cloud as phase coherence is established through the superconducting regions of the sample, originating in increased outward quantum pressure. It is very remarkable that the outward motion of the constant phase contours imaged by electron holography will provide a vivid picture of this expansion physics driven by quantum pressure, since it mimics the behavior that would result if the radius of the sample was increasing, even though the physical radius of the sample is actually not increasing. It will be, in the words of A. Tonomura, a new demonstration of “the quantum world unveiled by electron waves”quantumworld .
Acknowledgements.
The author is grateful to J.C.H. Spence, R. Dunin-Borkowski, H. Lichte, C.T. Koch, E. Voelkl and Y. Zhu for stimulating discussions.References
- (1) A. Tonomura, “Electron Holography”, Springer, Berlin, 1999.
- (2) J. Endo, T. Matsuda and A. Tonomura, Interference Electron Microscopy by Means of Holography, JJAP 18 (1979) 2291-2294.
- (3) A. Tonomura et al, Sensitivity-Enhanced Electron-Holographic Interferometry and Thickness-Measurement Applications at Atomic Scale, Phys. Rev. Lett. 54 (1985) 60-62.
- (4) J.C.H. Spence, On the accurate measurement of structure-factor amplitudes and phases by electron diffraction, Acta Cryst. A 49 (1993) 231-260.
- (5) M. Gajdardziska-Josifovska et al, Accurate measurements of mean inner potential of crystal wedges using digital electron holograms, Ultramicroscopy 50 (1993) 285-299.
- (6) See references in http://physics.ucsd.edu/jorge/hole.html
- (7) J.E. Hirsch, Superconductors as giant atoms predicted by the theory of hole superconductivity, Phys. Lett. A 309 (2003) 457-464.
- (8) J.E. Hirsch, Electrodynamics of spin currents in superconductors, Ann. Phys. (Berlin) 17 (2008) 380-409.
- (9) J. E. Bonevich et al, Electron holography observation of vortex lattices in a superconductor, Phys. Rev. Lett. 70 (1993) 2952-2955.
- (10) J.E. Hirsch, Spin Meissner effect in superconductors and the origin of the Meissner effect, Europhys. Lett. 81 (2008) 67003.
- (11) J.E. Hirsch, Charge expulsion and electric field in superconductors, Phys.Rev. B 68 (2003) 184502.
- (12) M. Tinkham, “Introduction to Superconductivity”, 2nd ed, McGraw Hill, New York, 1996.
- (13) J.E. Hirsch, Predicted unexpected behavior of the mean inner potential of superconductors, (2013) arXiv:1302.4178.
- (14) J.E. Hirsch, Dynamic Hubbard model: kinetic energy driven charge expulsion, charge inhomogeneity, hole superconductivity, and Meissner effect, (2013) arXiv:1302.4178.
- (15) J.E. Hirsch, Predicted Electric Field near Small Superconducting Ellipsoids, Phys. Rev. Lett. 92 (2004) 016402.
- (16) M.A. Schofield et al, Direct Evidence for Negative Grain Boundary Potential in Ca-Doped and Undoped YBa2Cu3O7-x, Phys. Rev. Lett. 92 (2004) 195502.
- (17) J.E. Hirsch, Materials and mechanisms of hole superconductivity, Physica C 472 (2012) 78-82.
- (18) L. Rosenfeld, Brechungsindex der Elektronen und Diamagnetismus, Naturwissenschaften 17 (1929) 49-50.
- (19) S. Miyake, On the Mean Inner Potential of Crystals, Proc. Phys. Math. Soc. Jpn 22 (1940) 666-676.
- (20) R.R. Lunt et al, Measurement of the Mean Inner Potentials of Anthracene and Naphthalene, Phys. Rev. Lett. 102 (2009) 065504.
- (21) H. Bethe, Theorie der Beugung von Elektronen an Kristallen, Ann. d. Physik 392 (1928) 85-129.
- (22) J.E. Hirsch, The origin of the Meissner effect in new and old superconductors, Physica Scripta 85 (2012) 035704.
- (23) F. London and H. London, Supraleitung and Diamagnetismus, Physica 2 (1935) 341-354.
- (24) J.C. Slater, The nature of the Superconducting State. II, Phys. Rev. 52 (1937) 214-222.
- (25) H. Grayson Smith and J. O. Wilhelm, Superconductivity, Reviews of Modern Physics 7 (1935) 232-271.
- (26) J.E. Hirsch, Kinetic energy driven superconductivity and superfluidity, Mod. Phys. Lett. B 25 (2011) 2219-2237.
- (27) J.E. Hirsch, Kinetic energy driven superfluidity and superconductivity and the origin of the Meissner effect , (2012) arXiv:1210.1578.
- (28) J.E. Hirsch, Kinetic energy driven superconductivity, the origin of the Meissner effect, and the reductionist frontier, Int. J. Mod. Phys. B 25 (2011) 1173-1200.
- (29) J.E. Hirsch, Electromotive Forces and the Meissner Effect Puzzle, J. Sup. Nov. Mag. 23 (2010) 309-317.
- (30) J.F. Janak and A.R. Williams, Giant internal magnetic pressure and compressibility anomalies, Phys.Rev. B 14 (1976) 4199-4204.
- (31) J.E. Hirsch, Metallic ferromagnetism from kinetic-energy gain: The case of EuB6, Phys.Rev. B 59 (1999) 436-442.
- (32) J.E. Hirsch, The fundamental role of charge asymmetry in superconductivity, J. Phys. Chem. Solids 67 (2006) 21-26.
- (33) A. Tonomura, “The Quantum World Unveiled by Electron Waves”, World Scientific, Singapore, 1998.