Individual Alpha Elements, C, N, and Ba in Early Type Galaxies.
Abstract
Spectral data on early type galaxies is analyzed for chemical abundance with an emphasis on obtaining detailed abundances for the elements O and Si in addition to C, N, Na, Mg, Ca, Fe, and Ba. The abundance trends with velocity dispersion fits preconceptions based upon previous Mg conclusions, namely that larger galaxies have a higher alpha element to iron peak ratio indicative of a higher ratio of Type II to Type Ia supernova products. The heaviest alpha elements, Ca and Ti, do not participate in this trend, although this fact does not necessarily alter the basic picture given the uncertainties in nucleosynthetic yields. Elements that likely have significant contributions from intermediate-mass stars, namely C, N, and Ba, also gain ground relative to Fe in massive galaxies at a modest level, with the Ba conclusion uncertain from our data alone.
1 Introduction
In early-type galaxies, tracking the abundances of individual elements is a promising avenue to learn more about the nucleosynthetic histories of these enigmatic objects because the observed abundance pattern is the sum of the chemical enrichment over the lifetime of the galaxies whether that enrichment occurred primordially or fairly recently (Audouze & Tinsley, 1976). While color-magnitude relations and line strength-magnitude relations indicated some chemical enrichment as a function of early type galaxy luminosity or velocity dispersion (Faber, 1973), attention turned to the possibility of non-lockstep heavy element enrichment as metallicity-sensitive stellar population models were produced Peletier (1989); Worthey et al. (1992); Davies et al. (1993); Kuntschner (2000). The earliest studies concentrated on the ratio [Mg/Fe] since the diagnostic features, Mg , Fe5270, and Fe5335 [spectral absorption feature index definitions of Worthey et al. (1994)] were adjacent to each other in the spectrum and thus plausibly insulated from wavelength dependent changes in things such as the ratio of dwarf to giant stellar light or the ratio of metal poor to metal rich stellar light.
The elements N, Ca, Na, and Ti were soon added to the list of elements with strong spectral signatures that could plausibly be measured (Worthey, 1998), and it appeared that N and Na roughly tracked Mg, while Ca stayed closer to Fe across the span of velocity dispersion, with Ti, expressed in the spectrum through TiO features, was more ambiguous. Carbon can be measured via the C2 absorption associated with the index called either Fe4668, or, later, C24668 (Tripicco & Bell, 1995). Trager et al. (1998) showed that the behavior of C24668 with velocity dispersion was intermediate between Fe and Mg features and so perhaps [C/Fe] was also increasing with galaxy velocity dispersion, but more mildly than [Mg/Fe]. Worthey (2004)’s case study of M32 indicated high precision of the [C/Fe] ratio, and also highlighted that, if the abundance pattern were correctly taken into consideration, a mean age was determined with much greater confidence. [C/Fe] and [Na/Fe] were slightly elevated in M32, while [N/Fe] and [Mg/Fe] depressed, but global conclusions from one decidely peculiar elliptical galaxy are impossible to make.
Nitrogen, oxygen, and carbon are related via molecular balancing (Tripicco & Bell, 1995). The CO molecule has the highest binding energy compared to C2 or CN, so that adding oxygen tends to decrease C2 and CN feature strengths as less free carbon is available. Leaving O as a free parameter, however, C and N can be separately disentangled by considering the CN features in the optical blue and C24668, leading to the strong N and weak C positive trends with velocity dispersion stated above. In other words, a strong O trend with velocity dispersion could strongly alter the C and N conclusions. There is a noteworthy side story regarding the NH feature at 3360Å that at first glance should measure N alone. Toloba et al. (2009) more than doubled the amount of observational data available for this feature, and found a flat trend of the index with velocity dispersion, in stark contrast to the strong trend with CN near 4100Å. However, Serven et al. (2011) realized that this very blue feature was being weakened by weak-lined starlight from metal poor main sequence stars, and also that it was being negatively affected by nearby Mg absorption. There is therefore no reason to doubt the conclusions from the optical.
Calcium, being an alpha element, albeit a heavy one, might be expected to follow magnesium. Initial indications based on the index Ca4455 that has substantial contributions from other elements and Ca4227 that is somewhat cleaner (Worthey, 1998) were that Ca tracks Fe, although there was some evidence that the [Ca/Fe] zero point was incorrect (Prochaska et al., 2005). Calcium also has a very strong trio of spectra features in the red (8600Å) that were analyzed by Cenarro et al. (2003) and Cenarro et al. (2004) with the intriguing observation that the Ca line strengths decline with increasing galaxy velocity dispersion. A possible explanation was that the initial mass function (IMF) was becoming more dwarf-heavy among larger galaxies, though of course this could also be caused by a modest decline in Ca abundance for larger galaxies. Finally, Worthey et al. (2011) analyzed the Ca K and H features which are not sensitive to IMF changes to conclude that the latter explanation, a true abundance trend, was much more likely, though modest; a few tenths in the log at most.
In terms of chemical evolution and nucleosynthesis a change in the ratio of Type Ia to Type II supernova enrichment along the mass sequence of early type galaxies would clearly explain most of what is seen in the abundance pattern if some mechanism were identified that could vary the enrichment ratio as a function of galaxy mass or velocity dispersion. There are many proposed mechanisms [see Worthey et al. (1992); Trager et al. (1998); Thomas et al. (2003)] but three example mechanisms are (1) more rapid star formation in more massive galaxies, (2) a more top-heavy upper IMF in the star formation environments found in more massive galaxies, and (3) quicker quenching of the tail ends of star formation episodes in more massive galaxies. All three would operate to boost alpha elements (C, O, Ne, Si, Ti, Ca) relative to Fe-peak elements, presuming that Type II supernovae produce that whole list. Recently, Conroy et al. (2013) added Ba and Sr to the list of elements to consider, finding that Ba tracks Mg but that Sr has either no trend, or its trend is buried in the noise. Due to their s-process (Burbidge et al., 1957) origin, Ba and Sr could conceivably come from a third nucleosynthetic source: intermediate-mass stars with a timescale of enrichment intermediate between that of Type II supernovae (few million years) and Type Ia (many hundreds of millions of years because of the necessity to form white dwarf ’seeds’ before detonation). Carbon and N plausibly also arise mostly from intermediate mass stars (Worthey, 1998; Mattsson, 2010; Bensby & Feltzing, 2006; Chiappini et al., 2005; Chiappini et al., 2003) although this conclusion is not perfectly clear, even for the Milky Way environment.
Proceeding onward into the unknown, the elements Si and O are key alpha elements whose nucleosynthetic source is type II supernovae and whose measurement should theoretically track Mg very well. Calcium and Ti are heavy alpha elements that perhaps should also follow Mg, but may, in practice, not do that. It is important to confirm the Ba result of Conroy et al. (2013), and also at least somewhat chart the behavior of O because of its pragmatic importance in being able to therefore measure N and C abundances relative to some absolute scale.
The tools this group has assembled over the years to tackle the problem are about to be overhauled, and it was judged timely to publish a snapshot of the results to date. The methods for doing so are laid out in the next section, followed by the abundance results, followed by a discussion and conclusion section.
2 Method
The stellar population models used follow Worthey et al. (2011) with index definitions as expanded by Serven et al. (2005) and the basic infrastructure of Worthey (1994). To briefly recap, stellar evolutionary isochrones are coupled to a stellar IMF to predict the number of stars inhabiting locations in the log , log Teff diagram. Fluxes are associated with each bin of stars, along with empirical estimates of the absorption feature indices.
It was planned to use newly-computed isochrones based on MESA (Paxton et al., 2011) evolution for this work. These isochrones would have been sensitive to abundance changes in the same way as the spectra and it is desirable to have it so, not only for the sake of consistency, but also for the scientific exploration of how the flexible evolution would augment or attenuate the spectral signals. Technical reasons prevented the timely completion of this effort, and so we proceed with the important caveat that the mild temperature and lifetime changes seen in Dotter et al. (2007) are not carried forward in this analysis. In addition to the other shortcomings to be elucidated as we proceed, there is also this fact that the stellar evolution is assumed to be scaled-solar as the abundance mixture changes. We know enough to know that for the abundance trends themselves the underlying isochrones matter only in second order, and so it is possible to proceed, albeit with due caution. Bertelli et al. (1994) isochrones were used for the plots in this paper, though isochrones are swappable in our code.
Synthetic spectra are used twice. Once to place the continuum, and once more to provide the spectral response to changes of abundance parameters. For this paper all spectral data and model indices are transformed to a common resolution to mimic a velocity dispersion of 300 km s-1. The grid of synthetic stellar spectra compiled from three different codes (Lee et al., 2009) at high spectral resolution, then resampled to 0.5 Å wavelength intervals in the range 3000-10,000 Å. A list of 23 elements was included, not all of which are used in this paper, and the Grevesse & Sauval (1998) abundance list was used as the solar mixture.
Empirical spectra are still essential for adequate spectral matching. This is illustrated in Figure 1 where three workhorse indices are plotted for stars of surface temperature between 4000 and 6000 K. The empirical fits are based on three spectral libraries (Worthey et al., 1994; Valdes et al., 2004; Sánchez-Blázquez et al., 2006) and are quite solidly established. The synthetic indices were measured from the spectra we are using to estimate spectral responses as a function of abundance change, smoothed to 200 km s-1 for purposes of Fig. 1 and serve to illustrate why empirical spectra are still essential. There tends to be far more gravity dependence in the synthetic spectra than in real stars. This is seen even in colors (Worthey & Lee, 2011). Tripicco & Bell (1995) also note that cool stars will have deeper Balmer line strengths than synthetic spectra can reproduce because of chromospheric layers that are not modeled.
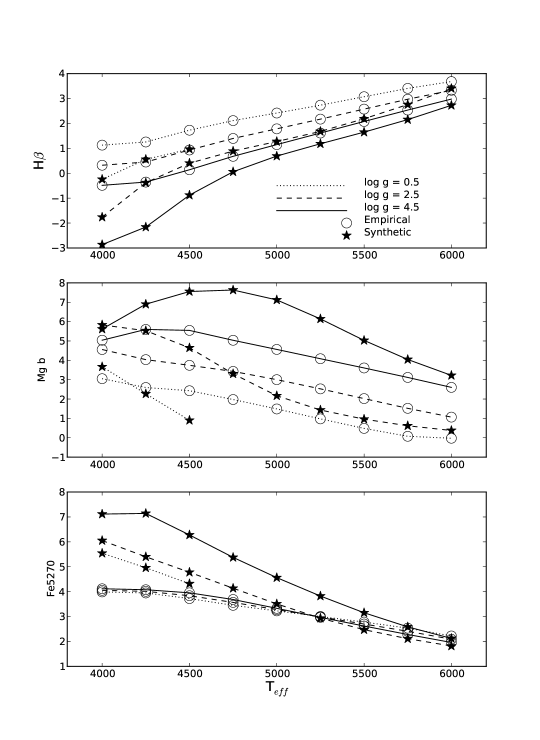
The medium-resolution regime highlights weak points in the synthetic spectra that can go unnoticed at very high or very low resolution: incomplete or incorrect line lists, lack of chromospheres, and uncertainty in convection and microturbulence all contribute to considerable drift between observation and calculation. See Chavez et al. (1995, 1996, 1997); Franchini et al. (2004a, b, 2005); Gulati et al. (1993); Tripicco & Bell (1995) for more confrontations and derived wisdom. The spectra we use reproduce stellar colors very well, but are also known to suffer from incorrect Cr line parameters in addition to the regular list of defects inherent in synthetic spectra.
We use spectra from Graves et al. (2007) that are grand averages of non-LINER, early-type galaxies from the Sloan Digital Sky Survey binned into six velocity dispersion ranges, and individual galaxies from Serven (2010) that are mostly in the Virgo cluster. Spectra and models were compared in feature-index space at a common velocity dispersion of 300 km s-1. Most galaxies needed to have extra smoothing applied in order to reach this resolution, but a few of the largest galaxies needed to be corrected backwards, where synthetic model spectra were used to compute the small index corrections.
An inversion program was created to find the best-fitting set of abundance parameters for a given set of indices. A single-burst age and a delta function in metallicity was used for this exercise, along with a variable number of individual elemental abundance parameters, with elements varied one by one. For ages, a collection of nine indices (HA, HF, HF, H, Fe4383, Fe5270, Fe5335, Na D, C24668) was used to generate a map of RMS goodness of fit over the parameter range covered by the models. A smoothed map was then used to find the starting age and overall abundance. Iteratively, individual abundances were allowed to drift, and the improved chemical fingerprint carried forward to subsequent age guesses. All available indices were used in the inversion process, wavelength definitions from Worthey et al. (1994); Worthey & Ottaviani (1997); Serven et al. (2005).
No constraints were imposed on the abundance mixtures. In certain circumstances, this did indeed cause wild results, and that very wildness was used to judge when the combination of indices and index responses to the abundance changes were astrophysically meaningful. For example, Sr and Al only affect tiny portions of the spectrum at a weak level; too weak to be truly measured, so Sr and Al abundances coming from the unconstrained inversion program are therefore subject to noise and give [Sr/R] or [Al/R] values that are sometimes more than a factor of ten away from the solar value. The “R” in the above notation stands for “any heavy element that is not being specifically called out.” For example. it could be equated to uranium, if one desired. In any case it scales with the solar abundance pattern. One should find, for example, that [Fe/H] = [Fe/R]+[R/H]. Indeed, for any element Q, [Q/H] = [Q/R]+[R/H]. Additionally, [Q/Fe] = [Q/R] - [Fe/R]. As always, square-bracket notation means base-ten logarithmic abundance relative to the solar value. Most of the results will be quoted as relative to Fe, but by this notation, [Fe/R] has meaning, whereas [Fe/Fe] does not.
The second way an element can give spurious results is if it is both rather weak, yet widespread in wavelength so that it affects many indices. Manganese, Co, Ni are like that. Iron is almost like that, but it affects the spectrum very strongly, not weakly. The third way is illustrated by the pair O and Ti. Increasing one or other of O or Ti will increase the strengths of TiO features, and TiO features carry a lot of weight in the spectrum, affecting many indices, so this pair of elements couples to one another strongly, compensating for each other along a predictable degeneracy axis.
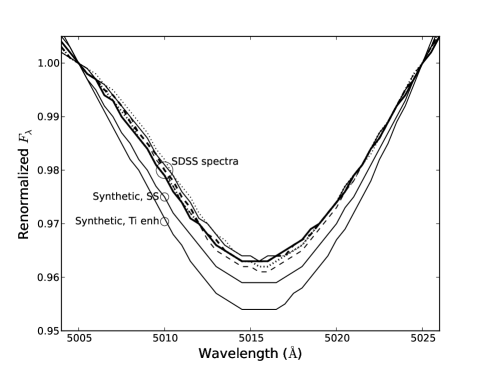
However, Ti enjoys the luxury of providing some atomic transitions as well. In our synthetic spectra, the effects of 0.3 dex enhancement of Ti are clearly seen near 4296, 4533, and 5000 Å in the spectrum. However, the stacked SDSS spectra, when normalized to bracket the atomic Ti absorptions, show responses of confusing sense and also easily explainable by absorption from other species such as C or Fe. One example is show in Figure 2 where a blend of atomic Ti at 5007.21Å and 5014.19Å and some lesser lines contribute. In that example, the observed spectra show no coherent change with velocity dispersion, though using the synthetic spectra as guide, a 0.3 logarithmic enhancement of Ti abundance should clearly be visible. In other words, by spectral comparison, the atomic Ti shows no evidence for varying at all as a function of galaxian velocity dispersion.
This null result enables us to simplify the problem by one element, and for the most part we held Ti fixed at scaled solar abundance. For purposes of this abundance-centered exercise, the ages and overall heavy metal abundances are mean values from assumed single-burst simple stellar populations, and are not meant to be particularly realistic in terms of a true representation of the stellar populations within a given target galaxy. The age-metallicity degeneracy (Worthey, 1994) remains in full play, decoupling from the process of finding element abundance ratios as described in Worthey (1994). The effects of metallicity compositeness on absorption feature strengths are probably detected in the far blue (Serven et al., 2011) but our spectra do not cover a large enough wavelength span to reach the NH 3360 feature. Inclusion of metallicity-compositeness or swapping in different isochrone sets would have similiar effects, namely shifting zero points. The spans of the abundance shifts should remain almost invariant.
3 Results
Sample results are illustrated in Figures 3, 4, 5, and 6. Galaxies are marked by alphanumeric codes for individual identification. The set of SDSS grand averages from Graves et al. (2007) begin with the letter “S” followed by the velocity dispersion of the bin. The galaxies from Serven (2010) are the NGC catalog numbers. Numbers in the 4000s are members of the Virgo Cluster. Elements not illustrated have been set to lockstep; for example, [Fe/R] = [Sr/R] = [Mn/R] = [Ti/R] = 0. In the present scheme, [M/H] is not necessarily the same as [R/H] due to the fact that the isochrones do not have flexible chemistry and do not vary as the chemical mix changes. [M/H] indicates the scaled-solar label on the best-fitting isochrone, as “Age” indicates the age lable on the best-fitting isochrone.
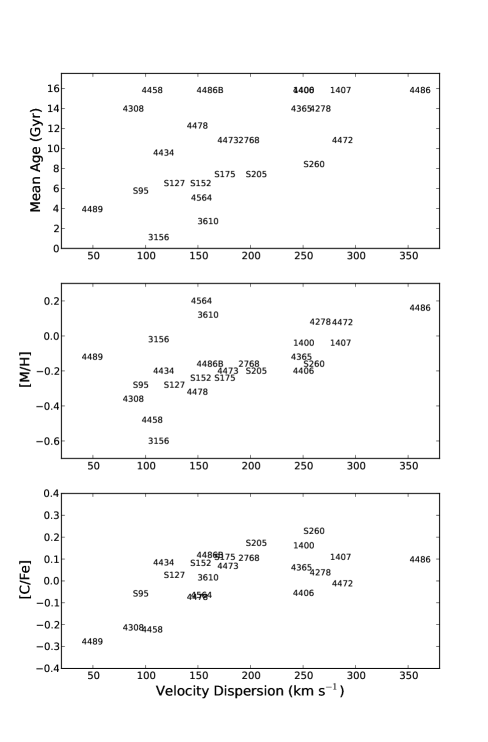
The young age of NGC 3156, seen in Fig. 3, around 1 Gyr, is a very robust age, but it means that the metallic features are quite weak, and the rest of the parameters for that galaxy are uncertain. Most of the individual galaxies fit about the same or better than the SDSS average galaxies in terms of RMS reproduction of all the indices by the final model. As is typical (Graves et al., 2009), Fig. 3 shows a dearth of young, massive objects, and thus the average age increases at higher velocity dispersions. The dispersion in mean age for the individual galaxies is, by and large, real.
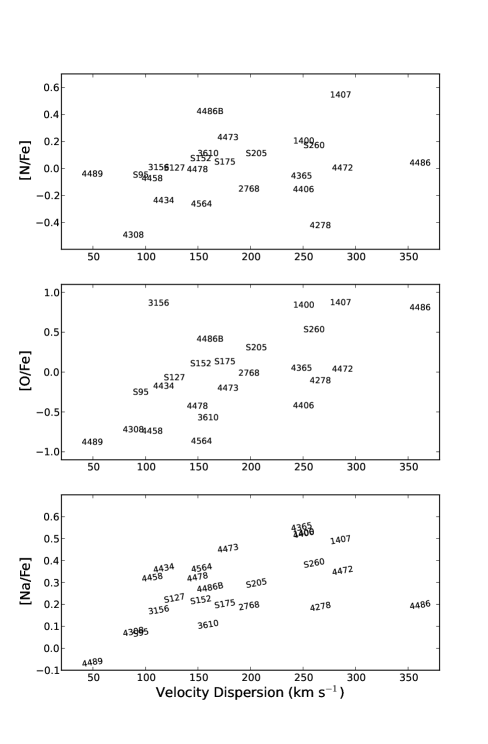
The abundance trends in Figures 3 through 6 are clearly increasing with velocity dispersion, especially [M/H], [C/Fe], [O/Fe], [Na/Fe], and [Si/Fe]. [M/H] equates to [R/H] and [Fe/H] for the illustrated inversion program run. When other elements are included, especially O, the [Mg/Fe] trend weakens somewhat compared with historical estimates such as Worthey et al. (1992). [N/Fe] and [Ba/Fe] also weakly rise, and [Ca/Fe] stands alone as weakly declining.
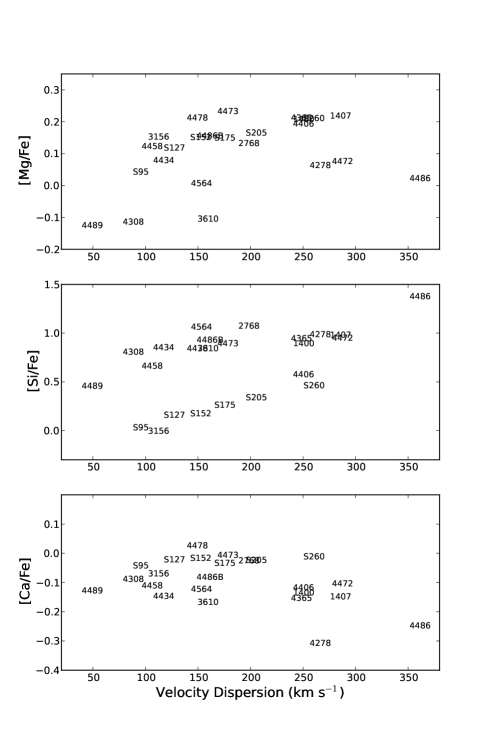
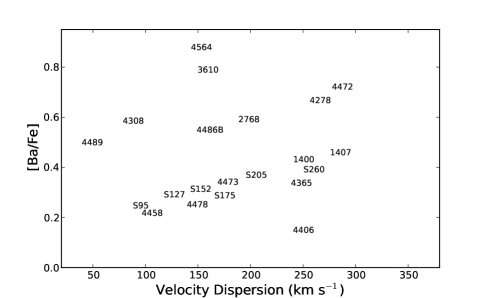
There is the appearance of a two-family bifurcation between SDSS and Serven samples in the [Si/Fe] trend of Fig. 5. The [Si/Fe] is a relatively volatile one, resting on SiH molecular features in the blue that aren’t captured terribly well by the indices, and also are probably not secure in the synthetic spectra. Small systematic drifts in the input spectra can effect substantial changes in the inferred Si abundances. The same could be said for Ba.
4 Discussion and Conclusions
The uncertainty in the trends is the crucial question. It is clear that signal to noise is not an issue. The uncertainties are a combination of systematic effects in the spectra and modeling uncertainties. Too, the inversion methods are relatively untried. To gauge a scalable estimate of at least the modeling uncertainties, we added and subtracted elements from the list of things to be fit, making many permutations of the list and recording the inverted parameters. We included Ti several times, with the rule that O must be turned off during those runs.
Using the km s-1 average galaxy minus the km s-1 average galaxy as a convenient benchmark for estimating the range in the abundance parameters over the span of velocity dispersion, we collected the abundance results after the subsampling/permutation runs. We summarize the statistics in Table 1.
| Quantity to Range | Mean of Range | Standard Deviation |
|---|---|---|
| Age (Gyr) | 0.18 | 1.84 |
| [M/H] | 0.18 | 0.08 |
| [C/Fe] | 0.11 | 0.09 |
| [N/Fe] | 0.17 | 0.07 |
| [O/Fe] | 0.46 | 0.30 |
| [Na/Fe] | 0.29 | 0.03 |
| [Mg/Fe] | 0.15 | 0.03 |
| [Si/Fe] | 0.28 | 0.09 |
| [Ca/Fe] | 0.03 | |
| [Fe/R] | 0.07 | 0.06 |
| [Ba/Fe] | 0.04 | 0.09 |
Note. — The means are the ranges of each quantity, using the km s-1 average galaxy minus the km s-1 average galaxy. The statistics are then computed as permutations on the elements that are allowed to enter the fitting process of the inversion program.
The standard deviations in Table 1 are, plausibly, overestimated compared to realistic uncertainties by our permutation process. For example, we never saw a negative [O/Fe] trend, although the standard deviation for [O/Fe] would imply that we should have. Clearly, some of the abundance trends are very secure, and they all seem significant except [Ca/Fe] and [Ba/Fe]. We do disagree with Conroy et al. (2013) that [Ba/Fe] decreases with velocity dispersion even though our Barium sensitive indices behave the same, empirically. We have no explanation for this at present. For this exercise, little should be made of the ages, since the experiment was not designed with accurate ages in mind.
Astrophysically, the trend among the alpha elements is rather fascinating. Ordered by mass, the alpha elements are O, Ne, Mg, Si, S, Ar, Ca, and Ti. We cannot measure Ne, S, or Ar due to lack of lines (Serven et al., 2005). Ca and Ti appear nearly locked to Fe in elliptical galaxies and they are the heaviest alphas, while O, Mg, and Si show a strong parting of ways with Fe and they are the lightest alphas. It is tempting based upon this correspondence to lump Ca and Ti with Type Ia supernovae and call the problem solved.
Current theoretical nucleosynthetic yield estimates seem too noisy to give much guidance as regards Ca and Ti [see discussion and references in Serven et al. (2005)]. Type Ia supernovae may contribute more than half of the Ca and Ti in the sun. One empirical example is available in the galactic bulge, in which all of the alpha elements seem to have positive, but declining [X/Fe] except for possibly O, measurement of which seems to be slightly controversial and Mg, which seems to linger at elevated levels even to high metallicity (Cunha & Smith, 2006; McWilliam et al., 2008; Cescutti et al., 2009; McWilliam et al., 2010). The decline of alpha elements in the bulge may possibly be echoed by the most massive galaxy in our sample, NGC 4486, which lies rather lower than the trend in [C/Fe], [N/Fe], [Na/Fe], [Mg/Fe], and even [Ca/Fe] and possibly [O/Fe], seeming unattenuated only for [Si/Fe]. The Ba measurement for NGC 4486 is too uncertain to call out specifically.
The elements that may have significant contributions from intermediate-mass stars through mass loss on the asymptotic giant branch that includes extra N manufactured during CNO cycle H fusion, C manufactured during He fusion, and neutron-capture elements such as Sr which we cannot measure, and Ba, which we do. Intermediate mass stars are 3 M⊙ through 8 M⊙ with a sweet spot for chemical enrichment happening around a 5 M ⊙ lifetime of about 200 Myr; that is, fairly short compared to what is most often contemplated as the Type Ia supernova enrichment timescale. Since elliptical galaxies are chemically evolved systems, it is not possible to separate primary enrichment (primordial supernovae) from secondary enrichment (after the creation of C, from with N can then be manufactured).
In summary, we have analyzed two sets of spectra for early type galaxies in an attempt to pin down trends for O and Si for the first time in these systems, getting trends that agree by and large with previous Mg measurements, at least qualititatively. In addition to O and Si we also measure abundances for C, N, Na, Mg, Ca, Fe, and Ba. Larger galaxies generally have a higher alpha element to iron peak ratio indicative of a higher ratio of Type II to Type Ia supernova products with the exception of the heaviest alpha elements, Ca and Ti, which seem to follow Fe more closely. The [Mg/Fe] trend is quite strong, but shows less range than past estimates. Elements that likely have significant contributions from intermediate-mass stars, namely C, N, and Ba, also gain ground relative to Fe in massive galaxies at a modest level, with the Ba conclusion uncertain from our data alone.
In terms of surprises and conclusions that overturn established wisdom, there are none; the basic picture that it is mostly the Type II / Type Ia chemical signatures that drive the abundance trends is still a valid hypothesis. Two items are noteworthy, though presently apparently insoluble astrophysically. First, Ca and Ti appear to track Fe and it would be lovely to know if those elements were Type Ia supernova products as Fe is, or if there is a progenitor mass dependence on the Ca and Ti enrichment. Second, the light elements C and N could have supernova contributions, and it would be lovely to know quantitatively what those might be as a function of star formation and chemical evolution timescales. Measuring Ba better may not solve this issue, as Ba can be made in the r-process as well (Sneden et al., 2003).
References
- Audouze & Tinsley (1976) Audouze, J., & Tinsley, B. M. 1976, ARA&A, 14, 43
- Bensby & Feltzing (2006) Bensby, T., & Feltzing, S. 2006, MNRAS, 367, 1181
- Bertelli et al. (1994) Bertelli, G., Bressan, A., Chiosi, C., Fagotto, F., & Nasi, E. 1994, A&AS, 106, 275
- Burbidge et al. (1957) Burbidge, E. M., Burbidge, G. R., Fowler, W. A., & Hoyle, F. 1957, Reviews of Modern Physics, 29, 547
- Buzzoni et al. (2001) Buzzoni, A., Chavez, M., Malagnini, M. L., & Morossi, C. 2001, PASP, 113, 1365
- Cenarro et al. (2003) Cenarro, A. J., Gorgas, J., Vazdekis, A., Cardiel, N., & Peletier, R. F. 2003, MNRAS, 339, L12
- Cenarro et al. (2004) Cenarro, A. J., Sánchez-Blázquez, P., Cardiel, N., & Gorgas, J. 2004, ApJ, 614, L101
- Cescutti et al. (2009) Cescutti, G., Matteucci, F., McWilliam, A., & Chiappini, C. 2009, A&A, 505, 605
- Chavez et al. (1995) Chavez, M., Malagnini, M. L., & Morossi, C. 1995, ApJ, 440, 210
- Chavez et al. (1996) Chavez, M., Malagnini, M. L., & Morossi, C. 1996, ApJ, 471, 726
- Chavez et al. (1997) Chavez, M., Malagnini, M. L., & Morossi, C. 1997, A&AS, 126, 267
- Chiappini et al. (2005) Chiappini, C., Matteucci, F., & Ballero, S. K. 2005, A&A, 437, 429
- Chiappini et al. (2003) Chiappini, C., Romano, D., & Matteucci, F. 2003, MNRAS, 339, 63
- Conroy et al. (2013) Conroy, C., van Dokkum, P. G., & Graves, G. J. 2013, ApJ, 763, L25
- Cunha & Smith (2006) Cunha, K., & Smith, V. V. 2006, ApJ, 651, 491
- Davies et al. (1993) Davies, R. L., Sadler, E. M., & Peletier, R. F. 1993, MNRAS, 262, 650
- Dotter et al. (2007) Dotter, A., Chaboyer, B., Ferguson, J. W., et al. 2007, ApJ, 666, 403
- Faber (1973) Faber, S. M. 1973, ApJ, 179, 731
- Franchini et al. (2004a) Franchini, M., Morossi, C., Di Marcantonio, P., et al. 2004a, ApJ, 601, 485
- Franchini et al. (2004b) Franchini, M., Morossi, C., Di Marcantonio, P., et al. 2004b, ApJ, 613, 312
- Franchini et al. (2005) Franchini, M., Morossi, C., Di Marcantonio, P., et al. 2005, ApJ, 634, 1319
- Graves et al. (2007) Graves, G. J., Faber, S. M., Schiavon, R. P., & Yan, R. 2007, ApJ, 671, 243
- Graves et al. (2009) Graves, G. J., Faber, S. M., & Schiavon, R. P. 2009, ApJ, 698, 1590
- Grevesse & Sauval (1998) Grevesse, N., & Sauval, A. J. 1998, Space Sci. Rev., 85, 161
- Gulati et al. (1993) Gulati, R. K., Malagnini, M. L., & Morossi, C. 1993, ApJ, 413, 166
- Kuntschner (2000) Kuntschner, H. 2000, MNRAS, 315, 184
- Lee et al. (2009) Lee, H.-c., Worthey, G., Dotter, A., et al. 2009, ApJ, 694, 902
- Mattsson (2010) Mattsson, L. 2010, A&A, 515, A68
- McWilliam et al. (2008) McWilliam, A., Matteucci, F., Ballero, S., et al. 2008, AJ, 136, 367
- McWilliam et al. (2010) McWilliam, A., Fulbright, J., & Rich, R. M. 2010, IAU Symposium, 265, 279
- Paxton et al. (2011) Paxton, B., Bildsten, L., Dotter, A., et al. 2011, ApJS, 192, 3
- Peletier (1989) Peletier, R. F. 1989, Ph.D. Thesis, Univ. Groningen
- Prochaska et al. (2005) Prochaska, L. C., Rose, J. A., & Schiavon, R. P. 2005, AJ, 130, 2666
- Sánchez-Blázquez et al. (2006) Sánchez-Blázquez, P., Peletier, R. F., Jiménez-Vicente, J., et al. 2006, MNRAS, 371, 703
- Serven (2010) Serven, J. 2010, Ph.D. Thesis, Washington State Univ.
- Serven et al. (2005) Serven, J., Worthey, G., & Briley, M. M. 2005, ApJ, 627, 754
- Serven et al. (2011) Serven, J., Worthey, G., Toloba, E., & Sánchez-Blázquez, P. 2011, AJ, 141, 184
- Sneden et al. (2003) Sneden, C., Cowan, J. J., Lawler, J. E., et al. 2003, ApJ, 591, 936
- Thomas et al. (2003) Thomas, D., Maraston, C., & Bender, R. 2003, MNRAS, 343, 279
- Toloba et al. (2009) Toloba, E., Sánchez-Blázquez, P., Gorgas, J., & Gibson, B. K. 2009, ApJ, 691, L95
- Trager et al. (1998) Trager, S. C., Worthey, G., Faber, S. M., Burstein, D., & Gonzalez, J. J. 1998, ApJS, 116, 1
- Tripicco & Bell (1995) Tripicco, M. J., & Bell, R. A. 1995, AJ, 110, 3035
- Valdes et al. (2004) Valdes, F., Gupta, R., Rose, J. A., Singh, H. P., & Bell, D. J. 2004, ApJS, 152, 251
- Worthey et al. (1992) Worthey, G., Faber, S. M., & Gonzalez, J. J. 1992, ApJ, 398, 69
- Worthey (1994) Worthey, G. 1994, ApJS, 95, 107
- Worthey et al. (1994) Worthey, G., Faber, S. M., Gonzalez, J. J., & Burstein, D. 1994, ApJS, 94, 687
- Worthey (1998) Worthey, G. 1998, PASP, 110, 888
- Worthey (2004) Worthey, G. 2004, AJ, 128, 2826
- Worthey & Lee (2011) Worthey, G., & Lee, H.-c. 2011, ApJS, 193, 1
- Worthey et al. (2011) Worthey, G., Ingermann, B. A., & Serven, J. 2011, ApJ, 729, 148
- Worthey & Ottaviani (1997) Worthey, G., & Ottaviani, D. L. 1997, ApJS, 111, 377