Improved Search for Oscillations in the MiniBooNE Experiment
Abstract
The MiniBooNE experiment at Fermilab reports results from an analysis of appearance data from protons on target in antineutrino mode, an increase of approximately a factor of two over the previously reported results. An event excess of events () is observed in the energy range MeV. If interpreted in a two-neutrino oscillation model, , the best oscillation fit to the excess has a probability of 66% while the background-only fit has a -probability of 0.5% relative to the best fit. The data are consistent with antineutrino oscillations in the eV2 range and have some overlap with the evidence for antineutrino oscillations from the Liquid Scintillator Neutrino Detector (LSND). All of the major backgrounds are constrained by in-situ event measurements so non-oscillation explanations would need to invoke new anomalous background processes. The neutrino mode running also shows an excess at low energy of events () but the energy distribution of the excess is marginally compatible with a simple two neutrino oscillation formalism. Expanded models with several sterile neutrinos can reduce the incompatibility by allowing for CP violating effects between neutrino and antineutrino oscillations.
pacs:
14.60.Lm, 14.60.Pq, 14.60.StThere is growing evidence for short-baseline neutrino anomalies occurring at an m/MeV, where is the neutrino energy and is the distance that the neutrino travelled before detection. These anomalies include the excess of events observed by the LSND [1] and MiniBooNE [2, 3, 4] experiments and the deficit of events observed by reactor [5] and radioactive-source experiments [6]. There have been several attempts to interpret these anomalies in terms of 3+N neutrino oscillation models involving three active neutrinos and N additional sterile neutrinos [7, 8, 9, 10, 11, 12]. (Other explanations include, for example, Lorentz violation [13] and sterile neutrino decay [14].) A main goal of MiniBooNE was to confirm or refute the evidence for neutrino oscillations from LSND. Of particular importance is the MiniBooNE search for oscillations since this was the channel where LSND observed an apparent signal. This paper presents improved results and an oscillation analysis of the MiniBooNE appearance data, corresponding to POT in antineutrino mode, which is approximately twice the antineutrino data reported previously [4].
Even though the first goal of this article is a presentation of the improved antineutrino results, a secondary goal is to contrast and compare these results with improved MiniBooNE neutrino measurements and, therefore, the details of both the neutrino and antineutrino analysis will be given. Since the original neutrino result publication [3], improvements to the analysis have been made that affect both the and appearance search. These improvements are described and used in the analyses presented here.
The neutrino (antineutrino) flux is produced by 8 GeV protons from the Fermilab Booster interacting on a beryllium target inside a magnetic focusing horn set at positive (negative) polarity. In neutrino (antineutrino) mode, positively (negatively) charged mesons produced in p-Be interactions are focused in the forward direction and subsequently decay primarily into (). The flux of neutrinos and antineutrinos of all flavors is simulated using information from external measurements [15]. In neutrino mode, the , , , and flux contributions at the detector are 93.5%, 5.9%, 0.5%, and 0.1%, respectively. In antineutrino mode, the , , , and flux contributions at the detector are 83.7%, 15.7%, 0.4%, and 0.2%, respectively. The and fluxes peak at approximately 600 MeV and 400 MeV, respectively.
The MiniBooNE detector is described in detail in reference [16]. The detector is located 541 m from the beryllium target and consists of a 40-foot diameter sphere filled with 806 tons of pure mineral oil (CH2). Neutrino interactions in the detector produce charged particles (electrons, muons, protons, pions, and kaons) which in turn produce scintillation and Cherenkov light detected by the 1520 8-inch photomultiplier tubes (PMTs) that line the interior of the detector and an optically isolated outer veto region. Event reconstruction and particle identification are derived from the hit PMT charge and time information. In particular, the reconstructed neutrino energy, , uses the measured energy and angle of the outgoing muon or electron assuming charged-current quasi-elastic (CCQE) kinematics for the event.
The signature of and oscillations is an excess of and -induced CCQE events. Reconstruction [17] and selection requirements of these events are almost identical to those from previous analyses [3, 4] with an average reconstruction efficiency of for events generated over the entire volume of the detector. Recent improvements to the analysis include a better determination of the intrinsic background from decay through the measurement of high-energy neutrino events in the SciBooNE experiment [18], a better determination of NC and external event backgrounds in antineutrino mode due to the increase in statistics of the antineutrino mode data sample, and the use of a likelihood fit with frequentist corrections from fake data studies for both the neutrino-mode and antineutrino-mode analyses. The detector cannot distinguish between neutrino and antineutrino interactions on an event-by-event basis. However, the fraction of CCQE events in antineutrino (neutrino) mode that are due to wrong-sign neutrino (antineutrino) events was determined from the angular distributions of muons created in CCQE interactions and by measuring CC single events [19].
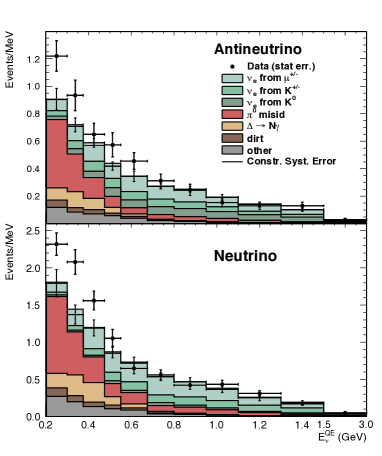
The predicted and CCQE background events for the neutrino oscillation energy range MeV are shown in Table 1 for both neutrino mode and antineutrino mode. MiniBooNE does not have the electron versus gamma particle identification capabilities to determine whether observed events are due to charged-current (CC) electron events, as expected for an oscillation signal or intrinsic beam background, or to background gamma events from neutral-current (NC) interactions in the detector or interactions in the external surrounding material. The estimated size of the intrinsic and gamma backgrounds are tied to MiniBooNE event measurements and uncertainties due to these constraints are included in the analysis. The intrinsic background from muon decay is directly related to the large sample of observed events since these events constrain the muons that decay in the 50 m decay region. (The CCQE data sample, in the MeV energy range, includes 115,467 and 50,456 neutrino and antineutrino events, respectively .) This constraint is accomplished using a joint fit of the observed events and the events assuming that there are no substantial disappearance oscillations. The other intrinsic background component from K-decay is constrained by fits to kaon production data and the recent SciBooNE measurements [18]. Other backgrounds from mis-identified or [20, 21] events are also constrained by the observed CCQE sample. The gamma background from NC production mainly from decay or radiative decay [22] is constrained by the associated large two-gamma data sample (mainly from production) observed in the MiniBooNE data [23]. In effect, an in-situ NC rate is measured and applied to the analysis. Single-gamma backgrounds from external neutrino interactions (“dirt” backgrounds) are estimated using topological and spatial cuts to isolate these events whose vertex is near the edge of the detector and point towards the detector center [3].
| Process | Neutrino Mode | Antineutrino Mode |
|---|---|---|
| & CCQE | 37.1 9.7 | 12.9 4.3 |
| NC | 252.3 32.9 | 112.3 11.5 |
| NC | 86.8 12.1 | 34.7 5.4 |
| External Events | 35.3 5.5 | 15.3 2.8 |
| Other & | 45.1 11.5 | 22.3 3.5 |
| & from Decay | 214.0 50.4 | 91.4 27.6 |
| & from Decay | 96.7 21.1 | 51.2 11.0 |
| & from Decay | 27.4 10.3 | 51.4 18.0 |
| Other & | 3.0 1.6 | 6.7 6.0 |
| Total Background | 797.7 | 398.2 |
| 0.26% | 233.0 | 100.0 |
Systematic uncertainties are determined by considering the predicted effects on the , , , and CCQE rate from variations of parameters. These include uncertainties in the neutrino and antineutrino flux estimates, uncertainties in neutrino cross sections, most of which are determined by in-situ cross-section measurements at MiniBooNE [20, 23], uncertainties due to nuclear effects, and uncertainties in detector modeling and reconstruction. A covariance matrix in bins of is constructed by considering the variation from each source of systematic uncertainty on the and CCQE signal, background, and and CCQE prediction as a function of . This matrix includes correlations between any of the and CCQE signal and background and and CCQE samples, and is used in the calculation of the oscillation fits.
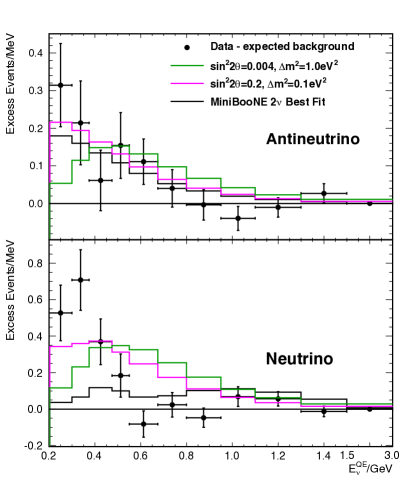
Fig. 1 (top) shows the distribution for CCQE data and background in antineutrino mode over the full available energy range. Each bin of reconstructed corresponds to a distribution of “true” generated neutrino energies, which can overlap adjacent bins. In antineutrino mode, a total of 478 data events pass the event selection requirements with MeV, compared to a background expectation of events. For assessing the probability that the expectation fluctuates up to this 478 observed value, the excess is then events or a 2.8 effect. Fig. 2 (top) shows the event excess as a function of in antineutrino mode.
Many checks have been performed on the data, including beam and detector stability checks that show that the neutrino event rates are stable to and that the detector energy response is stable to over the entire run. In addition, the fractions of neutrino and antineutrino events are stable over energy and time, and the inferred external event rate corrections are similar in both neutrino and antineutrino modes.
The MiniBooNE antineutrino data can be fit to a two-neutrino oscillation model, where the probability, , of oscillations is given by , , and . The oscillation parameters are extracted from a combined fit of the observed event distributions for muon-like and electron-like events. The fit assumes the same oscillation probability for both the right-sign and wrong-sign , and no significant , , , or disappearance. Using a likelihood-ratio technique [4], the confidence level values for the fitting statistic, , as a function of oscillation parameters, and , is determined from frequentist, fake data studies. The critical values over the oscillation parameter space are typically 2.0, the number of fit parameters, but can be as a low as 1.0 at small or large . With this technique, the best antineutrino oscillation fit for MeV occurs at (, ) (0.043 eV2, 0.88) but there is little change in probability in a broad region up to (, ) (0.8 eV2, 0.004) as shown in Fig. 3 (top). In the neutrino oscillation energy range of MeV, the for the above antineutrino-mode best-fit point is 5.0/7.0 with a probability of 66%. The background-only fit has a -probability of 0.5% relative to the best oscillation fit and a with a probability of 5.4%. Fig. 3 (top) shows the MiniBooNE closed confidence level (CL) contours for and appearance oscillations in antineutrino mode in the MeV energy range. The data indicate an oscillation signal region at the greater than 99% CL with respect to a no oscillation hypothesis, which is consistent with some parts of the LSND 99% CL allowed region and consistent with the limits from the KARMEN experiment [24].
Multinucleon processes and and disappearance can affect the results of the MiniBooNE oscillation analysis. Specifically, nuclear effects associated with neutrino interactions on carbon can affect the reconstruction of the neutrino energy, , and the determination of the neutrino oscillation parameters [25, 26, 27]. These effects can change the visible energy in the detector and the relative energy distribution for the signal and gamma backgrounds. These effects are partially removed in this analysis since the gamma background is determined from direct measurements of NC and dirt backgrounds.
In order to estimate the possible effects of a multinucleon-type model, an oscillation fit was performed using event predictions based on the Martini et al. [25] model. The prediction was implemented by smearing the input neutrino energies as a function of reconstructed energy to mimic the behavior of the model. For an estimate of the effects of disappearance oscillations, a (3+1) type model was used. Fits were performed where the appearance and parameters were varied as usual but disappearance oscillations were also included with and with the same . This is a disappearance model where all four types of neutrinos () disappear with the same effective . A comparison of the results for these models versus the nominal MiniBooNE analysis is given in Table 2. Results are presented for the best fit with the given prediction model and for a test point with eV2 and . The difference in values for the different prediction models is units, suggesting that multinucleon or disappearance effects do not significantly change the oscillation fit and null exclusion probabilities.
| values | ||
| Prediction Model | Best Fit | Test Pt. |
| Nominal mode Result | 5.0 | 6.2 |
| Martini et al. [25] Model | 5.5 | 6.5 |
| Model With Disapp. (see text) | 5.4 | 6.7 |

Even though the MiniBooNE antineutrino data is a direct test of the LSND oscillation hypothesis, the MiniBooNE neutrino-mode data can add additional information, especially for comparisons to various sterile neutrino models. The previous MiniBooNE oscillation analysis [2] found no evidence for neutrino oscillations in neutrino mode by fitting over the neutrino energy range MeV, excluding the low-energy range, MeV. The reason for excluding the low-energy region in the original analysis was based on uncertainties for the large gamma background in that region. The subsequent work on constraining the low energy background and making a more accurate assessment of the uncertainties now allow the data below 475 MeV to be used [3]. The neutrino-mode event and excess distributions for POT are shown in the bottom plots of Figs. 1 and 2, respectively. In neutrino mode, a total of 952 events are in the region with MeV, compared to a background expectation of events. This corresponds to a neutrino-mode excess of events with respect to expectation or a 3.4 excess.
Two-neutrino oscillation model fits to the MiniBooNE neutrino-mode data do show indications of oscillations as shown in Fig. 3 (bottom). In contrast to the antineutrino-mode results, the MiniBooNE favored neutrino-mode region has only small overlap with the LSND region and may indicate that the compatibility between the two is low in a simple two-neutrino model. The best neutrino oscillation fit occurs at (, ) (3.14 eV2, 0.002). In the neutrino oscillation energy range of MeV, the for the best-fit point is 13.2/6.8 with a fairly small probability of 6.1%, and the background-only fit has a -probability of 2% relative to the best oscillation fit and a with a probability of 0.5%. As shown in Fig. 2 (bottom), the poor for the neutrino-mode best fit is due to the data being higher than the expectation at low energy and lower at high energy. This may be due to the limitation of the simple two-neutrino model if the excess is due to oscillations or to some anomalous background at low energy if the excess is related to backgrounds.
In summary, the MiniBooNE experiment observes a total event excess in antineutrino mode running of events (2.8) in the energy range MeV. The allowed regions from a two-neutrino fit to the data, shown in Fig. 3 (top), are consistent with oscillations in the 0.01 to 1 eV2 range and have some overlap with the allowed region reported by the LSND experiment [1]. All of the major backgrounds are constrained by in-situ event measurements so non-oscillation explanations would need to invoke new anomalous background processes. The neutrino mode running also shows an excess of events (), but the energy distribution of the excess is marginally compatible with a simple two neutrino oscillation formalism. While this incompatibility might be explained by unexpected systematic uncertainties and backgrounds, expanded oscillation models with several sterile neutrinos can reduce the discrepancy by allowing for CP violating effects. On the other hand, global fits [12] with these expanded models show some incompatibility with the current upper limits on electron and muon neutrino disappearance that will need new data and studies to resolve.
Acknowledgements.
We acknowledge the support of Fermilab, the Department of Energy, and the National Science Foundation, and we acknowledge Los Alamos National Laboratory for LDRD funding.References
- [1] C. Athanassopoulos et al., Phys. Rev. Lett. 75, 2650 (1995); 77, 3082 (1996); 81, 1774 (1998); Phys. Rev. C. 58, 2489 (1998); A. Aguilar et al., Phys. Rev. D 64, 112007 (2001).
- [2] A. Aguilar-Arevalo et al., Phys. Rev. Lett. 98, 231801 (2007).
- [3] A. A. Aguilar-Arevalo et al., Phys. Rev. Lett. 102, 101802 (2009).
- [4] A. Aguilar-Arevalo et al., Phys. Rev. Lett. 105, 181801 (2010).
- [5] G. Mention, M. Fechner, T. Lasserre, T. A. Mueller, D. Lhuillier, M. Cribier, and A. Letourneau, Phys. Rev. D 83, 073006 (2011).
- [6] C. Giunti and M. Laveder, Phys. Rev. C 83, 065504 (2011).
- [7] M. Sorel, J. M. Conrad and M. H. Shaevitz, Phys. Rev. D 70, 073004 (2004).
- [8] G. Karagiorgi, Z. Djurcic, J. M. Conrad, M. H. Shaevitz and M. Sorel, Phys. Rev. D 80, 073001 (2009); D 81, 039902(E) (2010).
- [9] C. Giunti and M. Laveder, Phys. Lett. B 706, 200 (2011); Phys. Rev. D84, 073008, (2011).
- [10] J. Kopp, M. Maltoni and T. Schwetz, Phys. Rev. Lett. 107, 091801 (2011).
- [11] K. N. Abazajian et al., arXiv:1204.5379 [hep-ph] (2012).
- [12] J. M. Conrad, C. M. Ignarra, G. Karagiorgi, M. H. Shaevitz, and J. Spitz, arXiv:1207.4765 [hep-ex] (2012).
- [13] V. A. Kostelecky and M. Mewes, Phys. Rev. D 69, 016005 (2004); T. Katori, V. A. Kostelecky, and R. Tayloe, Phys. Rev. D 74, 105009 (2006).
- [14] S. N. Gninenko, Phys. Rev. Lett. 103, 241802 (2009); S. N. Gninenko and D. S. Gorbunov, Phys. Rev. D 81, 075013 (2010).
- [15] A. A. Aguilar-Arevalo et al., Phys. Rev. D 79, 072002 (2009).
- [16] A. A. Aguilar-Arevalo et al., Nucl. Instrum. Meth. A 599, 28 (2009).
- [17] R. B. Patterson et al., Nucl. Instrum. Meth. A 608, 206 (2009).
- [18] G. Cheng et al., Phys. Rev. D84, 012009 (2011).
- [19] A. A. Aguilar-Arevalo et al., Phys. Rev. D 84, 072002 (2011).
- [20] A. A. Aguilar-Arevalo et al., Phys. Rev. D 81, 092005 (2010); Phys. Rev. Lett. 100, 032301 (2008).
- [21] A. A. Aguilar-Arevalo et al., Phys. Rev. D 83, 052007 (2011); Phys. Rev. Lett. 103, 081801 (2009).
- [22] J. P. Jenkins and T. Goldman, Phys. Rev. D 80, 053005 (2009); Richard J. Hill, Phys. Rev. D 81, 013008 (2010); B. D. Serot and X. Zhang, Phys. Rev. C 86, 015501 (2012) ; X. Zhang and B. D. Serot, Phys. Rev. C 86, 035502 (2012); Phys. Rev. C 86, 035504 (2012).
- [23] A. A. Aguilar-Arevalo et al., Phys. Rev. D 81, 013005 (2010); Phys. Lett. B. 664, 41 (2008).
- [24] B. Armbruster et al., Phys. Rev. D 65, 112001 (2002).
- [25] M. Martini, M. Ericson, and G. Chanfray, Phys. Rev. D 85, 093012 (2012); Phys. Rev. D 87, 013009 (2013).
- [26] O. Lalakulich, U. Mosel, and K. Gallmeister, Phys. Rev. C 86, 054606 (2012).
- [27] J. Nieves, F. Sanchez, I. Ruiz Simo, and M. J. Vicente Vacas, arXiv:1204.5404 [hep-ph] (2012).
- [28] M. Antonello et al., arXiv:1209.0122 [hep-ex].