Photometric variability in FU Ori and Z CMa as observed by
MOST††thanks: Based on data from:
- the MOST satellite, a Canadian Space Agency mission, jointly operated
by Dynacon Inc., the University of Toronto Institute of Aerospace
Studies, and the University of British Columbia, with the assistance
of the University of Vienna, and
- the Mount Suhora Observatory, Cracov Pedagogical University.
Abstract
Photometric observations obtained by the MOST satellite were used to characterize optical small scale variability of the young stars FU Ori and Z CMa. Wavelet analysis for FU Ori reveals the possible existence of several 2–9 d quasi-periodic features occurring nearly simultaneously; they may be interpreted as plasma parcels or other localized disc heterogeneities revolving at different Keplerian radii in the accretion disc. Their periods may shorten slowly which may be due to spiralling in of individual parcels toward the inner disc radius, estimated at R⊙. Analysis of additional multicolour data confirms the previously obtained relation between variations in the colour index and the magnitude. In contrast to the FU Ori results, the oscillation spectrum of Z CMa does not reveal any periodicities with the wavelet spectrum possibly dominated by outburst of the Herbig Be component.
keywords:
star: individual: FU Ori, Z CMa, stars: accretion: accretion discs.1 Introduction
This paper presents results obtained for two well known young stars, FU Ori and Z CMa, as a continuation of the MOST satellite photometric variability studies of Young Stellar Objects.
FU Ori is an object of special interest which has been known since 1937, when in a timescale of one year its brightness rose from 16 to 9.5 mag (in the photographic blue-band system) and then started to decay slowly at the rate of 0.015 mag/yr (Wachmann, 1939; Kenyon et al., 2000). This outburst, and two similar events observed in the early 1970’s in V1057 Cyg and V1515 Cyg, led to the creation of a class of eruptive young stars – “FUor” stars (Herbig, 1977) – currently consisting of about 20 members (Semkov & Peneva 2010, 2012, Miller et al. 2011). The pre-outurst spectra of FUors obtained for two members of the class, V1057 Cyg and V2493 Cyg (HBC 722), revealed that the progenitors were Classical T Tauri- type stars (CTTS).
An enhanced accretion in the disc at a rate of about
, resulting in a major increase of
the disc surface brightness and dominating over the stellar
flux, was proposed as the source of the
FUor outbursts (Hartmann & Kenyon, 1985, 1996).
Discovery of companions to FU Ori, Z CMa and other FUors (Wang et al. 2004; Reipurth & Aspin 2004),
has initiated discussion whether FUor outbursts may be triggered
by perturbations in the accretion discs at close periastron passage
(Bonnell & Bastien, 1992; Reipurth & Aspin, 2004).
During an outburst of a FUor,
emission lines, which are typical for CTTSs, almost completely disappear
while the visual spectrum is dominated by absorption features produced
in an inner accretion disc radiating as a stellar atmosphere
of a F-G supergiant star. The outer, colder parts of the FUor
discs produce a K-M type supergiant
spectrum observable in the infrared (Kenyon et al., 1988).
In accordance with the location of the brightest
parts of the Keplerian disc seen in different wavelengths,
the absorption line broadening diminishes from the visual
to the near- and mid-infrared spectral regions, as observed
for FU Ori by Kenyon & Hartmann (1989), Hartmann et al. (2004) and Zhu et al. (2009).
Z CMa was recognized as a young star by Herbig (1960). The discovery, using infrared speckle interferometry, that the star is a very close 0.1 arcsec visual binary (Koresko et al., 1991; Hass et al., 1993), resolved the initial difficulties in interpretation of the complex spectral properties of the star (Covino et al., 1984). Spectropolarimeric observations revealed that it is the Herbig Be component of the binary which dominates the infrared continuum and total luminosity of the system. The same star is apparently the source of the emission lines polarized in the dusty disc envelope and observed in visual part of the spectrum (Whitney et al., 1993). The Herbig Be star is also responsible for mag outbursts (van den Ancker et al., 2004; Grankin & Artemenko, 2009), caused by variable scattering geometry (Szeifert et al., 2010), periods of strong mass loss from the disc (Benisty et al., 2010), or the EXor outburst (Whelan et al., 2010). These outbursts are superimposed on the slowly decaying light curve of the visually brighter FUor star. This component contributes a typical – for FUors – rotationally broadened absorption spectrum produced in the accretion disc (Welty et al., 1992); it supplied about 80% of the observed unpolarized flux at visual wavelengths (Whitney et al., 1993) when the system brightness was mag.
Kenyon et al. (2000) argued that similarly to cataclysmic variables, accretion discs of FUors should produce flickering variability as a characteristic signature observable at visual wavelengths. By comparing a limited amount of ground-based data to the Monte-Carlo synthetic variability model the authors suggested the possibility of d quasi-periodicities with a -band amplitude of about 0.035 mag, which would originate in the inner edge of the FU Ori disc. Motivated by these results and by the lack of similar studies for Z CMa, we decided to re-examine this issue by means of continuous, high precision, space-based photometric observations. Additionally, to obtain information on the wavelength-amplitude dependence of the flickering, we observed FU Ori simultaneously by means of a ground-based telescope using intermediate-width Strömgren and filters. We describe details of these observations in Section 2. The methods used for light curve analysis and the results obtained for our targets are presented in Section 3 and then summarized in Section 4.
2 Observations and data reductions
The optical system of the MOST satellite consists of a Rumak-Maksutov f/6, 15 cm reflecting telescope. The custom broad-band filter covers the spectral range of 380 – 700 nm with the effective wavelength falling close to the Johnson band. The pre-launch characteristics of the mission are described by Walker et al. (2003) and the initial post-launch performance by Matthews et al. (2004).
The stars investigated in this paper were observed in the direct-imaging mode of the satellite. FU Ori was observed nearly continuously for 28 days between 13 December, 2010 and 9th January, 2011, during 362 satellite orbits. The individual exposures were 30 s during the first part of the run and 60 s during the last 10 days of the run. Immediately after the FU Ori observations, on 10 January 2011 MOST started a 13 day long monitoring of Z CMa, which was observed with 60 s exposures. Some occasional interruptions in data acquisition, visible in the light curves (Figure 1) did not impact the scientific results.
The dark and flat calibration frames for the MOST data were obtained by averaging a dozen empty-field images specifically taken during each observing run, or – for the case of the 30 sec long exposures of FU Ori – from frames with the target localized far beyond its optimal position due to occasional satellite guiding errors. Aperture photometry of the stars was obtained from the dark and flat corrected images by means of the DAOPHOT II package (Stetson, 1987). As in our previous investigations, a weak correlation between the star flux and the sky background level within each MOST orbit was noted and removed; it was most probably caused by a small photometric nonlinearity in the electronic system (see Siwak et al. 2010). As a result, we obtained very good quality light curves, particularly for Z CMa (see Fig. 1). In the analysis we used the satellite-orbit (101 min) averages for FU Ori whose median error was 0.0036 of the mean normalized flux. We note that FU Ori is surrounded by a bright nebula which slightly decreased the photometric accuracy of the data. For the brighter Z CMa, the data were binned into smaller, 14.5 min bins consisting of typically 10 – 15 observations with the median error 0.0011 per bin. The finer binning was done in order to preserve information on the short time-scale variability of the star.
During four nights of Jan 4, 5, 8, 9, 2011, we simultaneously observed FU Ori in and Strömgren filters using the 60 cm telescope at the Mount Suhora Observatory, Cracow Pedagogical University. We were unable to obtain similar data for Z CMa due to poor weather conditions. The data were reduced in a standard way in the ESO-MIDAS software environment. Aperture photometry was obtained with the DAOPHOT II package. The photometry of FU Ori was done differentially utilizing a mean comparison star made of the three nearby, somewhat fainter stars having colour indices similar to FU Ori (Tab. 1). Thanks to the proximity of the stars and similarity of the colours, corrections for differential and colour extinction were unnecessary.
*The average magnitude of FU Ori during MOST observations as obtained from observations made by Konstatin Grankin (priv.comm.), Bruno Alain and Timar Andras (AAVSO).
| star | V | B-V |
|---|---|---|
| FU Ori | 9.74∗ | 1.279(47) |
| GSC 00714-0203 | 10.555(88) | 1.069(85) |
| GSC 00715-0188 | 10.682(93) | 1.646(241) |
| GSC 00715-0123 | 11.337(119) | 0.960(194) |


3 Results of the light-curve analysis
We performed analysis of the MOST data in a similar way to Rucinski et al. (2008, 2010) and Siwak et al. (2011), i.e. the Fourier analysis was done by simple least-squares fits of expressions of the form for an appropriate range of frequencies , with the step of . The amplitude a(f) for each frequency was evaluated as the modulus of the periodic component, . The bootstrap sampling technique permitted evaluation of mean standard errors of the amplitudes from the spread of the coefficients . This technique, for a uniform temporal sampling – as in our case – may give too pessimistic estimates of errors, but consistently we prefer this conservative approach.
For the Fourier analysis of the FU Ori variability, we used 362 mean-orbital data points, while in the case of Z CMa, which is much brighter, all 15404 measurements, obtained every 60 sec were used. For the wavelet analysis of Z CMa, the data have been averaged and partly interpolated into 1291 points on an equal-spacing grid at 0.010067 d (14.5 min) steps. Similar interpolation for FU Ori, which suffered more interruptions, led to mapping into a grid of 395 points. The Morlet-6 wavelet provided the best match between the time-integrated power spectrum and original frequency spectrum of both FU Ori and Z CMa. This was noticed by Rucinski et al. (2008) and encountered later by Rucinski et al. (2010) and Siwak et al. (2011). The Morlet transforms of other orders result in systematic differences in the period scale.
3.1 FU Ori
3.1.1 Analysis of the Fourier and the wavelet spectrum
The upper envelope of peak amplitudes in the Fourier transform
of the FU Ori data (Fig. 2, left panel) appears
to scale as flicker noise, , where is the frequency.
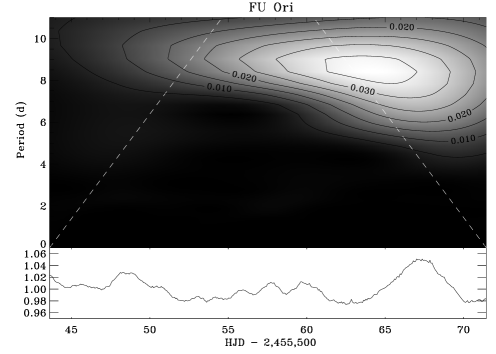
The first most prominent maximum at c/d
is visible as the largest and most intense
feature in the wavelet spectrum (Fig. 3, left panel) and directly
in the light curve.
Its period shortens gently from 9 to 8 days,
somewhat similarly to the case of TW Hya (Rucinski et al., 2008; Siwak et al., 2011).
However, we note that this periodicity is based on only three
cycles so that its reality may be questioned. To test the validity
of our results, we conducted tests on recovery of drifting,
quasi-periodic features which additionally change their amplitudes.
In each case we obtained very satisfactory reproduction of synthesised
light curves, including the rates of period and amplitude changes.
Following our interpretation of TW Hya,
we assume that the oscillation feature is produced by plasma
condensations and/or other accretion disc heterogeneities,
in turn produced by interactions of stellar magnetic field with
the inner disc plasma, although we have no clear picture what
causes these instabilities.
If this is a correct view, then the period variations
reflect a change in localization within the disc at radii (estimated
from Keplerian periods) from about 12.2 to 11.3 R⊙,
assuming a central star mass of 0.3 M⊙ (Zhu et al., 2007).
The low inclination of the accretion disc
of 55 deg (Malbet et al., 2005) should indeed permit to observe such
inner disc structural changes.
Other peaks in the Fourier spectrum (Figure 2) localized at f = 0.166, 0.215 and 0.263 c/d, (P = 6.0, 4.7 and 3.8 d, respectively) are represented by the much fainter and apparently constant features visible in different parts of the wavelet spectrum. They cannot be well characterized and may actually represent processing artifacts for the relatively short dataset or a pure random flickering. We note that these three periodicities are not directly visible in the FU Ori light curve.
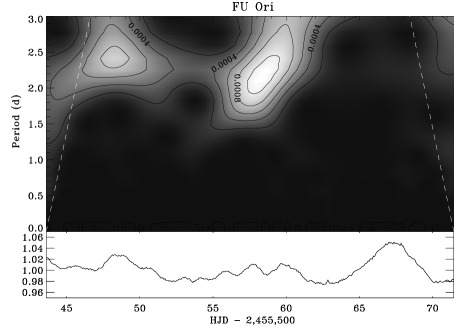
In addition to the features described above, the light curve contains a well defined directly visible short-periodic signal at c/d, which disappears after . To improve its visibility we prepared a second wavelet image (Fig 4), which reveals one apparently drifting feature with two well-defined peaks: the first one is localized at d and the second at d. Within the model of orbiting plasma in the inner disc this would correspond to the Keplerian radii within 5.1 to 4.8 R⊙. We do not see any obvious short-period signals at periods shorter than d which may indicate that the inner accretion disc is truncated at about 4.8 R⊙. This value is in agreement with the inner disc radius of 5.5 R⊙ obtained from interferometric observations by Malbet et al. (2005) but is 3 times smaller from that obtained by Eisner & Hillenbrand (2011) – R⊙.
3.1.2 Analysis of multicolour observations
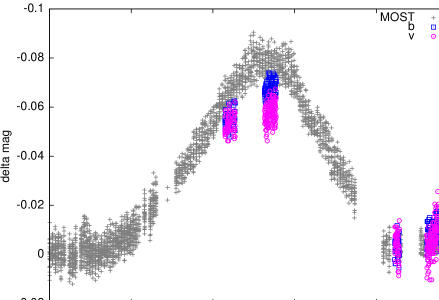
Although the weather conditions during the ground-based observations were poor, we were very fortunate to have the four clear nights exactly when the star showed both the maximum and the minimum of its 8 d long oscillation (Fig 5). This enabled us to address the wavelength-amplitude dependence in the (4670Å) and (4110Å) filters of the Strömgren photometry.
As discussed by Kenyon et al. (2000), the observed variability amplitudes decrease at shorter wavelengths. In order to compare our results with the relation of the changes and found by Kenyon et al. (2000), we used the average magnitudes in our two filters and found the mean colour index mag. It is larger by 0.06 mag than that returned by Equation 6 of the Kenyon et al. (2000) paper, but agrees with their finding that the colour index becomes redder as the star becomes brighter. This relation allowed the authors constrain the effective spectrum producing the flickering to F7–G3 spectral type.
The 0.06 mag difference in the colour index can be explained by the difference in the location of the dominant source of the observed stellar flux. The respective annuli in the disc, at different Keplerian distances, should produce different wavelength-amplitude relations. The 9–8 d oscillation feature is assumed to be produced at the distance of , where according to FU Ori disc models (Zhu et al., 2007), K, so that the maximum energy is located at . Obviously, the amplitudes of flux variations arising at such a large distance are considerably reduced by the dominant flux produced in the innermost disc. As the feature approaches the central star on a spiral orbit, it moves to warmer disc annuli. As a consequence, the wide-band MOST filter receives initially a small fraction of the energy emitted at 12 R⊙, but then this fraction increases as the spiralling-in process continues.
Changes in the amplitude of the 9–8 day periodic feature may be questioned in view of the duration of the whole MOST observations lasting 4 weeks. However, the general trend of the progressively growing amplitude as the period shortens seem to be visible both, directly in the light curve (Fig 1, left panel) and in the wavelet spectrum (Fig 3, left panel). The amplitude reached about 0.03 mag in the first and the second cycle (the overlapping non-sinusoidal oscillations do not allow for a more accurate estimate), and 0.075 mag in the third. Once again we stress, that this finding bases on three oscillations only. However, our data do reveal a similar effect, of the amplitude growing up from 0.005 mag to 0.02 mag, also for the d feature; such a drift would correspond to a motion from 5.1 to 4.8 R⊙, where the disc annuli have temperatures K (Zhu et al., 2007). The difference in the amplitudes with Kenyon et al. (2000) may have resulted from averaging of independent wave trains during their observations or may reflect a real, physical difference in sizes of the gas elements.
3.2 Z CMa
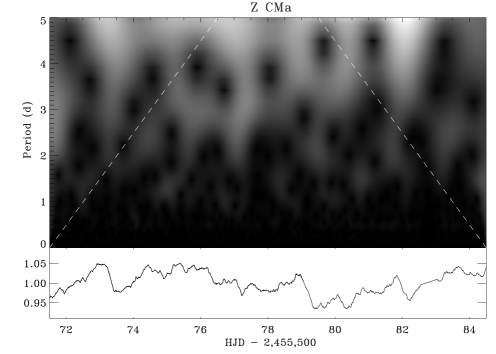
As mentioned in Section 1, about 80% of the unpolarized visual flux of Z CMa is produced by the FUor component. The direct flux from the Herbig Be star is obscured by a dusty envelope and visible as scattered continuum light, which is polarized at about 6% and as emission lines (Whitney et al., 1993). The MOST satellite does not have any polarization capabilities and measures the total flux. The observations in January 2011 were obtained during the light maximum of a new outburst when, according to the AAVSO database, the average total system brightness was mag. This may explain the chaotic shape of the wavelet transform (Fig. 3, right panel) containing many incoherent variations down to time scales of about 0.3 day. At least a part of these oscillations may have their origin in the night-to-night and hour-to-hour variations of Hα, Hβ, Na I D P Cygni absorptions and in the Hβ emission peak (Chochol et al., 1998). Also, from speckle observations obtained in the infrared filters Hass et al. (1993) reported that both components of the close visual double were varying independently by mag.
The time variability spectrum of Z CMa is somewhat similar to that of the Herbig Ae star HD 37806 (Rucinski et al., 2010). The chaotic variability at all time scales and lack of any regularity in the Fourier or wavelet transforms strongly suggest that the time variability spectrum is dominated by the Be component which contributes at least 20% to the total flux. Lack of any firm results is compounded by the relatively short duration of the observation run which lasted only 13 days. Unfortunately, the MOST observations of Z CMa done one year earlier, in 2010, obtained in a time of relatively moderate light variations were of a very poor quality due to technical problems.
4 Summary
Continuous MOST satellite observations of FU Ori and Z CMa confirmed presence of intensive, rapid (time scales of single days) variations of their light which may have general characteristics of the flicker noise with amplitudes scaling as: , similar to the Classical T Tauri star TW Hya (Rucinski et al., 2008; Siwak et al., 2011). For FU Ori, the Fourier and wavelet transform spectra show quasi-periodic features, one well defined and possibly changing its period within 9 to 8 day, and one much fainter, at about 2.4 days drifting down to 2.2 days. But we note an absence of any 1-day periodicity in our data, contrary to the Kenyon et al. (2000) results which were obtained from a limited amount of unequally-spaced, poor-quality data. We tentatively interpret these quasi-periodic variations as produced by hot plasma condensations and/or disc heterogeneities which develop in the magneto-rotationaly unstable inner parts at the Keplerian distances of about 12 and 5 R⊙. The period variability may be interpreted as a spiralling-in or inward drifts in the innermost disc. The shortest observed period of d may define the inner edge of the accretion disc at R⊙, which agrees with the estimate of Malbet et al. (2005) from the interferometric observations. Within the disc-locking mechanism picture of the accretion processes, the rotational period of the star would be then close to 2 days. Although this was the interpretation of such oscillatory features for TW Hya (Rucinski et al., 2008; Siwak et al., 2011), Herbst (priv. comm.) argued that for the case of TW Hya, hot condensation in the disc could not easily produce up to 20% flux variations observed in the visual spectrum which is dominated by the central star. This is indeed a valid point, but we note that for the case of FU Ori the accretion disc luminosity overwhelms that of the central star by about 100.
Two colour Strömgren and ground-based observations of FU Ori confirmed the versus relation obtained by Kenyon et al. (2000). However, we obtained slightly redder colour index of the dominant variations, what may be due to a more outward hotspot location (causing the 8 d periodicity) during our observations. This would agree with the interpretation of the wavelength-amplitude relationship through different locations of the dominant variable flux, with longer periods produced by more external and cooler parts of the accretion disc. In generally this effect may manifest itself within the wide-band MOST light curve and in the wavelet transform of the star variability as the amplitudes of the two drifting, oscillatory features markedly increased as their periods decreased. Future simultaneous MOST and ground-based, multi-band observations conducted over a few months may help in investigation of the wavelength-amplitude relation for a range of possible periods. Such observations should be supported by spectral synthesis disc models, to localize the dominant light sources at various inner disc concentric annuli.
Z CMa, the complex binary consisting of a FUor and Herbig Be stars, was observed by MOST during 13 days close in time to the outburst maximum of the Herbig Be component. This led to the suppression of the FUor variability component and dominance of the very chaotic spectrum of oscillations of the Be component. The variability spectrum is somewhat similar to that of the Herbig Ae star HD 37806 (Rucinski et al., 2010). Future observations during quiescence level could help to disentangle the two light contributions.
Acknowledgments
MS thanks the Mount Suhora Observatory Staff for the very generous time
allocation and the hospitality, as well as the Canadian Space Agency
Post-Doctoral position grant to Prof. Slavek M. Rucinski within the framework
of the Space Science Enhancement Program.
The Natural Sciences and Engineering Research Council of
Canada supports the research of DBG, JMM, AFJM, and SMR.
Additional support for AFJM comes from FQRNT (Québec).
RK is supported by the Canadian Space Agency and WWW is supported
by the Austrian Science Funds (P22691-N16).
We acknowledge with thanks the two anonymous referees for the very valuable comments
concerning important issues of this paper, as well as the variable star observations
from the AAVSO International Database contributed by observers worldwide
and used in this research.
This research has made use of the SIMBAD database, operated at CDS,
Strasbourg, France and NASA’s Astrophysics Data System (ADS) Bibliographic
Services.
References
- Benisty et al. (2010) Benisty M., Malbet F., Dougados C., Natta A., Le Bouquin J. B., et al., 2010, A&A, 517, L3
- Bonnell & Bastien (1992) Bonnell I., Bastien P., 1992, ApJ, 401, L31
- Covino et al. (1984) Covino E., Terranegra T., Vittone A. A., Russo G., 1984, AJ, 89, 12
- Chochol et al. (1998) Chochol D., Teodorani M., Strafella F., Errico L., Vittone A. A., 1998, MNRAS, 293, L73
- Eisner & Hillenbrand (2011) Eisner J. A., Hillenbrand L. A., 2011, ApJ, 738, 9
- Grankin & Artemenko (2009) Grankin K. N., Atremenko S. A., 2009, IBVS, 5905, 1
- Hartmann & Kenyon (1985) Hartmann L., Kenyon S. J., 1985, ApJ, 299, 462
- Hartmann & Kenyon (1996) Hartmann L., Kenyon S. J., 1996, ARA&A, 34, 207
- Hartmann et al. (2004) Hartmann L., Hinkle K., Calvet N., 2004, ApJ, 609, 906
- Hass et al. (1993) Hass M., Christou J. C., Zinnecker H., Ridgway S. T., Leinert Ch., 1993, A&A, 269, 282
- Herbig (1960) Herbig G. H., 1960, ApJS, 4, 337
- Herbig (1977) Herbig G. H., 1977, ApJ, 217, 693
- Kenyon et al. (1988) Kenyon S. J.,Hartmann L., Hewett R., 1988, ApJ, 325, 231
- Kenyon & Hartmann (1989) Kenyon S. J., Hartmann L., 1989, ApJ, 342, 1134
- Kenyon et al. (2000) Kenyon S. J., Kolotilov E. A., Ibragimov M. A., Mattei J. A., 2000, ApJ, 531, 1028
- Koresko et al. (1991) Koresko C. D., Beckwith S. V. W., Ghez A. M., Matthews K., Neugebauer N., 1991, AJ, 102, 2073
- Malbet et al. (2005) Malbet F., Lachaume R., Berger J.-P., Colavita M. M., Folco E.Di, et al., 2005, A&A, 437, 627
- Matthews et al. (2004) Matthews J. M., Kusching R., Guenther D. B., Walker G. A. H., Moffat A. F. J., Rucinski S. M., Sasselov D., Weiss W. W., 2004, Nature, 430, 51
- Miller et al. (2011) Miller A. A., Hillenbrand L. A., Covey K. R., Poznanski D., Silverman J. M., et al., 2011, ApJ, 730, 80
- Reipurth & Aspin (2004) Reipurth B., Aspin B., 2004, ApJ, 608, L65
- Rucinski et al. (2008) Rucinski S. M., et al., Matthews J. M., Kuschnig R., Pojmanski G., Rowe J., Guenther D. B., Moffat A. F. J., Sasselov D., Walker G. A. H., Weiss W. W., 2008, MNRAS, 391, 1913
- Rucinski et al. (2010) Rucinski S. M., et al., Matthews J. M., Kuschnig R., Pojmanski G., Rowe J., Guenther D. B., Moffat A. F. J., Sasselov D., Walker G. A. H., Weiss W. W., 2010, A&A, 391, 1913
- Semkov & Peneva (2010) Semkov E., Peneva S., 2010, ATel, 2819
- Semkov & Peneva (2012) Semkov E., Peneva S., 2012, A&A, 542, 43
- Siwak et al. (2010) Siwak M., Rucinski S. M., Matthews J. M., Kuschnig R., Guenther D. B., Moffat A. F. J., Sasselov D., Weiss W. W., 2010, MNRAS, 408, 314
- Siwak et al. (2011) Siwak M., Rucinski S. M., Matthews J. M., Kuschnig R., Guenther D. B., Moffat A. F. J., Sasselov D., Weiss W. W., 2011a, MNRAS, 410, 2725
- Stetson (1987) Stetson P. B., 1987 PASP, 99, 191
- Szeifert et al. (2010) Szeifert T., Hubrig S., Schöller M., Schütz O., Stelzer B., Mikulasek Z., 2010, A&A, 509, L7
- van den Ancker et al. (2004) van den Ancker M., Blondel P., Tjin A Djie H., Grankin K. N., Ezhkova O. V., Shevchenko V. S., Guenther E., Acke B., 2004, MNRAS, 349, 1516
- Wachmann (1939) Wachmann A. A. 1939, IAU Circ., 738, 1
- Walker et al. (2003) Walker G. A. H., Matthews J. M., Kuschnig R., Johnson R., Rucinski S. M., Pazder J., Burley G., Walker A., Skaret K., Zee R., Grocott S., Carroll K., Sinclair P., Sturgeon D., Harron J., 2003, PASP, 115, 1023
- Wang et al. (2004) Wang H., Apai D., Henning Th., Pascucci I., 2004, ApJ, 601, L83
- Welty et al. (1992) Welty A. D., Strom S. E., Edwards S., Kenyon S. J., Hartmann L.W., 1992, ApJ, 397, 260
- Whelan et al. (2010) Whelan E. T., Dougados C., Perrin M. D., Bonnefoy M., Bains I., et al., 2010, ApJ, 720, L119
- Whitney et al. (1993) Whitney B., Clayton G., Schulte-Ladbeck R., Calvet N., Hartmann L., Kenyon S., 1993, ApJ, 417, 687
- Zhu et al. (2007) Zhu Z., Hartmann L., Calvet N., Hernandez J., Muzerolle J., Tannirkulam A.-K., 2007, ApJ, 669, 483
- Zhu et al. (2009) Zhu Z., Espaillat C., Hinkle K., Hernandez J., Hartmann L., Calvet N., 2009, ApJ, 694, L64