RNA-Seq Mapping Errors When Using Incomplete Reference Transcriptomes of Vertebrates
Alexis Black Pyrkosz1, Hans Cheng1, C. Titus Brown2,∗
1 Avian Disease Oncology Laboratory, USDA, East Lansing, MI, USA
2 Microbiology Department, Michigan State University, East Lansing, MI, USA
E-mail: Corresponding ctb@msu.edu
Abstract
Whole transcriptome sequencing is increasingly being used as a functional genomics tool to study nonmodel organisms. However, when the reference transcriptome used to calculate differential expression is incomplete, significant error in the inferred expression levels can result. In this study, we use simulated reads generated from real transcriptomes to determine the accuracy of read mapping, and measure the error resulting from using an incomplete transcriptome. We show that the two primary sources of counting error are 1) alternative splice variants that share reads and 2) missing transcripts from the reference. Alternative splice variants increase the false positive rate of mapping while incomplete reference transcriptomes decrease the true positive rate, leading to inaccurate transcript expression levels. Grouping transcripts by gene or read sharing (similar to mapping to a reference genome) significantly decreases false positives, but only by improving the reference transcriptome itself can the missing transcript problem be addressed. We also demonstrate that employing different mapping software does not yield substantial increases in accuracy on simulated data. Finally, we show that read lengths or insert sizes must increase past 1kb to resolve mapping ambiguity.
Introduction
Whole transcriptome sequencing using RNA sequencing (RNA-Seq) has grown in popularity for studying organisms in agriculture, evolution, and medicine [1, 2, 3]. Next generation sequencing (NGS) technology has evolved to the point where the cost is within financial range for many labs, and the resultant data can be mined for a range of applications [4]. However, the computational pipelines to process RNA-Seq data were developed for organisms with well-studied reference transcriptomes. In this study, we use simulations to assess the accuracy of a key part of this pipeline, mapping short reads to a reference transcriptome, and quantify the error arising from incomplete transcriptomes and alternative splicing.
RNA-Seq, deep sequencing of cDNA, can be used to generate a transcriptome that includes alternative splice variants, and can also be used to estimate the expression level of these transcripts [5, 6, 7, 8, 9, 10, 11, 12, 13, 14]. Transcripts can be quantified and analyzed for differential expression between samples. Current RNA-Seq approaches use shotgun sequencing with short-read technologies such as Illumina, in which millions or billions of 50-150 bp reads are generated from a randomly fragmented cDNA library. Because these reads are not long enough to span most complete transcripts, expression levels must be inferred by using a reference transcriptome.
Current approaches for converting read data into transcript expression levels consist of 1) obtaining a reference transcriptome, 2) mapping reads to the reference, and 3) applying statistical estimation to obtain expression levels and compare transcript expression across conditions. The first step makes use of either an existing reference transcriptome or building a transcriptome from the RNA-Seq reads via reference-guided or de novo assembly [15, 16, 17]. Because many publicly available reference transcriptomes are incomplete [4], researchers must often assemble their own reference [18], a nontrivial task that requires building contiguous regions from many overlapping short, low quality reads [1]. This is usually accomplished using de Bruijn graphs that model reads as overlapping subsequences (k-mers) and build a graph of nodes that can be traversed to generate transcripts [19, 20, 21, 22]. Reads derived from low expression transcripts can be so low in abundance that they are difficult to distinguish from errors and therefore can be difficult to assemble [23, 24]. Transcriptome assembly is particularly complicated in plants and animals because alternative splice variants often share exons, and distinct transcripts can be difficult to resolve [25, 26, 27].
The second step requires matching each read to a transcript, a process usually performed by a fast indexing algorithm. Mapping performed against a reference transcriptome typically results in high matching accuracy between the reads and reference as reads originating from unassembled transcripts will be discarded or mismapped [28, 29]. Most mapping software was benchmarked with experimental genomic data from Homo sapiens with emphasis on sensitivity as opposed to accuracy. One critical mapping parameter is how to handle multimap reads, i.e., reads that map equally well to multiple locations in the transcriptome [18]. These are usually caused by alternative splice variants that share exons or repetitive regions or recently divergent homologs [30]. Some studies have placed the number of multimap reads for a mammalian genome between 10 and 40% [28, 6, 11]. The default setting for most mapping software is to randomly select a position from the possible matches, whether this is the highest scoring position best or the first position that matches a threshold score. Alternatively, this parameter can be set to map only unique reads, which discards a large number of reads. The parameter can also be set to multimap, which reports all matching positions per read to be screened by another technique. Studies to statistically distribute multimap reads have had varying levels of success, starting with the rescue method of using unique reads to initially estimate expression levels, fractionally allocating multimap reads, and reestimating, and expanding to fitting multimap read allocations to various statistical models [11, 10, 31, 32, 33, 34, 15, 35, 36] and using exon expression levels [37, 38]. Some studies have indicated that accurately allocating all multimap reads to transcripts cannot be done because some splice variants are linear combinations of other splice variants [39, 40].
The third step determines transcript/gene expression levels and finds differentially expressed transcripts/genes. Because we cannot directly measure whole-transcript expression with current technology, a variety of sophisticated models have been used to infer transcript expression from mapped reads (reviewed in [36]).
A key question for researchers working with RNA-Seq is the extent to which expression analysis depends on the quality and completeness of their reference transcriptome. An incomplete reference transcriptome can result in inaccurate read assignment due to missing transcripts, and this can bias downstream expression analyses. A related question is whether longer reads or (for paired-end sequencing) larger fragment sizes can yield improved mapping specificity.
In this study we determine the mapping and transcript expression accuracy that can be expected for a RNA-Seq experiment on a vertebrate with an incomplete reference transcriptome. We first simulate small data sets for real and artificial transcriptomes using both single and paired-end reads and quantify the mapping error resulting from alternative splice variants. We then use larger simulated read sets for real transcriptomes and demonstrate the effects of alternative splice variants and incomplete reference transcriptome on read mapping accuracy. We next determine the error in transcript expression and show that grouping transcripts by gene or shared sequence can improve accuracy. Finally, we simulate reads of increasing length to determine what read length is needed for higher accuracy.
Results
Read Simulations
To evaluate the accuracy of mapping, read sets were simulated where each read was annotated with its originating transcript. The transcriptomes used were either chicken, mouse, or randomly generated (see Methods). To simulate Illumina reads, single end reads were 100 bp and paired end reads were 100 bp with 250 bp insert size. An error rate of 1% was simulated by applying a random substitution error to the simulated reads. Reads were generated from randomly selected 100 or 250 bp spans along each transcript. Expression levels for most datasets were based on two models: 1) 20x average coverage with 100% of the transcripts in the reference expressed, or 2) 0, 10, 100, or 1000x average coverage per transcript with 50% of the transcripts in the reference randomly selected for uniformly chosen nonzero expression.
Mapping of the reads to the reference transcriptome was performed using Bowtie except where specified [41]. The effects of an incomplete reference transcriptome were explored by incrementally removing 10% of the transcripts from the reference transcriptome (randomly selected).
Errors from isoforms in a small random vs real transcriptome test set
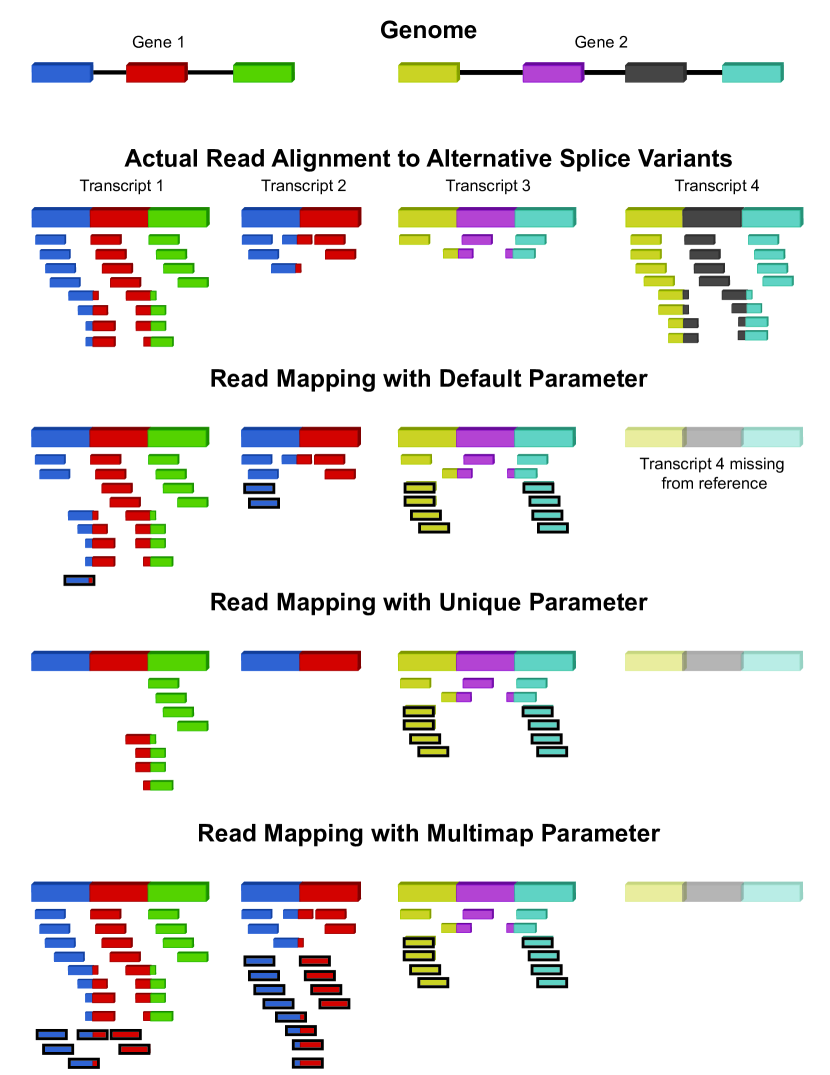
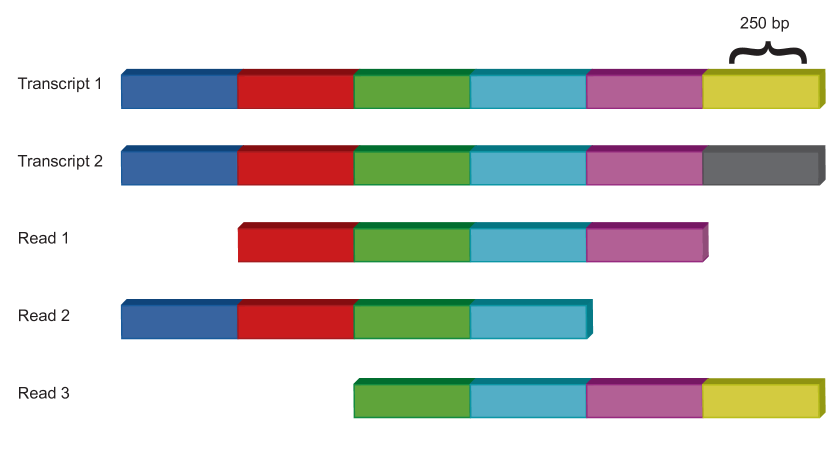
To characterize mapping errors and mapping parameters effects, we first generated small read sets from 5000 transcripts with 20x average coverage, and mapped them to a complete reference transcriptome (in triplicate with results averaged; variance not shown). As shown in Table 1, mapping reads to a randomly generated transcriptome is 92% (single end or SE) or 85% (paired end or PE) correct regardless of multimap parameters, with 8% (SE) or 15% (PE) of reads lost due to reads having two or more sequencing errors. The lack of false positives is expected because random transcriptomes are unlikely to contain transcripts that share reads. When mapping reads to a randomly selected subset of the mouse transcriptome containing alternative splice variants, multimap reads are mismapped using either default or multimap parameters; false positives are prevented by using the unique parameter to eliminate these reads from the data set (see Figure 1). Simulations of the random transcriptome with increasing numbers of alternative splice variants confirm that more multimap reads lead to higher false positive rates (see Table 2). Mapping specificity is higher for paired ends, as seen with the lower false positive rate for the mouse transcriptome using both the default and multimap parameters. The 8% or 15% unmappable reads due to substitution error is expected to remain constant for read sets of all sizes (due to sequencing platform used); but for larger reference transcriptomes containing more alternative splice variants, the false positive rate due to multimap reads is expected to be compounded.
Comparison of incomplete reference mapping results between model and nonmodel organisms
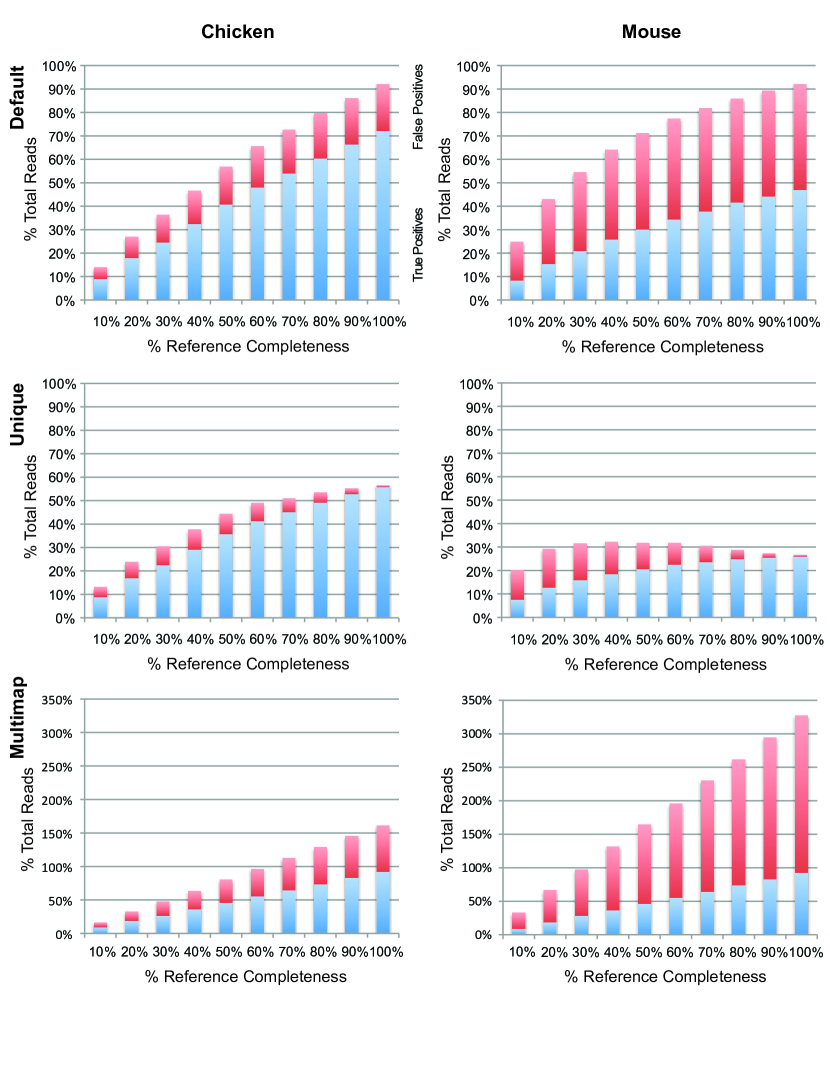
To characterize the effects of an incomplete reference transcriptome on mapping accuracy, we next generated simulated read sets for Mus musculus, which has a well-studied transcriptome (23,153 genes and 90,956 transcripts in release 68 as of November 2012[42]), and Gallus gallus, for which the reference genome is predicted to be 95% complete and transcriptome is incomplete (16,736 genes and 23.392 transcripts in 2.1 release as of November 2012) with sequence missing for several microchromosomes[4]. 50% of the transcripts were randomly selected for expression across several orders of magnitude (10, 100, 1000) to model real RNA-Seq expression levels (triplicate runs with results averaged). As seen in Figure 2 (top left), when 10% increments of the chicken reference transcriptome are missing, the true positive rate decreases by approximately 6-8%, while the false positive rate remains relatively constant until the reference is more than 50% incomplete. This is due to reads being mismapped to alternative splice variants (as demonstrated by Transcripts 3 and 4 in Figure 1) when the reference is mostly complete and due to reads being unmappable when the reference is mostly incomplete. This is confirmed when only unique reads are mapped (Figure 2, middle left); the number of false positives grows as the reference becomes increasingly incomplete and decreases when the reference is less than 30% complete (few splice variants left in the reference). This trend is amplified in the mouse data set (Figure 2, right column) by the significantly larger number of known alternative splice variants, leading to less than 50% of the reads being accurately mapped with default parameters and less than 25% of the data being mappable using unique parameters. Because the chicken transcriptome is less complete than mouse, it is probable that real chicken RNA-Seq data would more closely resemble the high false positive rates of the mouse data. Paired read data sets generated similarly to the single end sets discussed above have similar mapping trends and accuracy as shown in Figure 2 (not shown).
These errors are intrinsic to the data and current mapping algorithms. As seen in Table 3 when using three different popular Burrows-Wheeler mapping programs for Illumina data on sets of simulated chicken read data[41, 43, 44], the results are nearly identical. These results confirm that alternative splice variants cause high/nearly constant false positive rates while incomplete reference transcriptomes decrease the true positive rate.
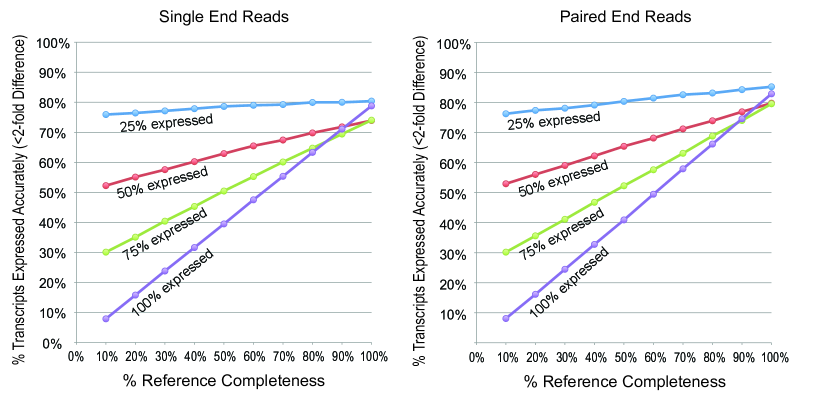
Errors in transcript expression levels
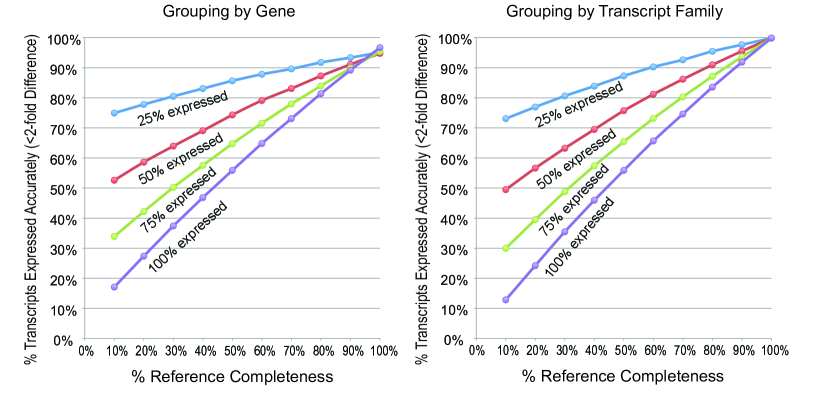
To determine the effect of alternative splice variants and incomplete reference transcriptomes on transcript expression levels, we compared the number of reads mapped to each transcript to the number of reads generated from each transcript in the chicken transcriptome. As seen in Figure 3, regardless of the percent of the transcripts in the reference expressed, between 15 and 27% of the transcripts have an inaccurate expression level when mapping with a complete reference transcriptome. Paired ends yield slightly greater mapping specificity and therefore slightly more accurate transcript expression levels. As the reference transcriptome completeness decreases, the read mapping errors lead to more transcripts with inaccurate expression levels reported, with higher percentages of transcriptome expression leading to greater numbers of errors. Errors from alternative splice variants can be eliminated by grouping transcripts either by gene (similar to genome mapping) if gene to transcript information is available, or grouping based on transcripts sharing multimap reads (see Figure 4). Errors from incomplete reference transcriptomes can only be eliminated by improving reference transcriptomes.
Longer read lengths increase read uniqueness and decrease error
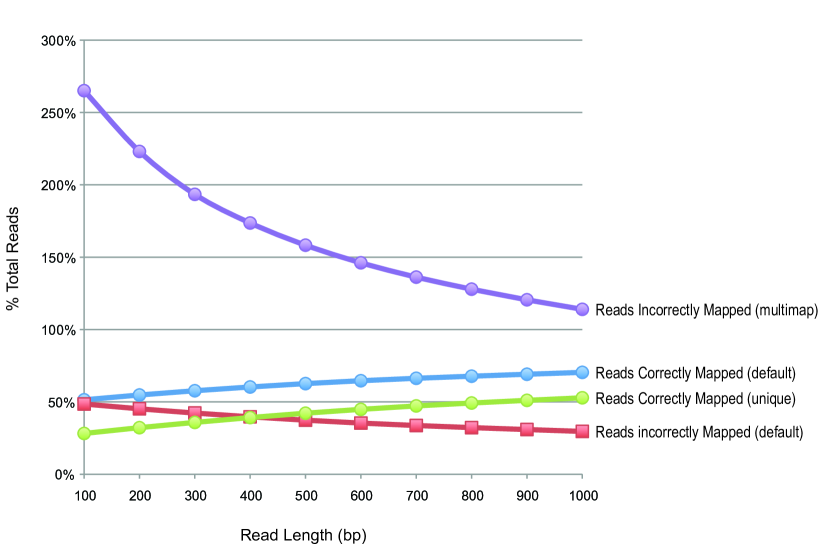
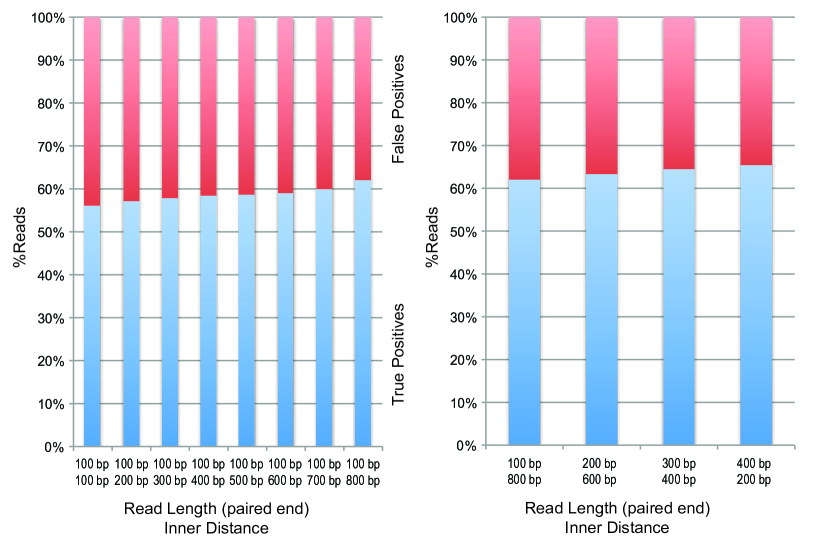
The most commonly cited solution to the current high mapping error problem (and incomplete assembly problem) is to develop new sequencing technologies that generate longer reads. Illumina currently has single-end read lengths between 100 and 250 bp in length, Roche 454 can achieve 400-800 bp, and Pacific Biosciences is developing a method that will yield 10000 bp, albeit with lower numbers of reads. To determine if these lengths are sufficient to increase the uniqueness of reads, we simulated single and paired ends reads at various lengths and determined the read mapping errors. As seen in Figure 5, 20% more reads are unique when read size is increased from 100 bp to 1 kb. However, even at 1 kb, the longest read that Bowtie can currently handle, reads map with only 70% accuracy, indicating that single end reads will need to lengthen more than 10-fold to solve the mapping inaccuracy problem (see Figure 6). The mean length of transcripts in both the mouse and chicken transcriptomes is roughly 2 kb with a sizeable standard deviation; 1 kb reads are insufficient to sequence most whole transcripts and therefore will not necessarily be unique to long alternative splice variants. While paired ends from fragments greater than 1 kb in length could achieve read uniqueness by spanning longer stretches of sequence, Figure 7 (left) shows that in comparison to single end reads of length 1 kb, paired end reads of 100 bp have significantly lower uniqueness, gaining only about 1% accuracy for every 100 bp added to the inner distance. As seen in Figure 7 (right), a combination of increasing fragment length and increasing read length can achieve accuracy rates only slightly lower than those of long single end reads; 400 bp paired end reads with a 200 bp inner distance are only 5% less accurate than 1 kb single end reads.
Discussion
As RNA-Seq becomes less expensive and more computational tools are developed, the focus on analysis should shift to which questions can be addressed with reasonable accuracy. RNA-Seq reads mapped to a complete reference transcriptome can be used to gather gene expression data, but transcript expression analyses will be skewed by erroneous mapping from alternative splice variants. For eukaryotes whose transcriptomes contain many splice variants, incomplete or erroneous transcriptomes can cause significant mismapping of reads and resulting misestimation of expression levels.
Read mapping accuracy is mode dependent and dependent on transcriptome completeness
The dominant effect on true and false positive rates in mapping is from the mapping parameter used: multimap read mapping, in which all possible mappings are reported, has the highest true positive rate, but also comes with substantial false positive matches. The true positive rates of both unique-only and default/random-assignment mapping modes are considerably lower than for multimap modes, although the false positive rates are also significantly lower. Thus the choice of mode represents a tradeoff between sensitivity and specificity in read mapping.
The completeness of the reference transcriptome interacts significantly with the mapping mode. The true positive rate for multimap mode is dependent solely on the correct transcript being in the reference, while the default and unique modes have substantially lower true positive rates for incomplete transcriptomes, because both modes depend on choosing or rejecting mappings from among the available transcripts. In contrast, the false positive rate for multimap and default modes is high for transcriptomes with many splice variants, while the unique mapping mode false positive rate decreases substantially as more of the transcriptome is available.
Calculating transcript-specific expression levels directly from RNA-Seq is challenging
Under a simple model of transcript expression in which expression levels are chosen randomly and uniformly from four expression levels, gene- or transcript-family-level expression calculations approach 100% accuracy when a nearly complete transcriptome is used (Figure 4). However, even with a nearly complete chicken reference transcriptome, only about 80% accuracy can be achieved for single transcript measurements. Moreover, the more transcripts that are expressed, the less accurate the expression calculations are, especially in tandem with a less-than complete chicken transcriptome (Figure 3). It is important to note that the chicken transcriptome being used here is likely lacking many real splice variants compared to mouse or human, which are comparatively better studied; the expression accuracy for single transcripts will inevitably decrease with more splice variants to confuse read mapping.
Longer reads and fragment lengths do not result in perfect mapping
Somewhat to our surprise, neither 1 kb reads nor paired end reads from 1 kb fragments resolve the mapping problem. Even with 1 kb reads and a complete transcriptome, multimap mapping has about a 20% false positive rate for mouse (Figure 5), while neither default nor unique mapping mode can achieve better than 70% true positives. This problem emerges directly from the length of many transcripts and the distance between exons; e.g. see Figure 6.
Even when longer reads are available (as from the Pacific Biosciences SMRT technology), sampling depth is also critically important rare transcripts cannot be observed systematically with low coverage. One study on B-cells suggests that between 100 and 500 million observations are necessary for accurate transcript quantification [45]. Current sequencing technology is not yet close to providing both long reads and high sampling.
Limits to mapping accuracy also imply limits to RNA-Seq assembly accuracy
In the absence of deep sampling with long reads, most transcriptomes are inferred from RNA-Seq using de novo or reference-based assembly methods. Our read mapping simulations suggest that there are fundamental limits to the ability of assembly methods to determine complete transcripts from RNA-Seq, and indeed all assembly methods use more or less explicit models to deconvolve reads and read counts into distinct isoforms [15, 16, 17]. Absent direct observations, these inferences are necessarily of unknown quality; cross validation would require the direct observation of long-range exon-exon correlations in single molecules, and none of RNA-Seq, microarrays, or qPCR can provide such observations. In practice, most methods simply seek to maximize the concordance between the observed information and the assembled transcripts, which is almost certainly sufficient to reconstruct the majority of exons and exon-exon junctions correctly. This is confirmed by the strong correlation between results from RNA-Seq, ESTs, and full-length cDNA sequencing in many model organisms, as well as bioinformatic validation of protein-coding sequences. Thus we believe that it is unlikely that many transcriptomes are systematically inaccurate on a large scale.
The biggest uncertainty in reference transcriptomes is likely to be due to the presence of low-expressed isoforms, many of which may come from noisy splicing and are biologically irrelevant [46]. Unfortunately accurate measurement of the expression levels of rare transcripts across conditions is dependent on accurate reference transcriptomes, leading to a chicken-and-egg problem in our ability to evaluate biological relevance. We know of no quantification methods that report measurement uncertainty without relying on a preexisting reference.
Separately, the confounding effect of too complete a reference on correct mapping and expression inference may be significant. If many unexpressed splice variants are present in the reference transcriptome used for quantification, they may result in inaccurate expression calculations. A variety of adaptive shrinkage approaches have been applied to this problem [35, 47, 48] but they are again reference dependent.
Conclusion
Our basic conclusion is that RNA-Seq-based expression analysis is strongly dependent on the quality and completeness of the reference transcriptome, suggesting that new RNA-Seq data sets be integrated into existing references prior to expression analysis. While many tools exist for this purpose, it is difficult to evaluate their performance in light of the limits we observed for correct transcript mapping and their implications for correct transcript reconstruction.
Another important observation, already made by several others, is that differential expression can be most accurately calculated at a gene- or transcript-family-level, while isoform-level expression is subject to significant uncertainty [15, 36]. Moreover, this is unlikely to change until technologies that permit deep sampling with 2 kb reads are readily available.
Materials and Methods
Random transcriptome and alternative splice variant simulations
Python scripts were used to generate transcripts with randomly selected A, C, G, and T characters with a minimum length of 100 and maximum of 5000 bp. Alternative splice variants were simulated by randomly selecting existing transcripts from a transcriptome and performing one of five operations: truncation (removal of a random length of characters from the end) or skipping an exon at the 3’ end, extension (addition of a random length of characters to the end) or adding an exon at the 3’ end, insertion (addition of a random length of characters at a randomly selected position in the middle) or splicing in a new exon or failure to remove an intron, deletion (removal of a random length of characters at a randomly selected in the middle) or exon skipping, or substitution (replacement of a random length of characters at a randomly selected position with a randomly generated length of characters) or swapping exons. No limit was placed on the number of times a transcript could be used to form a variant. Variants generated early in the process could be used to form further variants later.
Read generation
Python scripts were used to generate single and paired end reads from reference transcriptomes, either random transcriptomes generated as above or those downloaded from Ensembl in March 2012 [42]. Reads were generated by randomly selecting start positions in a given transcript that were at least one read length from the end of the transcript (or two read lengths + inner distance) and copying the sequence up to given read length. Read lengths were 100 bp both for single and paired end reads except where mentioned (see Results). A 1% random substitution error was added by randomly selecting 1% of the positions in the read and substituting the correct nucleotide with one of the other three nucleotides. The number of reads generated per transcript to achieve the given average coverage was determined by the equation: number of reads = (transcript length) / (read length) * (coverage). Average coverage was either 20x for all transcripts in the transcriptome or were randomly selected from the set 0, 10, 100, 1000 according to the percentage of the reference expressed (the probabilities associated with the nonzero elements were equal). Scripts for read generation and random transcriptome generation with splice variants are available at github (https://github.com/ablackpz/Simulate-mRNASeq-Reads).
Mapping and accuracy
Mapping was performed using Bowtie except where specified. The default parameters were selected according to the bowtie tutorial, the unique parameter was invoked as “-m 1”, and the multimap parameter was “-a”. Paired ends were mapped with insert size between 0 and 1000. Mapping accuracy was assessed for each read by comparing the transcript identifier from which each read originated with the transcript identifier reported for that read by the mapping program. A match was classified as a true positive and mismatch as a false positive. True/false negatives were not addressed in this study. Transcript expression accuracy was assessed by counting the number of reads generated from a given transcript (actual) and the number of reads reported for that transcript from the mapping program (experimental). Values where actual and experimental values differed more than 2-fold were considered to be erroneous. Gene expression accuracy was determined by using transcript/gene relationships as reported by Ensembl to group transcripts by gene.
Similar to the exon union method [30], the number of reads generated for transcripts within a given transcript group by gene and number of reads mapped transcripts within that group were counted and erroneous expression assessed similarly to above. Transcript family expression accuracy was determined by first determining the transcript grouping by multimapping reads relationships. Overlapping reads were systematically generated for each transcript with the resulting read set containing all possible reads for the reference (exact match). This large read set was then multimapped to the reference transcriptome to determine which reads could map to multiple transcripts. Transcripts sharing reads were grouped together. Reads per transcript group were counted for both initial read generation and mapping and erroneous expression was determined as above.
Acknowledgments
References
- 1. Martin JA, Wang Z (2011) Next-generation transcriptome assembly. Nat Rev Genet 12: 671–682.
- 2. Twine NA, Janitz K, Wilkins MR, Janitz M (2011) Whole transcriptome sequencing reveals gene expression and splicing differences in brain regions affected by Alzheimer’s disease. PLoS ONE 6: e16266.
- 3. Kai W, Kikuchi K, Tohari S, Chew AK, Tay A, et al. (2011) Integration of the genetic map and genome assembly of fugu facilitates insights into distinct features of genome evolution in teleosts and mammals. Genome Biol Evol 3: 424–442.
- 4. Ye L, Hillier LW, Minx P, Thane N, Locke DP, et al. (2011) A vertebrate case study of the quality of assemblies derived from next-generation sequences. Genome Biol 12: R31.
- 5. Wang ET, Sandberg R, Luo S, Khrebtukova I, Zhang L, et al. (2008) Alternative isoform regulation in human tissue transcriptomes. Nature 456: 470–476.
- 6. Cloonan N, Forrest AR, Kolle G, Gardiner BB, Faulkner GJ, et al. (2008) Stem cell transcriptome profiling via massive-scale mRNA sequencing. Nat Methods 5: 613–619.
- 7. Denoeud F, Aury JM, Da Silva C, Noel B, Rogier O, et al. (2008) Annotating genomes with massive-scale RNA sequencing. Genome Biol 9: R175.
- 8. Lister R, O’Malley RC, Tonti-Filippini J, Gregory BD, Berry CC, et al. (2008) Highly integrated single-base resolution maps of the epigenome in Arabidopsis. Cell 133: 523–536.
- 9. Maher CA, Kumar-Sinha C, Cao X, Kalyana-Sundaram S, Han B, et al. (2009) Transcriptome sequencing to detect gene fusions in cancer. Nature 458: 97–101.
- 10. Marioni JC, Mason CE, Mane SM, Stephens M, Gilad Y (2008) RNA-seq: an assessment of technical reproducibility and comparison with gene expression arrays. Genome Res 18: 1509–1517.
- 11. Mortazavi A, Williams BA, McCue K, Schaeffer L, Wold B (2008) Mapping and quantifying mammalian transcriptomes by RNA-Seq. Nat Methods 5: 621–628.
- 12. Nagalakshmi U, Wang Z, Waern K, Shou C, Raha D, et al. (2008) The transcriptional landscape of the yeast genome defined by RNA sequencing. Science 320: 1344–1349.
- 13. Sultan M, Schulz MH, Richard H, Magen A, Klingenhoff A, et al. (2008) A global view of gene activity and alternative splicing by deep sequencing of the human transcriptome. Science 321: 956–960.
- 14. Yassour M, Kaplan T, Fraser HB, Levin JZ, Pfiffner J, et al. (2009) Ab initio construction of a eukaryotic transcriptome by massively parallel mRNA sequencing. Proc Natl Acad Sci USA 106: 3264–3269.
- 15. Trapnell C, Williams BA, Pertea G, Mortazavi A, Kwan G, et al. (2010) Transcript assembly and quantification by RNA-Seq reveals unannotated transcripts and isoform switching during cell differentiation. Nat Biotechnol 28: 511–515.
- 16. Schulz MH, Zerbino DR, Vingron M, Birney E (2012) Oases: robust de novo RNA-seq assembly across the dynamic range of expression levels. Bioinformatics 28: 1086–1092.
- 17. Grabherr MG, Haas BJ, Yassour M, Levin JZ, Thompson DA, et al. (2011) Full-length transcriptome assembly from RNA-Seq data without a reference genome. Nat Biotechnol 29: 644–652.
- 18. Oshlack A, Robinson MD, Young MD (2010) From RNA-seq reads to differential expression results. Genome Biol 11: 220.
- 19. Surget-Groba Y, Montoya-Burgos JI (2010) Optimization of de novo transcriptome assembly from next-generation sequencing data. Genome Res 20: 1432–1440.
- 20. De Bruijn N (1946) A combinatorial problem. Koninklijke Nederlandse Akademie v Wetenschappen 46: 6.
- 21. Pevzner PA (1989) 1-Tuple DNA sequencing: computer analysis. J Biomol Struct Dyn 7: 63–73.
- 22. Zerbino DR, Birney E (2008) Velvet: algorithms for de novo short read assembly using de Bruijn graphs. Genome Res 18: 821–829.
- 23. Robertson G, Schein J, Chiu R, Corbett R, Field M, et al. (2010) De novo assembly and analysis of RNA-seq data. Nat Methods 7: 909–912.
- 24. Zerbino DR (2010) Using the Velvet de novo assembler for short-read sequencing technologies. Curr Protoc Bioinformatics Chapter 11: Unit 11.5.
- 25. Lander ES (2011) Initial impact of the sequencing of the human genome. Nature 470: 187–197.
- 26. Modrek B, Resch A, Grasso C, Lee C (2001) Genome-wide detection of alternative splicing in expressed sequences of human genes. Nucleic Acids Res 29: 2850–2859.
- 27. Johnson JM, Castle J, Garrett-Engele P, Kan Z, Loerch PM, et al. (2003) Genome-wide survey of human alternative pre-mRNA splicing with exon junction microarrays. Science 302: 2141–2144.
- 28. Costa V, Angelini C, De Feis I, Ciccodicola A (2010) Uncovering the complexity of transcriptomes with RNA-Seq. J Biomed Biotechnol 2010: 853916.
- 29. Stein LD (2011) An introduction to the informatics of ”next-generation” sequencing. Curr Protoc Bioinformatics Chapter 11: Unit 11.1.
- 30. Garber M, Grabherr MG, Guttman M, Trapnell C (2011) Computational methods for transcriptome annotation and quantification using RNA-seq. Nat Methods 8: 469–477.
- 31. Cloonan N, Xu Q, Faulkner GJ, Taylor DF, Tang DT, et al. (2009) RNA-MATE: a recursive mapping strategy for high-throughput RNA-sequencing data. Bioinformatics 25: 2615–2616.
- 32. Hashimoto T, de Hoon MJ, Grimmond SM, Daub CO, Hayashizaki Y, et al. (2009) Probabilistic resolution of multi-mapping reads in massively parallel sequencing data using MuMRescueLite. Bioinformatics 25: 2613–2614.
- 33. Jiang H, Wong WH (2009) Statistical inferences for isoform expression in RNA-Seq. Bioinformatics 25: 1026–1032.
- 34. Li B, Ruotti V, Stewart RM, Thomson JA, Dewey CN (2010) RNA-Seq gene expression estimation with read mapping uncertainty. Bioinformatics 26: 493–500.
- 35. Li B, Dewey CN (2011) RSEM: accurate transcript quantification from RNA-Seq data with or without a reference genome. BMC Bioinformatics 12: 323.
- 36. Trapnell C, Hendrickson DG, Sauvageau M, Goff L, Rinn JL, et al. (2012) Differential analysis of gene regulation at transcript resolution with RNA-seq. Nat Biotechnol .
- 37. Kim H, Bi Y, Pal S, Gupta R, Davuluri RV (2011) IsoformEx: isoform level gene expression estimation using weighted non-negative least squares from mRNA-Seq data. BMC Bioinformatics 12: 305.
- 38. Richard H, Schulz MH, Sultan M, Nurnberger A, Schrinner S, et al. (2010) Prediction of alternative isoforms from exon expression levels in RNA-Seq experiments. Nucleic Acids Res 38: e112.
- 39. Lacroix V (2008) Esact transcriptome reconstruction from short sequence reads, Springer. WAB08: Proceedings of the 8th international workshop on Algorithms in Binformatics edition, pp. 500–563.
- 40. Xia Z, Wen J, Chang CC, Zhou X (2011) NSMAP: a method for spliced isoforms identification and quantification from RNA-Seq. BMC Bioinformatics 12: 162.
- 41. Langmead B, Trapnell C, Pop M, Salzberg SL (2009) Ultrafast and memory-efficient alignment of short DNA sequences to the human genome. Genome Biol 10: R25.
- 42. Flicek P, Amode MR, Barrell D, Beal K, Brent S, et al. (2012) Ensembl 2012. Nucleic Acids Res 40: 84–90.
- 43. Li H, Durbin R (2009) Fast and accurate short read alignment with Burrows-Wheeler transform. Bioinformatics 25: 1754–1760.
- 44. Li R, Yu C, Li Y, Lam TW, Yiu SM, et al. (2009) SOAP2: an improved ultrafast tool for short read alignment. Bioinformatics 25: 1966–1967.
- 45. Toung JM, Morley M, Li M, Cheung VG (2011) RNA-sequence analysis of human B-cells. Genome Res 21: 991–998.
- 46. Pickrell JK, Pai AA, Gilad Y, Pritchard JK (2010) Noisy splicing drives mRNA isoform diversity in human cells. PLoS Genet 6: e1001236.
- 47. Li W, Feng J, Jiang T (2011) IsoLasso: a LASSO regression approach to RNA-Seq based transcriptome assembly. J Comput Biol 18: 1693–1707.
- 48. Nguyen T, Deng N, Zhu D SASeq: A selective and adaptive shrinkage approach to detect and quantify active transcripts using RNA-Seq. Submitted.
Figure Legends
Tables
| Organism | Num Trans | Error | TP (d) | FP (d) | TP (u) | FP (u) | TP (m) | FP (m) |
| Random (SE) | 5000 | 1% | 92% | 0% | 92% | 0% | 92% | 0% |
| Mouse (SE) | 5000 | 1% | 87% | 5% | 81% | 0% | 92% | 12% |
| Random (PE) | 5000 | 1% | 92% | 0% | 92% | 0% | 92% | 0% |
| Mouse (PE) | 5000 | 1% | 87% | 5% | 81% | 0% | 92% | 12% |
Mapping parameters are default (d), unique (u), and multimap (m). True positives are reads that were successfully mapped to their originating transcript. False positives are reads that were mapped to other transcripts (even if the read was an exact match to the alternate transcript).
| Organism | Num Trans | Error | TP (d) | FP (d) | TP (u) | FP (u) | TP (m) | FP (m) |
| 0% Isoforms | 5000 | 1% | 92% | 0% | 92% | 0% | 92% | 0% |
| 10% Isoforms | 5000 | 1% | 86% | 6% | 81% | 0% | 92% | 14% |
| 20% Isoforms | 5000 | 1% | 80% | 12% | 70% | 0% | 92% | 33% |
| 30% Isoforms | 5000 | 1% | 74% | 18% | 62% | 0% | 92% | 60% |
| 40% Isoforms | 5000 | 1% | 67% | 25% | 53% | 0% | 92% | 105% |
| 50% Isoforms | 5000 | 1% | 60% | 32% | 45% | 0% | 92% | 217% |
| 60% Isoforms | 5000 | 1% | 55% | 37% | 39% | 0% | 92% | 303% |
| 70% Isoforms | 5000 | 1% | 48% | 45% | 33% | 0% | 92% | 732% |
| 80% Isoforms | 5000 | 1% | 42% | 50% | 27% | 0% | 92% | 970% |
| 90% Isoforms | 5000 | 1% | 37% | 56% | 23% | 0% | 92% | 4722% |
Mapping parameters are default (d), unique (u), and multimap (m). Percentages indicate the amount of the simulated transcripts that were generated from other, randomly generated transcripts.
| Organism | Num Trans | Bowtie TP (d) | FP (d) | BWA TP (d) | FP (d) | SOAP2 TP (d) | FP (d) |
|---|---|---|---|---|---|---|---|
| Chicken | 100% | 78% | 22% | 78% | 20% | 78% | 22% |
| Chicken | 90% | 72% | 21% | 72% | 20% | 72% | 21% |
| Chicken | 80% | 65% | 22% | 65% | 21% | 65% | 22% |
| Chicken | 70% | 58% | 22% | 58% | 21% | 58% | 22% |
| Chicken | 60% | 51% | 20% | 50% | 19% | 51% | 20% |
| Chicken | 50% | 44% | 19% | 44% | 18% | 44% | 19% |
| Chicken | 40% | 36% | 16% | 37% | 16% | 36% | 17% |
| Chicken | 30% | 27% | 13% | 27% | 13% | 27% | 12% |
| Chicken | 20% | 19% | 11% | 19% | 11% | 19% | 11% |
| Chicken | 10% | 9% | 5% | 9% | 6% | 9% | 5% |
Comparison of Bowtie, BWA, and SOAP2 mapping programs on the same simulated reads for error-free chicken read sets (triplicate and averaged) with decreasing completeness of the reference transcriptome, showing equivalent results.