11email: giuseppe.gavazzi@mib.infn.it 22institutetext: Centre for Astrophysics and Supercomputing, Swinburne University of Technology, Hawthorn, Victoria 3122, Australia
22email: gsavorgn@astro.swin.edu.au 33institutetext: Max-Planck-Institut für Extraterrestrische Physik, Giessenbachstrasse, D-85748 Garching, Germany
33email: mfossati@mpe.mpg.de 44institutetext: Carnegie Observatories, 813 Santa Barbara Street, Pasadena, CA 91101, USA
44email: mfumagalli@obs.carnegiescience.edu 55institutetext: Department of Astrophysics, Princeton University, Princeton, NJ 08544-1001, USA 66institutetext: Aix Marseille Université, CNRS, LAM (Laboratoire d’Astrophysique de Marseille) UMR 7326, 13388, Marseille, France
66email: alessandro.boselli@oamp.fr 77institutetext: Instituto de Astronomía, Universidad Nacional Autónoma de México, Carretera Tijuana-Ensenada, km 103, 22860 Ensenada, B.C., México.
77email: leonel@astro.unam.mx 88institutetext: Instituto de Astronomía, Universidad Nacional Autónoma de México, Apartado Postal 70-264, 04510 México D.F., México.
88email: hector@astroscu.unam.mx 99institutetext: Center for Radiophysics and Space Research, Space Science Building, Ithaca, NY, 14853
99email: haynes@astro.cornell.edu, riccardo@astro.cornell.edu
H: an H imaging survey of HI selected galaxies from ALFALFA††thanks: Based on observations taken at the observatory of San Pedro Martir (Baja California, Mexico), belonging to the Mexican Observatorio Astronómico Nacional.
Abstract
Context. We present the analysis of H, an H narrow-band imaging follow-up survey of galaxies selected from the HI Arecibo Legacy Fast ALFA Survey (ALFALFA) in the Coma supercluster.
Aims. Taking advantage of H, which provides the complete census of the recent star formation in HI-rich galaxies in the local universe, we explored the hypothesis that a morphological sequence of galaxies of progressively earlier type and lower gas-content exists in the neighborhood of a rich cluster of galaxies such as Coma, with a specific star formation activity that decreases with increasing local galaxy density and velocity dispersion.
Methods. By using the H hydrogen recombination line as a tracer of the ”instantaneous” star formation, complemented with optical colors from SDSS, we investigated the relationships between atomic neutral gas and newly formed stars in different local galaxy density intervals, for many morphological types, and over a wide range of stellar masses ( to M⊙).
Results. In the dwarf regime (M) we identify a four-step sequence of galaxies with progressively redder colors (corrected for dust extinction), i.e., of decreasing specific star formation, from (1) HI-rich late-type galaxies (LTGs) belonging to the blue cloud that exhibit extended plus nuclear star formation, (2) mag redder, HI-poor LTGs with nuclear star formation only, (3) mag redder, HI-poor galaxies without either extended or nuclear star formation, but with nuclear post-star-burst (PSB) signature, (4) mag redder early-type galaxies (ETGs) that belong to the red sequence, and show no gas or star formation on all scales. Along this sequence the quenching of the star formation proceeds radially outside-in. The progression toward redder colors found along this ”morphological” (gas content) sequence is comparable to the one obtained from increasing the local galaxy density, from cosmic filaments (1 2), to the rich clusters (2 3 4).
Conclusions. In the dwarf regime we find evidence for an evolution of HI-rich LTGs into ETGs through
HI-poor LTGs and PSB galaxies driven by the environment. We identify ram-pressure as the
mechanism most likely responsible for this transformation.
We conclude that infall of galaxies has proceeded for the last 7.5 Gyr,
building up the Coma cluster at a rate of approximately 100 galaxies with
M per Gyr.
Key Words.:
Galaxies: clusters: individual: Coma – Galaxies: fundamental parameters luminosities, masses – Galaxies: ISM1 Introduction
Since the advent of the Sloan Digital Sky Survey (SDSS, York et al. 2000), which revolutionized research in astronomy
at the turn of the millennium, surveys carried out at frequencies other than optical were designed
with an extent, depth, and photometric and astrometric qualities comparable with SDSS.
One such ambitious survey is ALFALFA (Giovanelli et al. 2005), a blind HI sky survey that just ended at Arecibo (October 2012),
aimed at obtaining the census of HI sources within 7000 sq degrees of the sky accessible from Arecibo, with
an rms noise near 2 mJy after Hanning smoothing to 10
(see Haynes et al. 2011), corresponding to of HI at the distance of Virgo and at the distance of Coma.
A catalog listing 40% of the whole ALFALFA sources available so far ( catalog) has been published by Haynes et al. (2011).
The less extensive H is an H narrow-band imaging survey, ongoing at the 2.1m telescope of the San Pedro Martir (SPM) Observatory, aimed at following-up all nearby galaxies that are selected from ALFALFA in the redshift range () of the Local (Gavazzi et al. 2012) and Coma superclusters (). The sensitivity of H is such that galaxies with star formation rate (SFR) in excess of are sampled up to the distance of Coma (100 Mpc). The three mentioned surveys provide us with the necessary ingredients for studying one of the most obvious, yet still unsettled questions of galaxy evolution: the transformation of primeval atomic gas (HI) into , its fragmentation in molecular clouds, and the birth of new stars that contribute to the formation and evolution of galaxies. So far, the census of the SFR in the local Universe traced by hydrogen recombination lines has been determined on HI selected surveys, such as SINGG selected from HIPASS (Meurer et al. 2006), or optically selected ones (Boselli et al. 2001, Gavazzi et al. 2002b, 2006, James et al. 2004, Kennicutt et al. 2008, Lee et al. 2007, 2009, Bothwell et al. 2009), or in optically selected galaxies with stellar mass larger than (e.g. GASS, the GALEX Arecibo SDSS Survey, Catinella et al. 2010, Schiminovich et al. 2010, Fabello et al. 2012). The combined sensitivities of SDSS, ALFALFA, and H are such that the present analysis can be extended to dwarf galaxies with stellar masses as small as . Combining the .40 catalog (Haynes et al. 2011) with the catalog provided by the legacy program carried out with the Galaxy Evolution Explorer (GALEX), Huang et al. (2012) carried out the most recent investigation of the scaling relations between HI gas, star formation111We emphasize that the SFR in normal galaxies can be estimated from the UV provided that this remained constant over a time scale yr. In contrast if the SFR changed during a time scale yr, which is most likely the case of cluster and dwarf galaxies, the most appropriate SFR indicator is H (Boselli et al. 2009)., and stellar mass. They did not touch on the debated question whether the transformation of gas into stars which has provided the build-up of the Hubble sequence over the cosmic time, depends on the environment (nurture) or is a purely “genetic” process (nature), which is the focus of the present work. We follow the line traced by Boselli et al. (2008) and by Paper II (Gavazzi et al. 2013a), who found evidence that a strong role is played by the environment in the Virgo cluster for the transformation of star-forming dwarf galaxies of late type into quiescent dwarf elliptical galaxies due to the fast ablation of the interstellar gas caused by the ram-pressure mechanism (Gunn & Gott 1972), with consequent suppression of the star formation. Moreover, we continue on this line, following Gavazzi et al. (2010), who found support for these ideas by studying the population of late-type galaxies surrounding the Coma cluster using photometry and spectroscopy from the SDSS to separate the stellar populations in galaxies as faint as =-17.5 mag. The Coma supercluster consists of a main filament of galaxies running perpendicularly to the line of sight across several hundreds of Mpc, with a distribution of galaxies spanning a significant density contrast. Its very shape, along with the new available data on the HI gas content from ALFALFA and the measurements of the star formation provided by H, offer a unique opportunity of pursuing this question in the present Paper III of the H series.
Paper III is structured as follows. The optical- and radio-selected samples used in the analysis are defined and discussed in Section 2. Section 3 contains the evidence of the environmental dependency of the gas content and of the star formation activity (both in the disk and circumnuclear). Discussion and summary are given in Section 4. A method for correcting the optical colors for internal extinction is obtained in Appendix A. The scaling relations between HI mass, stellar mass and the star formation in Coma compared to the Local Supercluster are discussed in Appendix B.
The H observations of the Local Supercluster have been the subject of Paper I of this series (Gavazzi et al. 2012). Paper II (Gavazzi et al. 2013a) outlined the analysis, including the study of the scaling relations between HI mass, stellar mass, star formation, and the environmental conditions. Paper IV (Fossati et al. 2013) will analyze the structural properties of galaxies in the Local and Coma superclusters, and Paper V (Gavazzi et al. 2013b) will contain the H data (fluxes and images) in the Coma supercluster.
2 The Sample
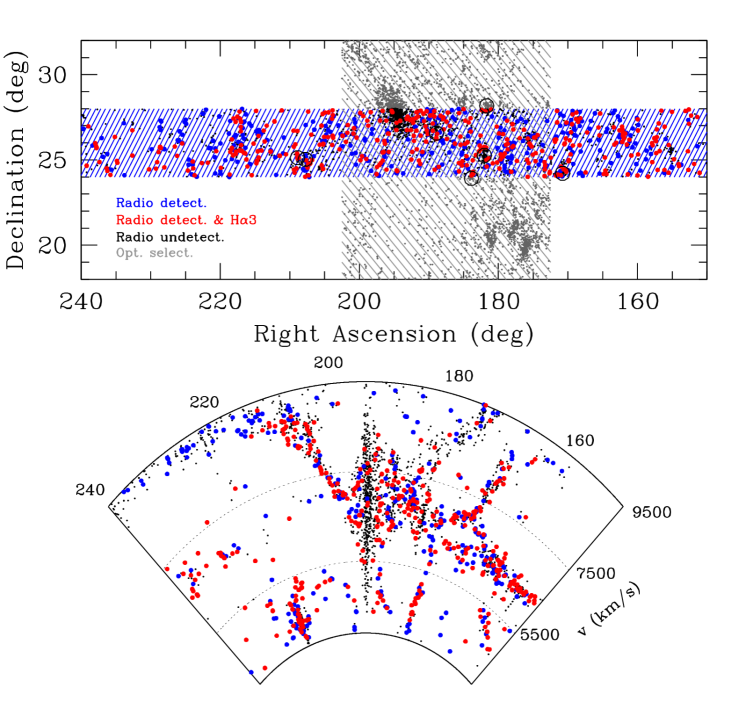
The present analysis is focused on galaxies members of the Coma supercluster, which belongs to three subsamples: sample 1 is composed of 5026 optically selected galaxies brighter than 17.77 (and is complete to this limit), sample 2 consists of 683 HI-selected galaxies (from ALFALFA), sample 3 (a subset of sample 2) consists of 383 galaxies that were followed-up with H observations as part of H.
The sky distribution of the Great Wall is displayed in the top panel of Figure 1, while a wedge diagram of the HI-selected sample is shown in the bottom panel. The optically selected sample was built from the union of two regions: region 1 with (, gray shaded in Figure 1), which traditionally describes the Coma supercluster, and region 2 with (, blue-shaded in Figure 1) covered by ALFALFA. In both regions we limit our analysis to the redshift interval , chosen to comprise the “finger of God” of the Coma cluster.
2.1 Optically selected sample
Galaxies belonging to the Coma supercluster, which lies at a mean distance of 100 Mpc, have apparent radii small enough that their SDSS images are only little affected by the “shredding” of large galaxies into multiple pieces, which leads to wrong magnitude determinations222Shredding of large galaxies is caused by the combined effect of cutting the images of individual galaxies into multiple pieces, due to the observing strategy of SDSS by discrete “tiles”, and to the inefficiency of Sextractor (Bertin & Arnouts 1996) in reconstructing the total flux of very extended objects. (Blanton et al. 2005a,b,c). Hence a reliable optically selected sample can be extracted from the SDSS spectroscopic database following the criteria described in Gavazzi et al. (2010, 2011) which we only briefly summarize here. We searched the SDSS DR7 spectroscopic database (Abazajian et al. 2009) in regions 1 and 2 (see Figure 1) for all galaxies with 17.77 mag, which matches the selection criterion of the SDSS spectral catalog (Strauss et al. 2002), in the redshift interval . We obtained 4790 targets. For each, we extracted the coordinates, the Petrosian magnitudes (AB system, not corrected for internal extinction), and the spectroscopic information, including the principal (nuclear) line intensities and the redshift. The morphological classification of all galaxies was performed by individual visual inspection of SDSS color images.
To fill in the incompleteness of SDSS for luminous galaxies due to shredding and fiber conflict, we added 133 CGCG (Zwicky et al. 1961-1968) galaxies with known redshifts from NED that were not included in the SDSS spectral database. For these objects, we also took the Petrosian magnitudes using the SDSS DR7 navigation tool, which provides accurate magnitudes. Additional galaxies that could not be found in the SDSS spectroscopic catalog were searched for using NED. For these targets, we again evaluated the magnitudes using the SDSS navigator, and of these we selected 76 objects that meet the condition . We repeated a similar search in the ALFALFA database (Haynes et al. 2011) in region 2, where we found 28 additional HI-selected systems with , that were not included in the SDSS spectral database.
In total, our optical sample consists of 5026 galaxies: 4790 from SDSS and 236 from other sources. Of the 5026, 2146 galaxies lie in region 2.
The stellar mass was derived from the magnitudes and color using the transformation
| (1) |
where is the band luminosity in solar units (). This is a modification of the Bell et al. (2003) formula that we computed to be consistent with the mass determination of Brinchmann MPA-JHU333www.mpa-garching.mpg.de/SDSS/DR7/, see Salim et al. (2007).
Following a procedure identical to the one used in Gavazzi et al. (2010, 2011), the local number density around each galaxy was computed within a cylinder of 1 radius and 1000 half-length. Around each galaxy we computed the 3-D density contrast as
, where is the local number density and = 0.05 gal Mpc represents the mean number density measured in the whole region. We divided the sample into four overdensity bins, chosen to highlight physically different environments of increasing level of aggregation: the ultra-low density bin (UL: log(1+) that describes the underdense cosmic structures (sparse filaments and voids); the low-density bin (L: ) that comprises the filaments in the Great Wall and the loose groups; the high-density bin (H: ) that includes the cluster outskirts and the significant groups; and the ultra-high density bin (UH: log) that corresponds to the cores of rich clusters.
2.2 HI-selected sample
The HI-selected sample analyzed in this work is drawn from the 360 square degree region 2. This region has been fully mapped by ALFALFA, providing us with a complete sample of HI-selected galaxies (Haynes et al. 2011). At present, half of the Coma cluster lies within the footprint of ALFALFA.
The completeness and sensitivity of ALFALFA are clearly described and discussed in detail in Saintonge (2007), Martin et al. (2010), and Haynes et al. (2011). An estimate of the limiting sensitivity of ALFALFA at the distance of Coma can be obtained using equation 1 in Giovanelli et al. (2007):
| (2) |
where is the integrated flux under the HI
profile in units of Jy km s-1, is a smoothing width expressed as the number of spectral resolution bins of 10
that bridges half of the signal width.
is the profile width at 50% of the height and
is the typical noise in the baseline in bins of 10 .
For , .
The HI mass is
,
where is the distance to the source in Mpc.
The limiting HI mass of ALFALFA can be computed as
| (3) |
where ( is the face-on line width) and is the galaxy inclination in the plane of sky determined from equation (A1).
Adopting mJy, typical of ALFALFA spectra, the mean distance to Coma , and , we obtain for =10, 45, 70 deg444At the distance of Virgo (=17 Mpc) these limits are 35 times lower, becoming 7.24, 7.54, 7.60 . . In conclusion, ALFALFA is sensitive to galaxies that contain approximately at the distance of Coma.
2.3 H sample
H consists of follow-up H observations of 383 galaxies among the HI-selected (detected) ones. These data, resulting from the joined effort by the H collaboration in 2010, 2011 and 2012 using the 1.5m and 2.1m telescopes at SPM, will be discussed in full detail (and publicly released) in Paper V of this series. Starting from 683 ALFALFA targets with high signal-to-noise (typically S/N) and a good match between two independent polarizations (code = 1 sources; Giovanelli et al. 2005, Haynes et al. 2011), in the first two years (2010, 2011) our observational effort had been focused on radio targets brighter than and with , while fainter targets were observed in 2012. However, approximately 95 additional bright CGCG galaxies (Zwicky et al. 1961-1968) in the intersection between region 1 and 2 () and 207 additional CGCG galaxies outside region 2 were already observed in H by Gavazzi et al. (1998, 2002a, 2002b, 2006), Boselli & Gavazzi (2002), and Iglesias Paramo et al. (2002). For these targets images and fluxes are publicly available via the GOLDmine web server (Gavazzi et al. 2003). In total, the number of galaxies in Sample 3 (H) is 383, but the total number of galaxies observed in H is 95+383+207=685. For these targets the SFR was computed from the luminosity of the H line after correcting for Galactic extinction and after the H line was deblended from the contribution from [NII] emission using the criteria adopted in Paper I. Based on the mass-metallicity relation (Tremonti et al. 2004), we calibrated a relation between the ratio N[II]/H and the absolute band magnitude, excluding active galactic nuclei (AGNs). Details on these quantities will be given in Paper V. No correction for internal dust extinction has been applied because very few drift-scan-spectra are available from Gavazzi et al. (2004) and Boselli et al. (2013), which are necessary to estimate the Balmer decrement and in turn the extinction coefficient A(H) on the full disk scale. The SDSS spectra could not provide for this correction because, at the distance of Coma, they cover just the nuclear galaxy region and hence are not representative of the whole galaxy.
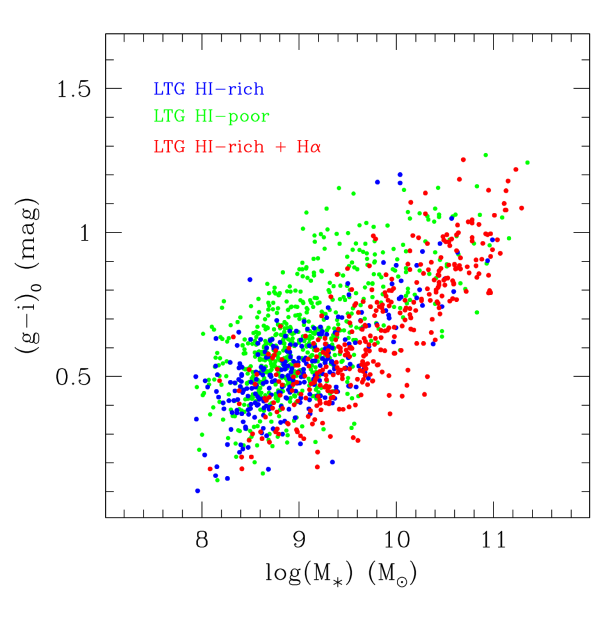
Summarizing, ALFALFA provides us with the HI mass of LTGs complete to approximately , whose optical colors (corrected for internal extinction according to the prescriptions of Appendix A) and stellar masses are distributed as shown in Figure 2. The figure highlights that only the part of the “blue cloud” composed of HI-rich LTGs is sampled by ALFALFA (blue + red symbols), whereas LTGs that have less than of HI, hereafter considered HI-poor LTGs, are not detected by ALFALFA (green symbols). in this Figure we highlight with red symbols We highlight the subsample of ALFALFA targets that were followed-up in H with red symbols.

3 Environmental Effects
3.1 Pattern of HI-deficiency
It has long been known that the HI-deficiency parameter () is perhaps the most reliable indicator of whether or not an LTG belongs to the harsh environment of a rich cluster (Giovanelli & Haynes, 1985). has been defined by Haynes & Giovanelli (1984) as the logarithmic difference between the HI mass observed in an object and the expected value in isolated and unperturbed objects of similar morphological type and linear diameter : . Here, , where (in kpc) is determined in the band at the isophote. The coefficients and were determined by Haynes & Giovanelli (1984) by studying a control sample of isolated objects, and later, on a larger sample by Solanes et al. (1996). Both samples are composed almost exclusively of giant spirals however. The HI deficiency parameter was therefore poorly calibrated for dwarf objects. This problem was addressed in Paper II, where the relatively isolated galaxies in the Local Supercluster were used to determine that =7.51 and =0.68 hold for all LTGs. Here, combining isolated LTGs from the Local Supercluster with the lowest density objects in the Coma supercluster we obtain =7.50 and =0.79, consistently with the Local Supercluster alone (and with the Coma1 cloud, see Boselli & Gavazzi 2009). These coefficients are consistent with those adopted by Solanes et al (1996) up to Sc galaxies, and by Toribio et al. (2011) up to Scd-Sd galaxies.
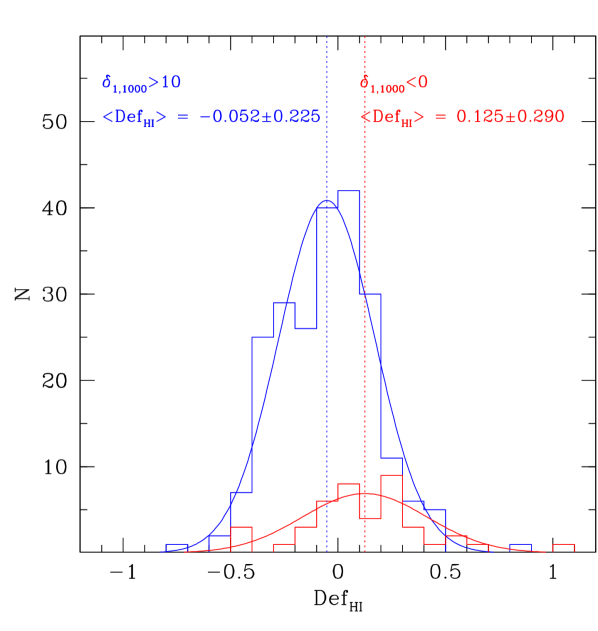
Figure 3 shows the relations among and the diameters found adopting these coefficients. The fit555Linear regressions are obtained in this work using the bisector method (mean coefficients of the direct and the inverse relation, Isobe et al. 1990). obtained for all LTGs is depicted with the dashed line. The distribution of the parameter of galaxies in the Coma supercluster is plotted in Figure 4 separately for (isolated objects, blue) and (rich clusters, red), with the mean obtained in the two bins (intermediate-density objects are not plotted, but are considered in the following analysis). Apparently, isolated objects have a mean deficiency consistent with . Throughout this paper we consider as “normal” or “unperturbed” by the cluster environment, as far as their HI content is concerned, 270 galaxies with , i.e., within 1 of the mean deficiency of the isolated sample. At the distance of Coma, galaxies with are undersampled because they lie below the sensitivity of ALFALFA.
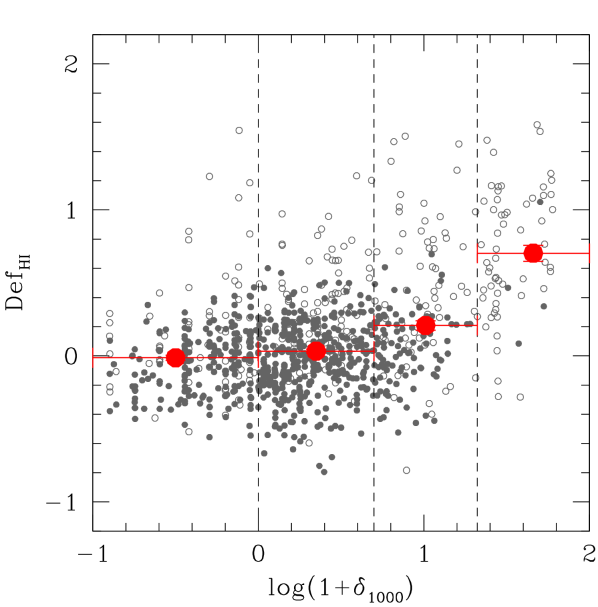
Figure 5 shows the deficiency parameter plotted as a function of the local density. Filled symbols refer to galaxies in the HI-selected sample, i.e., detected by ALFALFA. Evidently, as the galaxy density approaches 1 (the cluster outskirts) ALFALFA detects almost no galaxies, because they are too shallow to reveal the Giovanelli & Haynes (1985) pattern of HI deficiency near the Coma cluster. However, when pointed long-integration HI observations deeper than ALFALFA are considered, such as those available for region 1 from GOLDmine (open gray symbols with red binned averages), the expected increase of with local density clearly appears.
3.2 What do the LTGs undetected by ALFALFA represent?
In contrast to the Local Supercluster (Paper II of this series),
the sensitivity of ALFALFA at Coma is insufficient for detecting galaxies with significant HI deficiency
(see previous section)666We recall that ALFALFA is a two-passes survey of approximately 7000 sq degrees visible from Arecibo.
To make it sensitive to of HI at the distance of Coma, it would require some 500,000
hours of telescope time!.
The known trend of increasing HI deficiency with increasing galaxy density
(see Figure 4) could be revealed only
using the long-integration pointed radio detections available in region 1.
Therefore a discussion similar to Paper II, where some galaxy properties were
analyzed in bins of increasing , cannot be undertaken.
Moreover, because H suffers from the same selection bias as ALFALFA,
no trends between the SFR and the HI deficiency can be directly investigated.
This problem can be addressed, however,
by separating LTGs that were detected/undetected by ALFALFA.

As already stressed in Paper I, the radio selection biases H toward HI-rich LTGs (see also Gavazzi et al. 2008). ALFALFA detects almost exclusively LTGs in the blue sequence, not all LTGs are detected (see green symbols in Figure 2). As we showed in Paper II and in Gavazzi et al. (2008), where we focused on galaxies in the Local Supercluster, the very existence of a limiting HI mass combined with the relation (see Appendix B) that holds for normal galaxies induces an optical limit for the detection of HI-rich systems. At the distance of Coma, galaxies fainter than M or mag are not detected by ALFALFA. Furthermore, even some late-type galaxies brighter than this limit are not detected in ALFALFA or in H. LTGs that are not detected by ALFALFA are truly HI-poor systems777Before assuming that all galaxies undetected by ALFALFA are intrinsically HI-poor, i.e., have M, one must exclude the optical targets undetected by ALFALFA due to confusion in the Arecibo beam by other detected galaxies at similar velocity. Using a 3.5 arcmin FWHM beam and at the position of each detected target, we found only 28 optically selected candidates that were confused (roughly 1% of all galaxies in region 2 and 4% of all undetected LTGs). We thus conclude that most undetected LTGs with M are truly HI-poor systems. Indeed, using pointed observations available from Arecibo for LTGs in the intersection between region 1 and region 2, we determined that for LTGs detected by ALFALFA, while for LTGs undetected by ALFALFA..
Figure 6 sheds more light on the nature of HI-poor LTGs by plotting their frequency distribution as a function of the local galaxy density: the fraction of HI-rich LTGs detected by ALFALFA (blue histogram), representing about 50% of all LTGs in the field, decreases gradually with increasing density and drops to zero in the core of Coma; the fraction of HI-poor LTGs undetected by ALFALFA (green histogram), representing the remaining 50% of all LTGs in the field, increases with increasing density to nearly 100%. Incidentally, the fraction of post-star burst systems is null in the field, in filaments, and in groups but it becomes significant in the core of Coma (see also Gavazzi et al. 2010). Summarizing, when galaxies approach denser environments, their gas content is progressively reduced, which mimics the pattern of morphology segregation.
3.3 Color, HI content, and local density
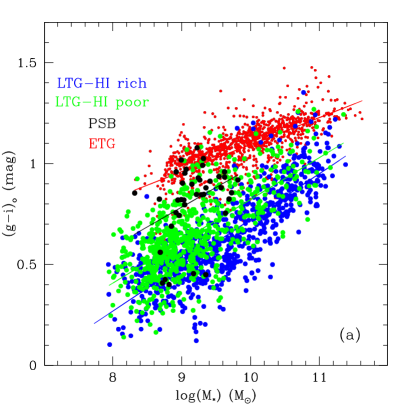
We now show that HI-poor LTGs are statistically less star-forming than their HI-rich counterparts of similar stellar mass. Figure 7a shows the color-mass relation of galaxies, divided into four groups of different morphological type/gas-content: HI-rich (detected by ALFALFA) LTGs are plotted with blue symbols; HI-poor (undetected by ALFALFA) LTGs are marked with green symbols, PSB galaxies identified by Gavazzi et al. (2010) are shown with large black symbols888A confirmation that PSB galaxies are low-mass objects that fill the “green valley” between star-forming and passive galaxies was derived for the galaxy Zoo by Wong et al. (2012)., and red symbols represent early-type galaxies that belong to the red sequence.
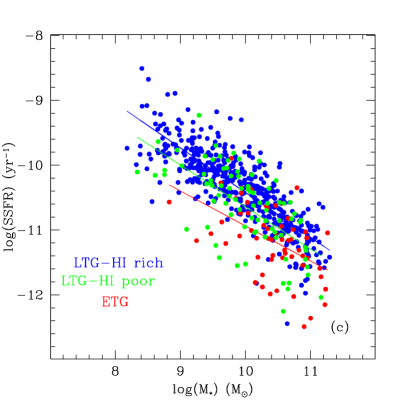
Late-type galaxies that are not detected by ALFALFA (green symbols), dubbed HI-poor LTGs, lie nearer to the “green valley” than ALFALFA detected galaxies (blue symbols) even though they belong to the sequence of LTGs. For all types of galaxies, Figure 7a reports the linear fit of the color-stellar mass relation. The four galaxy groups, selected by their optical morphology/gas content and nuclear spectral properties, have increasingly redder colors, i.e., decreasing SSFR. Despite the paucity of H measurements (particularly of HI-poor and ETGs), Figure 7c supports the idea that the color-mass sequence is indeed a star formation-mass sequence. Here we plot the specific star formation rate (SSFR), i.e., the star formation rate per unit stellar mass, as derived from our H data for ALFALFA-detected (blue symbols) and for the few HI-poor (green symbols) and ETGs (red symbols) that are included in H, with their linear fits999By selection we have very few H images of HI-poor galaxies (either ETGs or LTGs) because, as they are not in the ALFALFA sample, they are excluded also from H. However, a few dozen of them were serendipitously observed, some on purpose, during the 2012 run. In particular the 80 measurements for ETGs belong for the most part to S0 (19) and S0a (38). Their SFR is derived from the intensity of the H line..
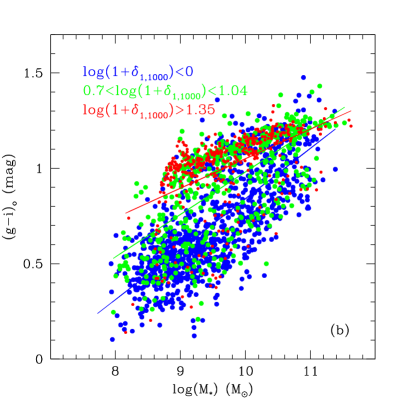
There is a qualitative correspondence (albeit with a large scatter) between the classification given in Fig 7a, based on morphology, and the one given in in Figure 7b, based on local galaxy density: HI-rich LTGs detected by ALFALFA have mean , typical of the sparse galaxy population; HI-poor LTGs undetected by ALFALFA have mean , typical of the outskirts of rich clusters and of the densest groups; galaxies with nuclear post-star-burst spectra (PSB) and passive ETGs have mean , implying that they are found primarily in the cores of rich clusters.
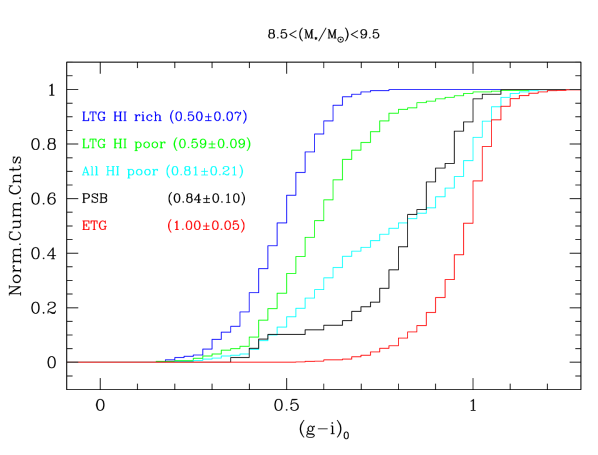
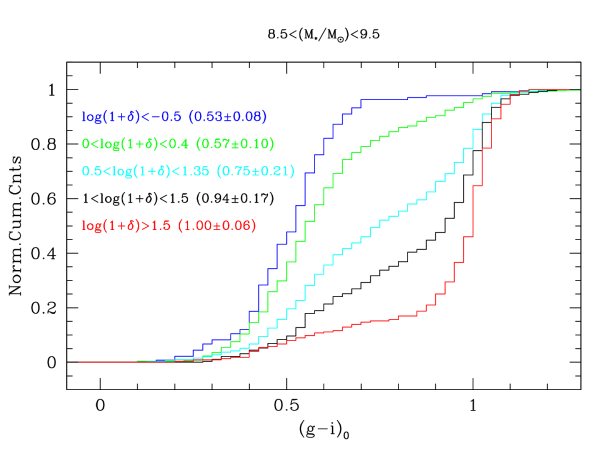
A quantitative assessment of the median color in different classes of morphology/HI content and its correspondence with the median color in different classes of local galaxy density is given in Figure 8, referring only to the low-mass interval . The left panel shows the cumulative distribution of galaxies (in region 2), selected according to a criterion of decreasing “lateness”101010Along with these four categories, Figure 8 also reports with cyan symbols the intermediate interval that contains HI-poor galaxies of any morphological type for completeness. The median color in this interval is 0.81 mag.:
-
•
HI-rich LTGs () (blue)
-
•
HI-poor LTGs () (green)
-
•
PSB galaxies () (black)
-
•
ETG galaxies () (red),
The median color increases step by step from 0.50, 0.59, 0.84, to 1.00 mag along this sequence, which thus represents a sequence of decreasing specific star formation. The right panel shows the cumulative distribution of galaxies of any morphological type, selected in bins of increasing (not necessarily contiguous) local galaxy density: from (blue), (green), (cyan), (black) to (red). In this case the median color increases step by step from 0.53, 0.57, 0.75, 0.94, to 1.00 mag, which agrees well with the previous series, so the shape of the distributions is remarkably similar, despite the completely independent criteria in choosing the morphological intervals and the density intervals. It should be remarked that this result holds for galaxies in the low-mass interval only. We have checked that for the data do not support a similar pattern with increasing ambient galaxy density. Consistently with Gavazzi et al. (2010) we conclude that nurture works in the low mass regime, while other genetic processes, namely , have shaped the high-mass part of the red sequence earlier in the cosmic history. In the high-mass regime Mendel et al. (2012) have suggested that the quenching of the star formation, leading to the transition from star-forming to passive galaxies, is driven by the formation of stellar bulges.
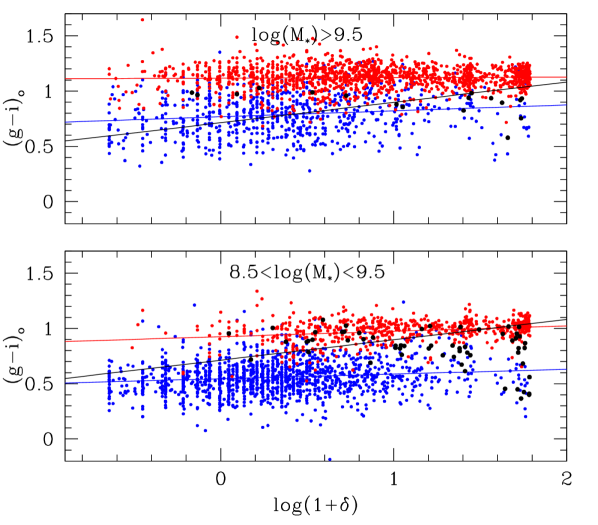
Figure 9 is useful for discussing the dependence of the color on the local galaxy density, separately for galaxies less and more massive than . First, the massive galaxies have a well-developed red sequence even at galactic densities as low as , while for the less massive objects the red sequence exists only above , in agreement with Gavazzi et al. (2010). Second, galaxies in the red sequence dominate in number the distribution of the massive galaxies, while the reverse is true for low-mass galaxies. Third, blue-sequence galaxies are more abundant at low density, where the red sequence is coarser and the number of PSB galaxies is relevant only at low mass, in agreement with Gavazzi et al. (2010) and Wong et al. (2012). Fourth, the color of the ETG sequence is constant over the full density range (see red linear fit), while the color of the LTG sequence increases only very little by 0.1 mag in the low-mass regime (see blue linear fit). The apparent slope of the color as a function of density considering all galaxies (see black linear fit) is entirely due to a population effect: at high density the ETGs dominate in number. It is not clear if the color distribution is truly bimodal or, if we had not subdivided LTGs from ETGs by morphology, the red and the blue sequence would result in a single sequence that would progressively redden with increasing density.
3.4 Activity on nuclear scale
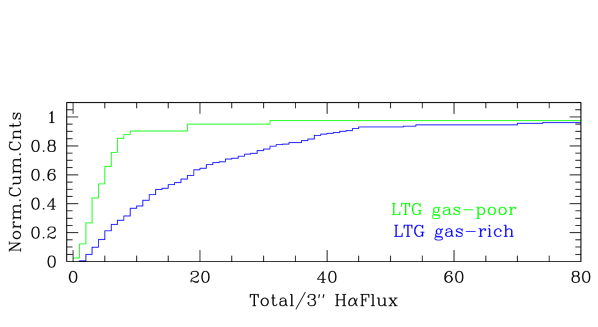
It is interesting to verify if the H morphology of HI-poor LTGs differs statistically from the HI-rich ones. To pursue this, we measured the total extended flux and the flux in the central 3 arcsec (mimicking the SDSS spectral fibers) of HI-poor LTGs in the H images. The cumulative distribution of the ratio of the two fluxes is given in Fig. 10 (green histogram). This distribution is significantly different from the one of HI-rich galaxies (blue histogram), because the H distribution of HI-poor galaxies is much more centrally concentrated. The HI-poor LTG galaxies appear to have some H emission that is for the most part confined to a central or even nuclear source111111In order to protect against size effects, we have recomputed the flux ratio in Fig. 10 using a variable inner aperture of 3, 6 and 9 arcsec, each chosen according to the overall size of the galaxies. Our conclusions remain unchanged.. A Kolmogorov-Smirnov test indicates that the probability that the two samples are drawn from the same parent population is % , i.e., they differ significantly. This is consistent with an H disk truncated by ram-pressure (Fumagalli & Gavazzi 2008), such as in the prototype NGC 4569 in Virgo (Boselli et al. 2006) or in NGC 4848 in Coma (Fossati et al. 2012). These cases are different from the HI-rich systems, which tend to host H emission extended across the entire disk (as discussed in Paper IV).
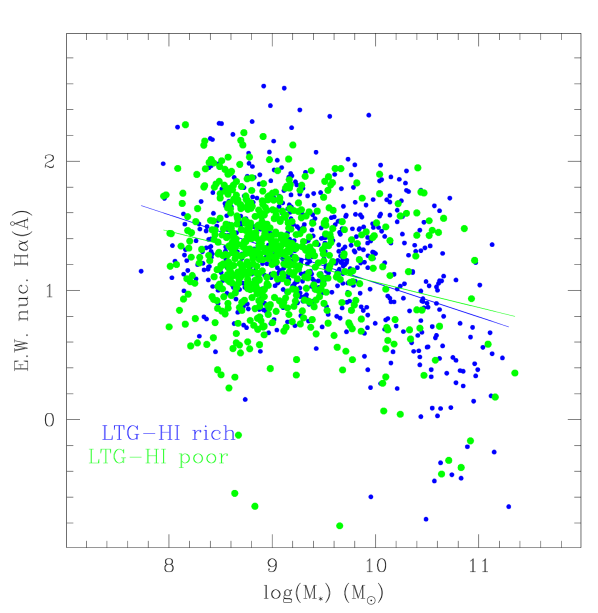
Figure 11 shows that HI-poor and HI-rich LTGs have an identical intensity of the nuclear H however. The figure shows the distribution of the H equivalent width (EW, a proxy for nuclear SSFR) as derived from the nuclear SDSS spectra versus the stellar mass separately for HI-rich (blue symbols) and HI-poor (green symbols) LTGs. Both subsamples show an identical mild decrease of the nuclear H EW with increasing mass (similar to the decrease of the diffuse SSFR with mass in Figure 15 d), but apart from that they have an identical specific star formation activity in the nuclear region. A Kolmogorov-Smirnov test indicates that the probability that the two samples are drawn from the same parent population is 4.1 %, i.e., they do not differ by more than 2 sigma.
In conclusion, HI normal, low-mass LTGs have extended star-forming disks. The star formation shrinks to the nucleus when LTGs are affected by gas ablation, but on this scale the star formation occurs with the same intensity as in gas rich systems. Only ETGs become completely passive even in their nuclei (at stellar masses as low as AGNs of high and low activity (LINER) are practically absent even among ETGs, see Gavazzi et al. 2011). This provides solid evidence that the mechanism that produces the quenching of the star formation proceeds outside-in, as in the ram-pressure scenario. Other processes such as tidal interactions would truncate the star formation in the outer disks, but would increase it as well on the nuclear scale (Kennicutt et al. 1987, see however Bretherton et al. 2010, who claimed some role of tidal mechanisms in cluster galaxies). In contrast, milder ablation processes such as starvation could produce a cut-off of the cold gas supply an in turn a significant quenching of the star formation even in galaxy groups (as supported by numerical simulations by Kawata & Mulchaey 2008). However, this mechanism is not expected to reproduce the truncated HI disks (Cayatte et al. 1994, Chung et al. 2009) and the truncated H profiles (Koopmann & Kenney 1998, 2004; Boselli et al. 2006) observed in cluster galaxies.
3.5 Local density or velocity dispersion?
It is also interesting to check if the transformation just found, i.e., the progressive reduction of the star formation with increasing density, occurs only in the environment of rich galaxy clusters or also in galaxy groups. For this we studied a possible dependence of the fraction of HI-rich LTGs on the velocity dispersion of the groups/cluster that host them. This is because traces the potential well of the hosting galaxy systems and, as a consequence, is directly and physically linked to the strength of the ram-pressure process (Gunn & Gott 1972, Domainko et al. 2006). We developed a two-step automatic procedure that identifies and characterizes the galaxy groups in region 2. The first step identifies galaxies that can be considered tracers of galactic groups. A tracer must lie in an overdensity with at least 20 members within a circle of 0.3 degree (530 kpc) radius. and the mean recessional velocity were estimated for each tracer by averaging over its neighbors up to a maximum number of 30 galaxies. This allows for a more detailed description of the “local” sigma value in the highest density regions like, e.g., the Coma cluster. Once the tracers were identified, the code proceeded with step II, in which the membership of each individual LTG to a group/cluster was checked. To be hosted by a group, a galaxy () must lie within a projected separation of 0.5 deg (900 kpc) and () its velocity along the line of sight must not differ by more than 3 from . The code defines as “field” galaxy every object located more than 3 deg (5.3 Mpc) away from each overdensity. This conservative constraint slightly reduces the number statistics, but prevents any contamination from galaxies in the outskirts of the overdensities themselves.
The procedures identified seven groups and the Coma cluster, as listed in Table 1.
The test discussed in Dressler & Shectman (1988) confirmed the
substructures we found. This is to be expected because of the velocity
criterion that we
enforced to define the group elements. This criterion selects
dynamically well-defined groups with a velocity dispersion quite a bit lower
than the Coma cluster itself, as shown in Figure 12.
| Group | Name | RA | Dec | N | ||
|---|---|---|---|---|---|---|
| gr1 | NGC 3651 | 170.7608 | 24.210 | 35 | 7745 | 455 |
| gr2 | NGC 4104 | 181.6839 | 28.172 | 27 | 8316 | 672 |
| gr3 | UGC 7115 | 182.0195 | 25.260 | 54 | 6627 | 427 |
| gr4 | NGC 4213 | 183.8709 | 23.916 | 12 | 6884 | 287 |
| gr5 | NGC 4555 | 188.8925 | 26.573 | 43 | 6615 | 309 |
| gr6 | UGC 8763 | 207.7632 | 25.039 | 37 | 8779 | 230 |
| gr7 | IC 4345 | 208.8824 | 25.126 | 23 | 8994 | 260 |
For each group we computed the fraction of HI-rich LTGs with the associated Poissonian uncertainty. The fraction of HI-rich LTGs for the entire late-type population is plotted in Figure 12a as a function of the velocity dispersion and in Figure 12b as a function of the local galaxy density in three different environments: the large dot corresponds to the average fraction in the lowest density environment (field), the square is the fraction in the highest density environment (the Coma cluster) and the small dots correspond to seven individual groups, with the triangle showing their average value. Apparently, the fraction of HI-rich LTGs decreases with increasing local density (Figure 12b) (approximately 1 from isolated to groups and more than 4 from groups to clusters). However, considering the large statistical uncertainty on the gas-rich fraction, groups are truly intermediate between isolated and Coma galaxies, i.e., there is not definitive evidence that the entire decrease occurs in the densest environment.
Conversely, when the fraction HI-rich LTGs is plotted as a function of (Figure 12a), it becomes more clear that their fraction drops at km s-1, at the typical dispersion of Coma-like clusters (we caution, however, that the analysis presented in Figure 12 should be extended to comprise more Coma-like clusters before any strong conclusion can be drawn). Recent simulations by Bahe et al. (2012) have shown that the pressure exerted on the cold gas by the IGM is at least one order of magnitude higher in clusters than in groups. In addition, the efficiency of cold gas stripping is relevant only within the virial radius even for a massive cluster like Coma (see however Merluzzi et al. 2013), which renders a strong ram-pressure efficiency in groups unlikely because it would require the infalling galaxy to pass very near the group center.
4 Discussion and conclusion
The environmental conditions occurring in the vicinity of an evolved cluster of galaxies such as the Coma cluster have well-known (Giovanelli & Haynes 1985) catastrophic consequences on the HI content of their member galaxies. However, HI observations deeper than ALFALFA are required to detect the pattern of HI deficiency (see Sections 3.1 and 3.2). At the distance of Coma ALFALFA is just sensitive enough (M) to separate optically selected LTGs into HI-poor and HI-rich galaxies.
The SSFR (see Figure 7c) of galaxies scales down with the galaxy stellar mass,
but for the dwarf regime () there is a clear tendency for the median color
to increase systematically (see Figure 8a) along the “morphological” sequence constituted by
1) HI-rich LTGs, the bluest objects with median =0.50 mag;
2) HI-poor LTGs, with median =0.60 mag;
3) PSBs, with median =0.84 mag;
4) ETGs, with median =1.00 mag.
The specific star formation rate decreases accordingly.
Along this sequence there is a parallel sequence that refers to their nuclear properties:
HI-rich LTGs have identical nuclear star formation activity as HI-poor LTGs (Figure 11), but
their star formation extends over the whole disks, while
HI-poor LTGs harbor some star formation exclusively on a circumnuclear scale (Figure 10). The star formation
becomes entirely suppressed, even on nuclear scale in PSBs and ETGs.
Whatever mechanism quenches the star formation, it proceeds outside-in, as in the ram-pressure scenario
(see also Boselli et al. 2006, 2009).


A similar - stellar mass sequence is obtained by dividing galaxies into bins of increasing local density (Figure 7b and 8b). It appears indisputable that the local density has a main impact on the gas content and SF of galaxies, contributing to their morphological migration, i.e., HI-rich LTGs represent about 60% of the entire LTG population at low and intermediate galaxy density (comprising the cosmic filaments up to the groups) and drop to zero in the core of the Coma cluster. Conversely, HI-poor LTGs (representing the other 40% of the LTGs in isolation) increase in frequency with increasing density, becoming the majority of all LTGs in the core of Coma. This agrees with the analysis of Fabello et al. (2012) based on a M sample.
It is very tempting to interpret all these features as the results of a fast environmentally driven process that superposes to the standard and long-term evolutionary track that acts on field and group galaxies. Galaxies infalling toward a cluster are evolved by a process that causes some gas ablation, proceeding outside-in in two steps: 1) first a significant quenching of the global star formation is produced in the disk, resulting in redder colors, but without affecting the circumnuclear star formation; 2) the quenching of SF activity proceeds to the nuclear scale (transforming star-forming nuclei into passive ones, passing through the PSB phase). On a similar time scale, dwarf galaxies are transformed from LTGs to ETGs. The time scale for gas depletion is short enough ( 100-300 Myr) to quickly transform HI-rich LTGs into anemic LTGs, which end up as gas-free, passive dEs. This is precisely the mechanism invoked by Boselli et al. (2008) and by Gavazzi et al. (2010) to migrate dwarf star-forming systems into dEs in the neighborhood of rich galaxy clusters (see also Cortese & Hughes 2009 and Cortese et al. 2011). Meanwhile the ram pressure mechanism, owing to its short time scale, is also capable of producing a k+a signature in their spectra, thus enhancing the number of galaxies presenting some PSB phase toward rich clusters (Gavazzi et al. 2010; Wong et al. 2012) and making the number of active nuclei (both star forming and AGNs of various forms) decrease near the center of rich clusters (Gavazzi et al. 2011).
The dependence of this quenching process on the galaxy density and in particular on the galaxy velocity dispersion (it acts selectively on galaxies hosted in galaxy clusters, see Figure 12), together with the evidence that it proceeds from outside-in, make the ram-pressure mechanism (Gunn & Gott 1972) our favorite interpretation over strangulation (Larson et al. 1980) This conclusion should be taken with the grain of salt because it is based on one cluster (Coma) and should be confirmed with similar analysis of more clusters. In support of our conclusion, Merluzzi et al. (2013) found evidence for ram-pressure stripping well beyond 1 Mpc from the center of Abell 3558. In contrast the numerical simulations of Kawata & Mulchaey (2008) support the starvation mechanism as capable of cutting off the gas supply, hence of quenching the star formation even in galaxy groups.
We finally note that this fast evolutionary scenario could be used to constrain the build-up of the Coma cluster with cosmic time at the expenses of infalling galaxies, following the argument of Adami et al. (2005) for Coma and of Boselli et al. (2008) for Virgo. Assuming naively that the infall rate was constant over the past few Gyrs, this quantity can be estimated from the number of galaxies in each specific morphological stage divided by the typical time scale of each stage (to be precise, since this estimate is very sensitive to the sample completeness, the argument provides lower limits to the infall rate). Restricting this to galaxies with M, to be consistent with a similar calculation carried out in Paper II for Virgo, we classified 26 HI-rich LTGs within the cluster. Assuming a characteristic time scale for the complete stripping of gas due to ram pressure of 300 Myr for massive galaxies such as NGC 4569 (Boselli et al. 2008)121212This estimate is reduced to 100 Myr for dwarf objects such as VCC 1217 (Fumagalli et al. 2011) or VCC 1249 in the M49 group (Arrigoni Battaia et al. 2012)., we obtain a flux of infalling LTGs of Gyr-1. We can cross-check this result with the independent constraint derived from the number of galaxies in the HI-poor phase (70) (that still show some circumnuclear star formation probably sustained by residual nuclear HI and anchored to the deep central potential well), divided by the time-scale of ablation. Assuming that a complete HI and removal will occur due to ram pressure during the second passage through the cluster center on a time-scale of Gyr (see Paper II), the infall rate is Gyr-1. In passing we note that the time scale estimate we used is considerably shorter than that for complete consumption of the due to star formation of Gyr (Bigiel et al. 2008).
A similar argument holds for the 32 PSB galaxies observed in Coma. The PSB phase is expected to last up to 1.5 Gyr (Poggianti et al. 2009), but around 500 Myr in a blue continuum regime (see Fig. 20 in Boselli et al. 2008), such as in the 32 PSB galaxies analyzed here. Again, the galaxy flux toward Coma would be Gyr-1, consistent with the previous estimates. Assuming that the age of the Coma cluster is about 7.5 Gyr (its formation took place approximately at =1, Wechsler et al 2002), and that it is composed of about 750 galaxies, the infall rate would become Gyr-1. All ”order of magnitude” estimates are consistent with one another within 30 percent from Gyr-1, i.e., a constant galaxy flow building the cluster over a large portion of the cosmic time, as was concluded by Adami et al. (2005). Consistent infall rate, sustained for 2 Gyr, has been claimed to feed the younger Virgo cluster (Paper II).
The infall rate estimate can be checked for consistency with semi-analytic models of halo formation, e.g., Wechsler et al (2002). From their Figure 3 we derive that cluster-like halos accreted 70% of their final mass in the last 7.5 Gyr (the assumed age of the Coma cluster). If one takes for Coma a current halo mass of approximately , the average growth is . Considering (very crudely) that this accretion is contributed by galaxy halos of each, the derived accretion rate is 100 galaxies per Gyr on average, in agreement with our previous estimate.
| All | PSB | HI-poor | HI-rich | |
|---|---|---|---|---|
| N (M) | 750 | 32 | 70 | 26 |
| t (Gyr) | 7.5 1 | 0.5 0.2 | 0.7 0.4 | 0.3 0.1 |
| Infall rate (Gyr-1) | 100 14 | 64 28 | 100 58 | 86 33 |
Appendix A empirical correction for internal extinction
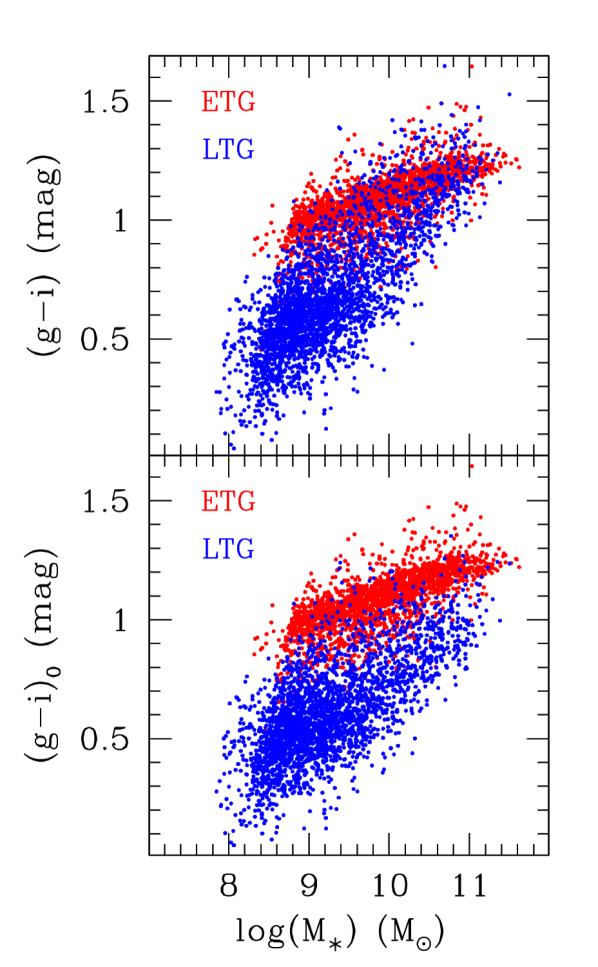
An exhaustive treatment of the internal extinction correction to the magnitudes is beyond the scope of this work and will be addressed in a forthcoming paper. We concentrate on a less ambitious task, i.e., on the empirical method for correcting the color magnitude relation for the effects of internal extinction. The color () versus stellar mass diagram (see Figure 13, color-coded according to the Hubble type) composed of all optically selected galaxies (regions 1 and 2) contains a well-developed red-sequence (e.g. Hogg et al. 2004) mostly composed of ETGs along with the so-called blue cloud, mostly composed of LTGs. When magnitudes are not corrected for internal extinction the two color sequences, that are well separated at low mass by the green valley, overlap one another at the high-mass end. This is an obvious consequence of the increasing internal extinction suffered by disk galaxies of increasing mass. Given the abundant number statistics offered by SDSS, it is possible to investigate this effect as a function of galaxy inclination in the plane of the sky. For disk galaxies (Sa through Sdm) the inclination with respect to the line of sight was computed following Solanes et al. (1996) assuming that spirals are oblate spheroids of intrinsic axial ratio :
| (4) |
where and are the major and minor axes. Intrinsic axial ratios were assumed to be equal
to the modal values of the distribution of true ellipticities of galaxies of different Hubble types
in the Second Reference Catalog of Bright Galaxies (de Vaucouleurs, de Vaucouleurs, & Corwin 1976).
For the giant spirals these are
for Sa, for Sab, and for Sb-Sc. Whenever , is set to .
Irregulars+BCD (mostly low-mass objects) do not have this parameter defined, because their axial ratio does not
give a measure of the inclination of the disk, but of their intrinsic triaxiality.
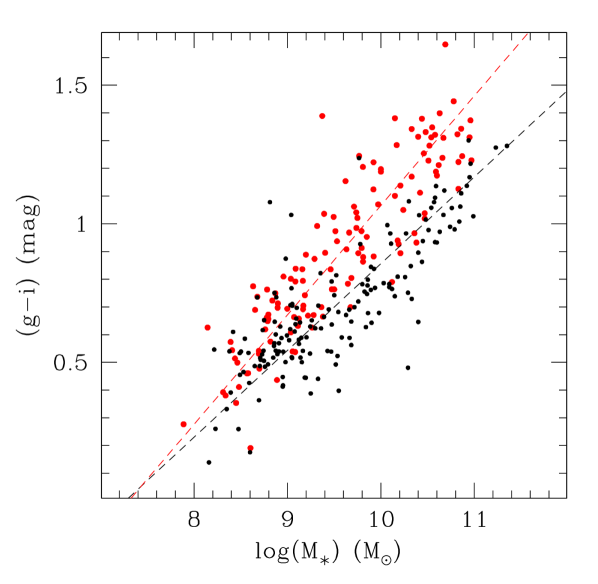
Figure 14 (top panel) shows the color versus stellar mass diagram for LTGs in regions 1+2 considering only
nearly edge-on () and nearly face-on () galaxies, with the best linear fit.
It is evident that the fits cross each other near log, i.e., the extinction correction is null near log,
and it increases with increasing stellar mass as a function of the inclination.
The slope of the relation
as a function of the cosine of the inclination is given in Figure 14 (bottom panel).
This relation can be used to extrapolate to the face-on value, or to obtain the color correction
for internal extinction:
| (5) |
where is the galaxy inclination. After applying the empirical internal extinction correction the resulting slope of the LTG sequence becomes similar to the one of ETGs, and the green-valley opens up over the full interval of masses (Figure 13 - bottom panel). Note the difference between the correction method proposed here (which depends on a combination of and ) and the one proposed by Yip et al. (2011), which purely depends on .

Appendix B Scaling relations
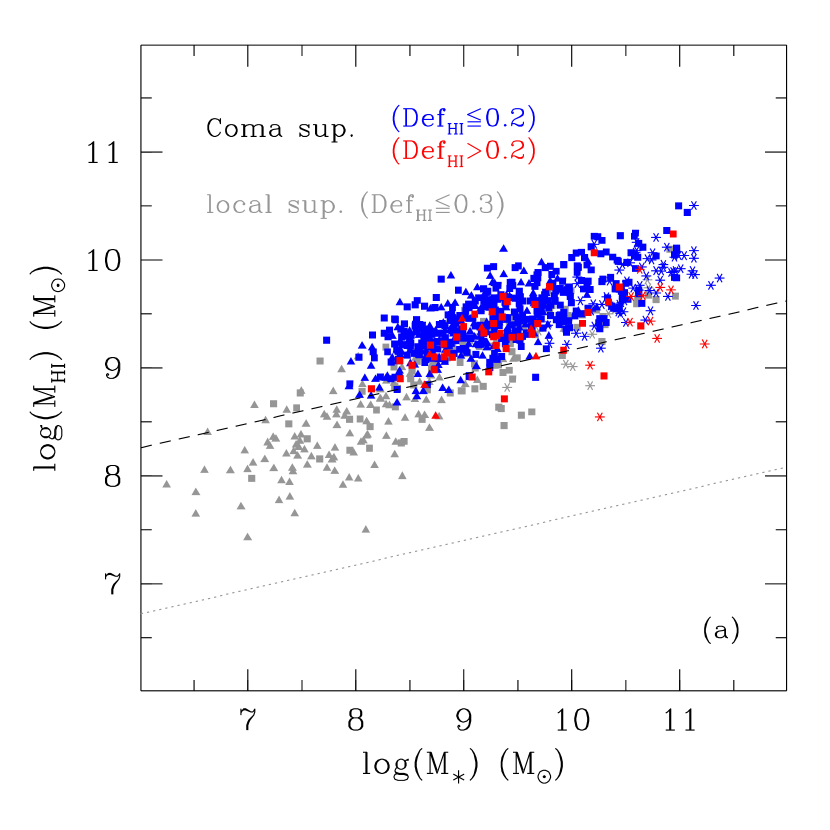
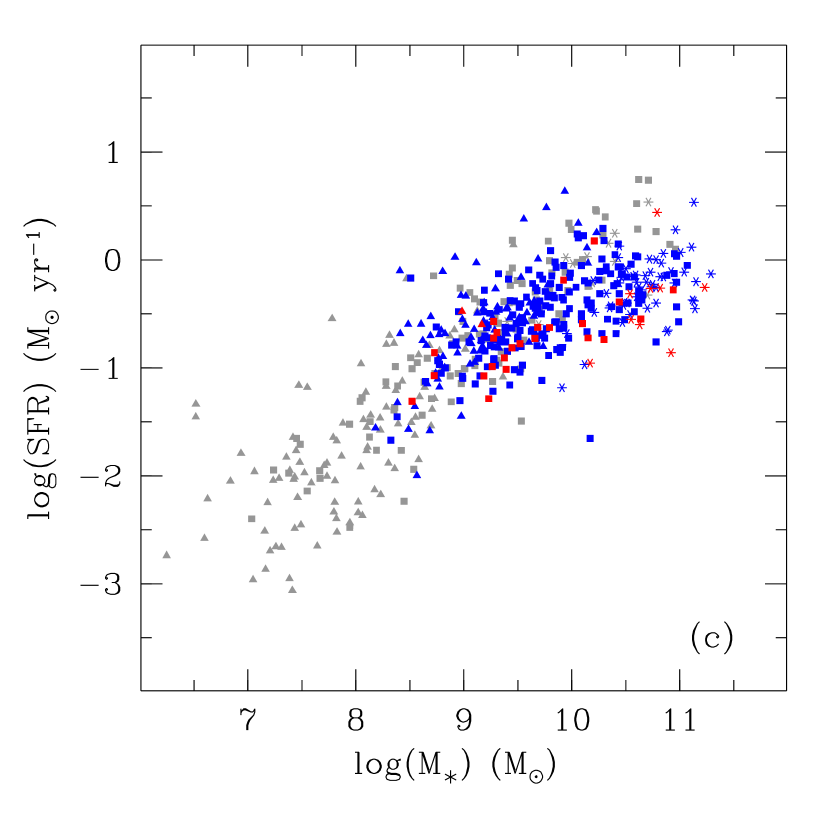
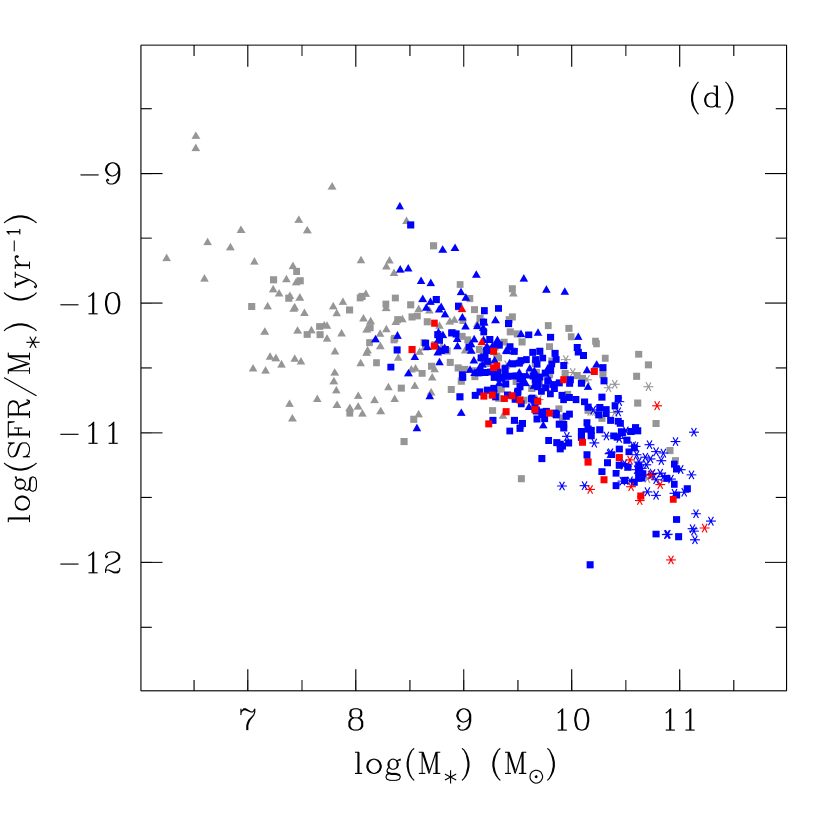
H, which is based on an ALFALFA-selected sample in the Coma supercluster provides us with insufficient coverage of HI mass, stellar mass, and SFR because of the shallowness of ALFALFA at the distance of Coma. Therefore the analysis of the scaling relation among the HI gas content and the stellar mass of galaxies cannot be undertaken with a sufficient dynamical range of HI mass, stellar mass, and SFR. However by adding the results of the present survey with similar ones obtained in Paper II for the Local Supercluster (where the ALFALFA sensitivity is 35 times better), we broaden the dynamic range to four decades in stellar mass, obtaining the relations shown in Figure 15, whose linear regression parameters are listed in Table 3. The data obtained in this paper for the Coma supercluster for galaxies with are plotted separately (blue symbols) from those in the Local Supercluster with taken from paper II (light gray). AGNs of various levels of activity are identified in Figure 15 (with asterisks) according to the criteria of Gavazzi et al. (2011).
We begin by studying the relation between and , as shown in Figure 15 (a). The diagonal lines represent the sensitivity limit of ALFALFA, computed for galaxies with an inclination of 45 deg (see Section 2.2). The dotted line is computed for the distance of the Virgo cluster (17 Mpc), while the dashed one is for the distance of Coma (100 Mpc). Clearly the observed distribution for Coma lies very close to the line of limiting sensitivity, making the observed slope (0.34) spuriously shallow because galaxies near M and M, which are present locally, would not be detected at the distance of Coma. However, at the high-mass end of the stellar mass function, where the sampling is more abundant in Coma than locally because of the larger volume, no selection effects would prevent us from detecting galaxies if they had the same steep slope as extrapolated from the Local Supercluster. Therefore we conclude that the change of slope seen in Figure 15 (a) near M is real. A relation similar to the one in Figure 15(a) and (b), i.e., significant flattening above M, has been obtained by Huang et al. (2012) using the whole .40 sample. They interpreted the flattening as a possible evidence of increasing gas loss due to AGN feedback with increasing mass.
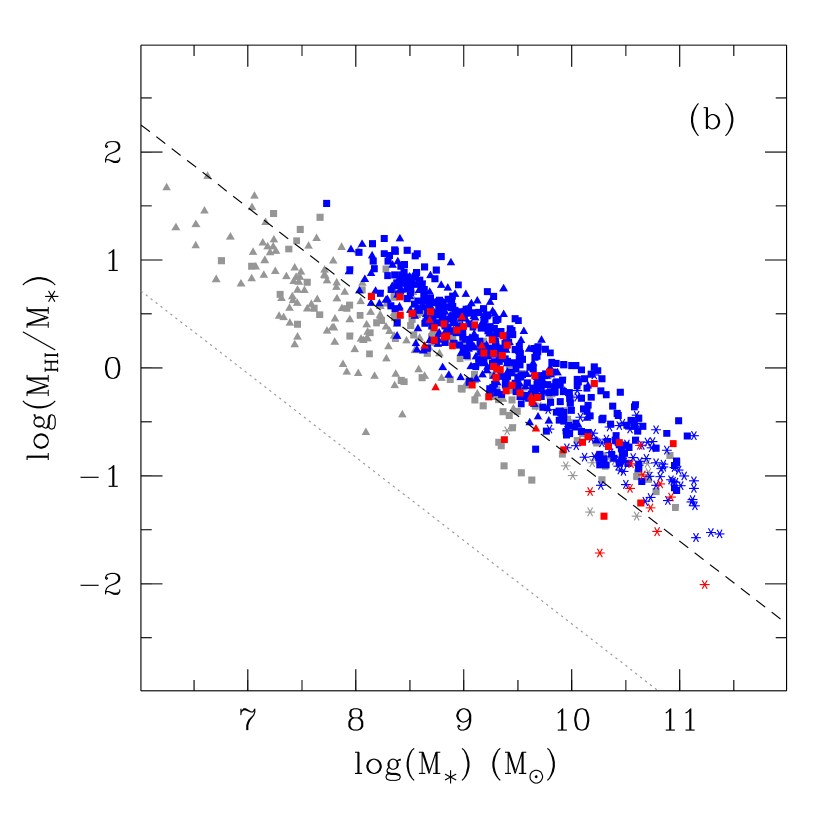
We note that the observed relation, both in the steep part (0.47) and in the shallow (0.32), is nonetheless significantly shallower than the direct proportionality, as already discussed in Gavazzi et al. (2008) and in Paper II, reflecting a genuine non-proportionality between the two quantities. When the HI gas fraction / is plotted as a function of the stellar mass (Figure 15 b), the fraction of gas decreases by approximately 2 orders of magnitude with increasing galaxy mass, from M to . In other words, M⊙ galaxies contain ten times more gas than stars. This ratio is reduced to less than 10% in M⊙ systems. This basic result agrees perfectly with what was found in the (optically selected) GASS survey by Catinella et al. (2010) in the stellar mass range M⊙ and by Cortese et al. (2011) for HI-normal galaxies in the Herschel Reference Survey (HRS; Boselli et al. 2010). It is also consistent with the scenario (Gavazzi 1993, Gavazzi et al. 1996, Cowie et al. 1996; Gavazzi & Scodeggio 1996, Boselli et al. 2001, Fontanot et al. 2009), where progressively more massive galaxies have less gas-to-star ratio at =0 because they have transformed most of their gas into stars at higher , while dwarf LTGs retain large quantities of hydrogen capable of sustaining the star formation at some significant rate at the present cosmological epoch.
Similarly, we find that the relation between the SFR and the stellar mass (Figure 15 c) and that of the specific SFR with stellar mass (d) are consistent with a change of slope around M. Below that threshold a steeper dependence (0.8, i.e., almost of direct proportionality) is traced by the local galaxies. Above this limit the relation is much shallower (0.33) and is followed by the more distant Coma galaxies. Consequently, in the range of stellar mass covered by the Coma supercluster the specific star formation rate decreases significantly with increasing mass, as found by Boselli et al. (2001), Bothwell et al. (2009) and by Schiminovich et al. (2010). This is again consistent with the ”downsizing” scenario. At lower mass the relation flattens out and the scatter increases by 2 orders of magnitude, as noted by other authors (Lee at al. 2007, Bothwell et al. 2009). The curvature in Figure 15 resulting from the superposition of the local and Coma superclusters is consistent with the change of slope found by Huang et al. (2012) in .40.
| Linear regression | sample | Fig.15 | |
|---|---|---|---|
| log log | 0.76 | C | a |
| log log | 0.85 | V | a |
| log log | 0.84 | V+C | a |
| log log | -0.92 | C | b |
| log log | -0.90 | V | b |
| log log | -0.86 | V+C | b |
| log log | 0.52 | C | c |
| log log | 0.88 | V | c |
| log log | 0.85 | V+C | c |
| log log | -0.79 | C | d |
| log log | -0.53 | V | d |
| log log | -0.72 | V+C | d |
Acknowledgements.
The authors would like to acknowledge the work of the entire ALFALFA collaboration team in observing, flagging, and extracting the catalog of galaxies used in this work and thank Shan Huang for providing original data. This research has made use of the GOLDmine database (Gavazzi et al. 2003) and of the NASA/IPAC Extragalactic Database (NED) which is operated by the Jet Propulsion Laboratory, California Institute of Technology, under contract with the National Aeronautics and Space Administration. We wish to thank the unknown referee whose criticism helped us to improve the manuscript. Funding for the Sloan Digital Sky Survey (SDSS) and SDSS-II has been provided by the Alfred P. Sloan Foundation, the Participating Institutions, the National Science Foundation, the U.S. Department of Energy, the National Aeronautics and Space Administration, the Japanese Monbukagakusho, and the Max Planck Society, and the Higher Education Funding Council for England. The SDSS Web site is http://www.sdss.org/. The SDSS is managed by the Astrophysical Research Consortium (ARC) for the Participating Institutions. The Participating Institutions are the American Museum of Natural History, Astrophysical Institute Potsdam, University of Basel, University of Cambridge, Case Western Reserve University, The University of Chicago, Drexel University, Fermilab, the Institute for Advanced Study, the Japan Participation Group, The Johns Hopkins University, the Joint Institute for Nuclear Astrophysics, the Kavli Institute for Particle Astrophysics and Cosmology, the Korean Scientist Group, the Chinese Academy of Sciences (LAMOST), Los Alamos National Laboratory, the Max-Planck-Institute for Astronomy (MPIA), the Max-Planck-Institute for Astrophysics (MPA), New Mexico State University, Ohio State University, University of Pittsburgh, University of Portsmouth, Princeton University, the United States Naval Observatory, and the University of Washington.G. G. acknowledges financial support from the Italian MIUR PRIN contract 200854ECE5. R.G. and M.P.H. are supported by US NSF grants AST-0607007 and AST-1107390 and by a Brinson Foundation grant. Support for M.F. was provided by NASA through Hubble Fellowship grant HF-51305.01-A awarded by the Space Telescope Science Institute, which is operated by the Association of Universities for Research in Astronomy, Inc., for NASA, under contract NAS 5-26555.
References
- Abazajian et al. (2009) Abazajian, K. N., et al. 2009, ApJS, 182, 543
- Adami et al. (2005) Adami, C., Biviano, A., Durret, F., & Mazure, A. 2005, A&A, 443, 17
- Arrigoni Battaia et al. (2012) Arrigoni Battaia, F., Gavazzi, G., Fumagalli, M., et al. 2012, A&A, 543, A112
- Bahe et al. (2012) Bahe Y. et al. 2012, arXiv:1210.8407
- Bell et al. (2003) Bell, E. F., McIntosh, D. H., Katz, N., & Weinberg, M. D. 2003, ApJS, 149, 289
- Bigiel et al. (2008) Bigiel, F., Leroy, A., Walter, F., Brinks, E., de Blok, W. J. G., Madore, B., & Thornley, M. D. 2008, AJ, 136, 2846
- Blanton et al. (2005) Blanton, M. R., Schlegel, D. J., Strauss, M. A., et al. 2005, AJ, 129, 2562
- Boselli et al. (2001) Boselli, A., Gavazzi, G., Donas, J., & Scodeggio, M. 2001, AJ, 121, 753
- Boselli & Gavazzi (2002) Boselli, A., & Gavazzi, G. 2002, A&A, 386, 124
- Boselli et al. (2002) Boselli, A., Iglesias-Páramo, J., Vílchez, J. M., & Gavazzi, G. 2002b, A&A, 386, 134
- Boselli & Gavazzi (2006) Boselli, A. & Gavazzi, G. 2006, PASP, 118, 517
- Boselli & Gavazzi (2009) Boselli, A., & Gavazzi, G. 2009, A&A, 508, 201
- Boselli et al. (2006) Boselli, A., Boissier, S., Cortese, L., et al. 2006, ApJ, 651, 811
- Boselli et al. (2008) Boselli, A., Boissier, S., Cortese, L., & Gavazzi, G. 2008, ApJ, 674, 742
- Boselli et al. (2009) Boselli, A., Boissier, S., Cortese, L., Buat, V., Hughes, T. M., & Gavazzi, G. 2009, ApJ, 706, 1527
- Boselli et al. (2013) Boselli, A., Hughes, T. M., Cortese, L., Gavazzi, G., & Buat, V. 2013, A&A, 550, A114
- Bothwell et al. (2009) Bothwell, M. S., Kennicutt, R. C., & Lee, J. C. 2009, MNRAS, 400, 154
- Bretherton et al. (2010) Bretherton, C. F., James, P. A., Moss, C., & Whittle, M. 2010, A&A, 524, A24
- Catinella et al. (2010) Catinella, B., Schiminovich, D., Kauffmann, G., et al. 2010, MNRAS, 403, 683
- Cayatte et al. (1994) Cayatte, V., Kotanyi, C., Balkowski, C., & van Gorkom, J. H. 1994, AJ, 107, 1003
- Chung et al. (2009) Chung, A., van Gorkom, J. H., Kenney, J. D. P., Crowl, H., & Vollmer, B. 2009, AJ, 138, 1741
- Cortese & Hughes (2009) Cortese, L., & Hughes, T. M. 2009, MNRAS, 400, 1225
- Cortese et al. (2011) Cortese, L., Catinella, B., Boissier, S., Boselli, A., & Heinis, S. 2011, MNRAS, 415, 1797
- Cowie et al. (1996) Cowie, L. L., Songaila, A., Hu, E. M., & Cohen, J. G. 1996, AJ, 112, 839
- Domainko et al. (2006) Domainko, W., Mair, M., Kapferer, W., et al. 2006, A&A, 452, 795
- Dressler & Shectman (1988) Dressler, A., & Shectman, S. A. 1988, AJ, 95, 985
- Fabello et al. (2012) Fabello, S., Kauffmann, G., Catinella, B., et al. 2012, MNRAS, 427, 2841
- Fontanot et al. (2009) Fontanot, F., De Lucia, G., Monaco, P., Somerville, R. S., & Santini, P. 2009, MNRAS, 397, 1776
- Fossati et al. (2012) Fossati, M., Gavazzi, G., Boselli, A., & Fumagalli, M. 2012, A&A, 544, A128
- Fossati et al. (2013) Fossati, M., Gavazzi, G., Savorgnan, G., Fumagalli M., Boselli, A., Gutierrez, L., H. Hernandez Toledo, Giovanelli, R., Haynes, M. P., Paper IV, 2013, A&A, Submitted
- Fumagalli & Gavazzi (2008) Fumagalli, M., & Gavazzi, G. 2008, A&A, 490, 571
- Fumagalli et al. (2011) Fumagalli, M., Gavazzi, G., Scaramella, R., et al. 2011b, A&A, 528, 46
- Gavazzi (1993) Gavazzi, G. 1993, ApJ, 419, 469
- Gavazzi et al. (1996) Gavazzi, G., Pierini, D., & Boselli, A. 1996, A&A, 312, 397
- Gavazzi & Scodeggio (1996) Gavazzi, G., & Scodeggio, M. 1996, A&A, 312, L29
- Gavazzi et al. (1999) Gavazzi, G., Boselli, A., Scodeggio, M., Pierini, D., & Belsole, E. 1999, MNRAS, 304, 595
- Gavazzi et al. (2002a) Gavazzi, G., Boselli, A., Pedotti, P., Gallazzi, A., & Carrasco, L. 2002a, A&A, 386, 114
- Gavazzi et al. (2002b) Gavazzi, G., Boselli, A., Pedotti, P., Gallazzi, A., & Carrasco, L. 2002b, A&A, 396, 449
- Gavazzi et al. (2003) Gavazzi, G., Boselli, A., Donati, A., Franzetti, P., & Scodeggio, M. 2003, A&A, 400, 451
- Gavazzi et al. (2004) Gavazzi, G., Zaccardo, A., Sanvito, G., Boselli, A., & Bonfanti, C. 2004, A&A, 417, 499
- Gavazzi et al. (2005) Gavazzi, G., Boselli, A., van Driel, W., & O’Neil, K. 2005, A&A, 429, 439
- Gavazzi et al. (2006) Gavazzi, G., Boselli, A., Cortese, L., et al. 2006, A&A, 446, 839
- Gavazzi et al. (2008) Gavazzi, G., Giovanelli, R., Haynes, M. P., et al. 2008, A&A, 482, 43
- Gavazzi et al. (2010) Gavazzi, G., Fumagalli, M., Cucciati, O., & Boselli, A. 2010, A&A, 517, A73
- Gavazzi et al. (2011) Gavazzi, G., Savorgnan, G., & Fumagalli, M. 2011, A&A, 534, A31
- Gavazzi et al. (2012) Gavazzi, G., Fumagalli, M., Galardo, V., Grossetti, F., Boselli, A., Giovanelli, R., Haynes, M. P. & Fabello, S., Paper I, 2012, A&A, 545, A16
- Gavazzi et al. (2013a) Gavazzi, G., Fumagalli, M., Galardo, V., Grossetti, F., Boselli, A., Giovanelli, R.& Haynes, M. P., Paper II, 2013, submitted to A&A
- Giovanelli & Haynes (1985) Giovanelli, R., & Haynes, M. P. 1985, ApJ, 292, 404
- Giovanelli et al. (2005) Giovanelli, R., Haynes, M. P., Kent, B. R., et al. 2005, AJ, 130, 2598
- Giovanelli et al. (2007) Giovanelli, R., Haynes, M. P., Kent, B. R., et al. 2007, AJ, 133, 2569
- Gunn & Gott (1972) Gunn, J. E., & Gott, J. R., III 1972, ApJ, 176, 1
- Haynes & Giovanelli (1984) Haynes, M. P., & Giovanelli, R. 1984, AJ, 89, 758
- Haynes & Giovanelli (1986) Haynes, M. P., & Giovanelli, R. 1986, ApJ, 306, 466
- Haynes et al. (2011) Haynes, M. P., Giovanelli, R., Martin, A. M., et al. 2011, AJ, 142, 170
- Hogg et al. (2004) Hogg, D. W., Blanton, M. R., Brinchmann, J., et al. 2004, ApJ, 601, L29
- Huang et al. (2012) Huang, S., Haynes, M. P., Giovanelli, R., & Brinchmann, J. 2012, ApJ, 756, 113
- Iglesias-Páramo et al. (2002) Iglesias-Páramo, J., Boselli, A., Cortese, L., Vílchez, J. M., & Gavazzi, G. 2002, A&A, 384, 383
- Isobe et al. (1990) Isobe, T., Feigelson, E. D., Akritas, M. G., & Babu, G. J. 1990, ApJ, 364, 104
- James et al. (2004) James, P. A., et al. 2004, A&A, 414, 23
- Kawata & Mulchaey (2008) Kawata, D., & Mulchaey, J. S. 2008, ApJ, 672, L103
- Kennicutt et al. (1987) Kennicutt, R. C., Jr., Roettiger, K. A., Keel, W. C., van der Hulst, J. M., & Hummel, E. 1987, AJ, 93, 1011
- Kennicutt et al. (2008) Kennicutt, R. C., Jr., Lee, J. C., Funes, S. J., José G., Sakai, S., & Akiyama, S. 2008, ApJS, 178, 247
- Koopmann & Kenney (1998) Koopmann, R. A., & Kenney, J. D. P. 1998, ApJ, 497, L75
- Koopmann & Kenney (2004) Koopmann, R. A., & Kenney, J. D. P. 2004, ApJ, 613, 866
- Larson et al. (1980) Larson, R. B., Tinsley, B. M., & Caldwell, C. N. 1980, ApJ, 237, 692
- Lee et al. (2007) Lee, J. C., Kennicutt, R. C., Funes, S. J., José G., Sakai, S., & Akiyama, S. 2007, ApJ, 671, L113
- Lee et al. (2009) Lee, J. C., Gil de Paz, A., Tremonti, C., et al. 2009, ApJ, 706, 599
- Martin et al. (2010) Martin, A. M., Papastergis, E., Giovanelli, R., et al. 2010, ApJ, 723, 1359
- Mendel et al. (2012) Mendel, J.T., et al. 2013, arXiv:1211.6115
- Merluzzi et al. (2013) Merluzzi, P., Busarello, G., Dopita, M. A., et al. 2013, MNRAS, 429, 1747
- Meurer et al. (2006) Meurer, G. R., Hanish, D. J., Ferguson, H. C., et al. 2006, ApJS, 165, 307
- Poggianti et al. (2009) Poggianti, B. M., Aragón-Salamanca, A., Zaritsky, D., et al. 2009, ApJ, 693, 112
- Saintonge (2007) Saintonge, A. 2007, AJ, 133, 2087
- Salim et al. (2007) Salim, S., Rich, R. M., Charlot, S., et al. 2007, ApJS, 173, 267
- Schiminovich et al. (2010) Schiminovich, D., Catinella, B., Kauffmann, G., et al. 2010, MNRAS, 408, 919
- Solanes et al. (1996) Solanes, J. M., Giovanelli, R., & Haynes, M. P. 1996, ApJ, 461, 609
- Toribio et al. (2011) Toribio, M. C., Solanes, J. M., Giovanelli, R., Haynes, M. P., & Masters, K. L. 2011, ApJ, 732, 92 .
- Tremonti et al. (2004) Tremonti, C. A., Heckman, T. M., Kauffmann, G., et al. 2004, ApJ, 613, 898
- Yip et al. (2011) Yip, C.-W., Szalay, A. S., Carliles, S., & Budavári, T. 2011, ApJ, 730, 54
- Wechsler et al. (2002) Wechsler, R. H., Bullock, J. S., Primack, J. R., Kravtsov, A. V., & Dekel, A. 2002, ApJ, 568, 52
- Wong et al. (2012) Wong, O. I., Schawinski, K., Kaviraj, S., et al. 2012, MNRAS, 420, 1684