A hybrid model for the evolution of galaxies and Active Galactic Nuclei in the infrared
Abstract
We present a comprehensive investigation of the cosmological evolution of the luminosity function of galaxies and active galactic nuclei (AGN) in the infrared (IR). Based on the observed dichotomy in the ages of stellar populations of early-type galaxies on one side and late-type galaxies on the other, the models interprets the epoch-dependent luminosity functions at using a physical model for the evolution of proto-spheroidal galaxies and of the associated AGNs, while IR galaxies at are interpreted as being mostly late-type “cold” (normal) and “warm” (starburst) galaxies. As for proto-spheroids, in addition to the epoch-dependent luminosity functions of stellar and AGN components separately, we have worked out, for the first time, the evolving luminosity functions of these objects as a whole (stellar plus AGN component), taking into account in a self-consistent way the variation with galactic age of the global SED. The model provides a physical explanation for the observed positive evolution of both galaxies and AGNs up to and for the negative evolution at higher redshifts, for the sharp transition from Euclidean to extremely steep counts at (sub-)mm wavelengths, as well as the (sub-)mm counts of strongly lensed galaxies, that are hard to account for by alternative, physical or phenomenological, approaches. The evolution of late-type galaxies and of AGNs is described using a parametric phenomenological approach. The modeled AGN contributions to the counts and to the cosmic infrared background (CIB) are always subdominant. They are maximal at mid-IR wavelengths: the contribution to the 15 and m counts reaches 20% above 10 and 2 mJy, respectively, while the contributions to the CIB are of 8.6% and of 8.1% at m and m, respectively. The model provides a good fit to the multi-wavelength (from the mid-IR to millimeter waves) data on luminosity functions at different redshifts and on number counts (both global and per redshift slices). A prediction of the present model, useful to test it, is a systematic variation with wavelength of the populations dominating the counts and the contributions to the CIB intensity. This implies a specific trend for cross-wavelength CIB power spectra, that is found to be in good agreement with the data.
1 Introduction
The huge amount of infrared (IR) to millimeter-wave data that has been accumulating in the last several years have not yet led to a fully coherent, established picture of the cosmic star-formation history, of the IR evolution of Active Galactic Nuclei (AGNs), and of the inter-relations between star formation and nuclear activity.
Many, increasingly sophisticated, phenomenological models for the cosmological evolution of the galaxy and AGN luminosity functions over a broad wavelength range have been worked out (e.g. Béthermin et al., 2012a, 2011; Gruppioni et al., 2011; Rahmati & van der Werf, 2011; Marsden et al., 2011; Franceschini et al., 2010; Valiante et al., 2009; Le Borgne et al., 2009; Rowan-Robinson, 2009). These models generally include multiple galaxy populations, with different spectral energy distributions (SEDs) and different evolutionary properties, described by simple analytic formulae. In some cases also AGNs are taken into account. All of them, however, admittedly have limitations.
The complex combination of source properties (both in terms of the mixture of SEDs and of evolutionary properties), called for by the richness of data, results in a large number of parameters, implying substantial degeneracies that hamper the interpretation of the results. The lack of constraints coming from the understanding of the astrophysical processes controlling the evolution and the SEDs limits the predictive capabilities of these models. In fact, predictions of pre-Herschel phenomenological models, matching the data then available, yielded predictions for Herschel counts quite discrepant from each other and with the data.
The final goal is a physical model linking the galaxy and AGN formation and evolution to primordial density perturbations. In this paper we make a step in this direction presenting a comprehensive ‘hybrid’ approach, combining a physical, forward model for spheroidal galaxies and the early evolution of the associated AGNs with a phenomenological backward model for late-type galaxies and for the later AGN evolution. We start from the consideration of the observed dichotomy in the ages of stellar populations of early-type galaxies on one side and late-type galaxies on the other. Early-type galaxies and massive bulges of S galaxies are composed of relatively old stellar populations with mass-weighted ages of –9 Gyr (corresponding to formation redshifts –1.5), while the disc components of spiral and irregular galaxies are characterized by significantly younger stellar populations. For instance, the luminosity-weighted age for most of S or later-type spirals is Gyr (cf. Bernardi et al. 2010, their Fig. 10), corresponding to a formation redshift . Thus proto-spheroidal galaxies are the dominant star-forming population at , while IR galaxies at are mostly late-type “cold” (normal) and “warm” (starburst) galaxies.
Fuller hierarchical galaxy formation models, whereby the mass assembly of galaxies is related to structure formation in the dark matter and the star formation and merger histories of galaxies of all morphological types are calculated based on physical prescriptions have been recently presented by several groups (Lacey et al., 2008; Fontanot et al., 2009; Narayanan et al., 2010; Shimizu et al., 2012). However, the predictions for the IR evolution of galaxies are limited to a small set of wavelengths and frequently highlight serious difficulties with accounting for observational data (Lacey et al., 2010; Niemi et al., 2012; Hayward et al., 2012).
While the evolution of dark matter halos in the framework of the ‘concordance’ CDM cosmology is reasonably well understood thanks to N-body simulations such as the Millennium, the Millennium-XXL and the Bolshoi simulations (Springel et al., 2005; Boylan-Kolchin et al., 2009; Angulo et al., 2012; Klypin et al., 2011), establishing a clear connection between dark matter halos and visible objects proved to be quite challenging, especially at (sub-)mm wavelengths. The early predictions of the currently favoured scenario, whereby both the star-formation and the nuclear activity are driven by mergers, were more than one order of magnitude below the observed SCUBA m counts (Kaviani et al., 2003; Baugh et al., 2005). The basic problem is that the duration of the star-formation activity triggered by mergers is too short, requiring non standard assumptions either on the Initial Mass Function (IMF) or on dust properties to account for the measured source counts. The problem is more clearly illustrated in terms of redshift-dependent far-IR/sub-mm luminosity function, estimated on the basis of Herschel data (Eales et al., 2010; Gruppioni et al., 2010; Lapi et al., 2011). These estimates consistently show that galaxies with Star Formation Rates have comoving densities . The comoving density of the corresponding halos is , where is the total virial mass (mostly dark matter), is the lifetime of the star-forming phase and is the expansion timescale. For the fiducial lifetime Gyr advocated by Lapi et al. (2011), while for Gyr, typical of a merger-driven starburst, . Thus while the Lapi et al. (2011) model implies a ratio easily accounted for on the basis of standard IMFs and dust properties, the latter scenario requires a ratio more than a factor of 6 higher.
To reach the required values of or, equivalently, of , Baugh et al. (2005) resorted to a top-heavy IMF while Kaviani et al. (2003) assumed that the bulk of the sub-mm emission comes from a huge amount of cool dust. But even tweaking with the IMF and with dust properties, fits of the sub-mm counts obtained within the merger-driven scenario (Lacey et al., 2010; Niemi et al., 2012) are generally unsatisfactory. Further constraints on physical models come from the clustering properties of sub-mm galaxies that are determined by their effective halo masses. As shown by Xia et al. (2012) both the angular correlation function of detected sub-mm galaxies and the power spectrum of fluctuations of the cosmic infrared background indicate halo masses larger than implied by the major mergers plus top-heavy initial stellar mass function scenario (Kim et al., 2011) and smaller than implied by cold flow models but consistent with the self-regulated baryon collapse scenario (Granato et al., 2004; Lapi et al., 2006, 2011).
As is well known, the strongly negative K-correction emphasizes high- sources at (sub-)mm wavelengths. The data show that the steeply rising portion of the (sub-)mm counts is indeed dominated by ultra-luminous star-forming galaxies with a redshift distribution peaking at (Chapman et al., 2005; Aretxaga et al., 2007; Yun et al., 2012; Smolčić et al., 2012). As shown by Lapi et al. (2011), the self-regulated baryon collapse scenario provides a good fit of the (sub-)mm data (counts, redshift-dependent luminosity functions) as well as of the stellar mass functions at different redshifts. Moreover, the counts of strongly lensed galaxies were predicted with remarkable accuracy (Negrello et al., 2007, 2010; Lapi et al., 2012; González-Nuevo et al., 2012). Further considering that this scenario accounts for the clustering properties of sub-mm galaxies (Xia et al., 2012), we conclude that it is well grounded, and we adopt it for the present analysis. However, we upgrade this model in two respects. First, while, on one side, the model envisages a co-evolution of spheroidal galaxies and active nuclei at their centers, the emissions of the two components have been, so far, treated independently of each other. This is not a problem in the wavelength ranges where one of the two components dominates, as in the (sub-)mm region where the emission is dominated by star-formation, but is no longer adequate at mid-IR wavelengths, where the AGN contribution may be substantial. In this paper we present and exploit a consistent treatment of proto-spheroidal galaxies including both components. Second, while the steeply rising portion of (sub-)mm counts is fully accounted for by proto-spheroidal galaxies, late-type (normal and starburst) galaxies dominate both at brighter and fainter flux densities and over broad flux density ranges at mid-IR wavelengths. At these wavelengths, AGNs not associated to proto-spheroidal galaxies but either to evolved early type galaxies or to late-type galaxies are also important. Since we do not have a physical evolutionary model for late-type galaxies and the associated AGNs, these source populations have been dealt with adopting a phenomenological approach.
Another distinctive feature of the present model is that we have attempted to fit simultaneously the data over a broad wavelength range, from mid-IR to mm waves. As mentioned in several papers, this faces us with several challenges. First, the data come from different instruments and the relative calibration is sometimes problematic (see the discussion in Béthermin et al., 2011). Systematic calibration offsets may hinder simultaneous fits of different data sets. For example, Marsden et al. (2011) pointed out that there is considerable tension between the SCUBA m counts and the AzTEC counts at 1.1 mm, and indeed the m and mm-wave counts have been repeatedly corrected (generally downwards) as biases were discovered and better data were acquired. Also, the very complex SEDs in the mid-IR, where strong polycyclic aromatic hydrocarbon (PAH) emission features show up, make the counts exceedingly sensitive to the details of the spectral response function of the specific instrument and introduce large uncertainties in the conversion from broad-band measurements to monochromatic flux densities giving rise to strong discrepancies among data sets nominally referring to the same wavelength. In fact, large discrepancies are present among different determinations of m and m source counts.
The plan of the work is the following. In Section 2 we describe the physical model for the evolution of proto-spheroidal galaxies and of the associated AGNs and the SEDs adopted for these sources. Section 3 deals with the evolutionary model for late-type galaxies and AGNs. In Section 4 we present the formalism to compute the source counts of unlensed and lensed sources, the cumulative flux density as a function of redshift and the contributions to the CIB. In Section 5 we report on the determination of the best fit values of the model parameters. In Section 6 the model results are compared with data on multi-frequency luminosity functions at various redshifts and on source counts, both total and per redshift slices. The multi-frequency power-spectra of CIB fluctuations implied by the model are discussed in Section 7. Finally, Section 8 contains a summary of the paper and our main conclusions.
Tabulations of multi-frequency model counts, redshift distributions, SEDs, redshift-dependent luminosity functions at several wavelengths, and a large set of figures comparing model predictions with the data are available in the Web site http://people.sissa.it/zcai/galaxy_agn/.
Throughout this paper we adopt a flat cosmology with present day matter and baryon density, in units of the critical density, and ; Hubble constant ; spectrum of primordial density perturbations with slope and normalization on a scale of Mpc .
2 Star-forming proto-spheroidal galaxies
2.1 Overview of the model
We adopt the model by Granato et al. (2004, see also Lapi et al. 2006, 2011; Mao et al. 2007) that interprets powerful high- sub-mm galaxies as massive proto-spheroidal galaxies in the process of forming most of their stellar mass. It hinges upon high resolution numerical simulations showing that dark matter halos form in two stages (Zhao et al., 2003; Wang et al., 2011; Lapi & Cavaliere, 2011). An early fast collapse of the halo bulk, including a few major merger events, reshuffles the gravitational potential and causes the dark matter and stellar components to undergo (incomplete) dynamical relaxation. A slow growth of the halo outskirts in the form of many minor mergers and diffuse accretion follows; this second stage has little effect on the inner potential well where the visible galaxy resides.
The star formation is triggered by the fast collapse/merger phase of the halo and is controlled by self-regulated baryonic processes. It is driven by the rapid cooling of the gas within a region with radius of the halo virial radius, i.e. of kpc, where is the halo mass and is the virialization redshift, encompassing about of the total mass (dark matter plus baryons). The star formation and the growth of the central black-hole are regulated by the energy feedback from supernovae (SNe) and from the active nucleus, is very soon obscured by dust and is stopped by quasar feedback. The AGN feedback is relevant especially in the most massive galaxies and is responsible for their shorter duration (yr) of the active star-forming phase. In less massive proto-spheroidal galaxies the star formation rate is mostly regulated by SN feedback and continues for a few Gyr. Only a minor fraction of the gas initially associated to the dark matter halo is converted into stars. The rest is ejected by feedback processes.
The equations governing the evolution of the baryonic matter in dark matter halos and the adopted values for the parameters are given in the Appendix where some examples of the evolution with galactic age (from the virialization time) of quantities related to the stellar and to the AGN component are also shown. For additional details and estimates of physically plausible ranges for each parameter we refer to Granato et al. (2004), Lapi et al. (2006) and Mao et al. (2007). Since spheroidal galaxies are observed to be in passive evolution at (e.g. Renzini, 2006), they are bright at sub-mm wavelengths only at higher redshifts.
2.2 Luminosity functions
The bolometric luminosity function (LF) of proto-spheroids is obtained convolving the halo formation rate with the galaxy luminosity distribution, . The halo formation rate is well approximated, for , by the positive term of the cosmic time derivative of the halo mass function . For the latter, giving the average comoving number density of haloes of given mass, , we adopt the Sheth & Tormen (1999) analytical expression
| (1) |
where is the present day mean comoving matter density of the universe and , with . The critical value of the initial overdensity that is required for spherical collapse at , , is with (Nakamura & Suto, 1997)
The linear growth factor can be approximated as (Lahav et al., 1991; Carroll et al., 1992)
The mass variance of the primordial perturbation field smoothed on a scale containing a mass with a top-hat window function was computed using the Bardeen et al. (1986) power spectrum with correction for baryons (Sugiyama, 1995), for our choice of cosmological parameters (see Section 1). The results are accurately approximated (error over a broad range of , ) by
| (2) | |||||
where . Furthermore
where .
The halo formation rate is then
| (3) |
where with .
The comoving differential luminosity function , i.e. the number density of galaxies per unit interval at redshift , is given by
| (4) | |||||
where is the luminosity distribution of galaxies at redshift inside a halo of mass virialized at redshift . We set and .
As mentioned in Section 2.1 the total luminosity of a galaxy is the sum of those of the stellar component and of the active nucleus. For each component we assume a log-normal luminosity distribution
| (5) |
with dispersion around the mean stellar luminosity and around the mean AGN luminosity . The mean luminosities are computed solving the equations detailed in the Appendix. The higher luminosity dispersion for the AGN component reflects its less direct relationship, compared to the stellar component, with and . The distribution of the total luminosity, , is then (Dufresne, 2004)
| (6) |
In the upper left panel of Fig. 1 we show, as an example, the bolometric luminosity functions at of the stellar and of the AGN components, as well as the luminosity function of the objects as a whole. As shown by eq. (2.2) the latter is different from the sum of the first two, although in this case the difference is difficult to perceive. The bright end is dominated by QSOs shining unobstructed after having swept away the interstellar medium of the host galaxy. In this phase the QSOs reach their maximum luminosity. Around the AGNs and the starbursts give similar contributions to the bolometric luminosity function. The inflection at corresponds to the transition from the regime where the feedback is dominated by supernovae (lower halo masses) to the regime where it is dominated by AGNs. While the star formation in massive halos is abruptly stopped by the AGN feedback after 0.5–Gyr, it lasts much longer in smaller galaxies, implying a fast increase of their number density.
The upper right panel of the same figure illustrates the evolution with cosmic time of the global luminosity function. The cooling and free-fall timescales shorten with increasing redshift because of the increase of the matter density and this drives a positive luminosity evolution, thwarted by the decrease in the comoving density of massive halos. The two competing factors result, for both the starburst and the AGN component (see the lower panels of the figure), in a positive evolution up to followed by a decline at higher , consistent with the observational determinations by Gruppioni et al. (2010) and Lapi et al. (2011) for the starburst component and by Assef et al. (2011) and Brown et al. (2006) for AGNs. The decrease of the luminosity function at low luminosities, more clearly visible at the higher redshifts, is an artifact due to the adopted lower limit for the considered halo masses. This part of the luminosity function however does not contribute significantly to the observed statistics and therefore is essentially irrelevant here. Below the minimum virialization redshift, , the bolometric luminosity function of proto-spheroidal galaxies rapidly declines as they evolve towards the ‘passive’ phase. The decline is faster at the bright end (above ) since the switching off of the star formation for the more massive halos occurs on a shorter timescale.
The monochromatic luminosity functions of each component or of objects as a whole can obviously be computed using the same formalism, given the respective spectral energy distributions (SEDs). We define , , and , where is the normalized SED ().
Since the model cannot follow in detail the evolution of the AGN SEDs during the short phase when they shine unobstructed by the interstellar medium of the host galaxy, the distinction between obscured and unobscured AGNs in the model is made in two ways. First, following Lapi et al. (2006), we choose a fixed optical (B-band) “visibility time”, yr, consistent with current estimates of the optically bright QSO phase. Alternatively, we set the beginning of the optical bright phase at the moment when the gas mass fraction is low enough to yield a low optical depth. We estimate that this corresponds to a gas fraction within the dark matter potential well . The two approaches give very similar results and we have chosen the criterion to compute the luminosity functions at optical wavelengths.
2.3 Spectral energy distributions
Although there is evidence that the galaxy SEDs vary with luminosity (e.g. Smith et al., 2012), Lapi et al. (2011) have shown that the sub-mm data can be accurately reproduced using a single SED for proto-spheroidal galaxies, i.e. the SED of the strongly lensed galaxy SMM J2135-0102 (Swinbank et al., 2010; Ivison et al., 2010), modeled using GRASIL (Silva et al., 1998). The basic reason for the higher uniformity of the SEDs of high- active star-forming galaxies compared to galaxies at low- is that the far-IR emission of the former objects comes almost entirely from dust in molecular clouds, heated by newly formed stars, while in low- galaxies there are important additional contributions from colder ‘cirrus’ heated by older stellar populations.
This SED worked very well at sub-mm wavelengths but yielded mm-wave counts in excess of the observed ones. To overcome this problem the sub-mm slope of the SED has been made somewhat steeper, preserving the consistency with the photometric data on SMM J2135-0102 (see Fig. 2). Moreover, the SED used by Lapi et al. has a ratio between the total (8–m) IR and the m luminosity () of , far higher than the mean value for galaxies (, Reddy et al., 2012). We have therefore modified the near- and mid-IR portions of the SED adopting a shape similar to that of Arp 220. The contribution of the passive evolution phase of early-type galaxies is small in the frequency range of interest here and will be neglected.
As mentioned in Section 2.1, the model follows the AGN evolution through two phases (a third phase, reactivation, will be considered in Section 3.2). For the first phase, when the black-hole growth is enshrouded by the abundant, dusty interstellar medium (ISM) of the host galaxy, we adopt the SED of a heavily absorbed AGN taken from the AGN SED library by Granato & Danese (1994). Note that these objects differ from the classical type-2 AGNs because they are not obscured by a circum-nuclear torus but by the more widely distributed dust in the host galaxy. They will be referred to as type-3 AGNs. In the second phase the AGN shines after having swept out the galaxy ISM. For this phase we adopted the mean QSO SED by Richards et al. (2006) extended to sub-mm wavelengths assuming a grey-body emission with dust temperature and emissivity index . These SEDs imply that the IR (8–m) band comprises 92% of the bolometric luminosity of obscured AGNs and 19% of that of the unobscured ones. As illustrated by Fig. 2, except in the rare cases in which the AGN bolometric luminosity is much larger than that of the starburst, the AGN contribution is small at (sub-)mm wavelengths, while it is important and may be dominant, in the mid-IR. This implies that the statistics discussed here are insensitive to the parameters describing the extrapolation of the Richards et al. SED to (sub-)mm wavelengths.
Figure 3 shows the global SEDs and the contributions of the stellar and AGN components for 2 galaxy ages and three host halo masses virialized at . The shorter evolution timescale of the AGNs is clearly visible. It is worth noticing that the effect of feedback as a function of halo mass on the SFR is very different from that on accretion onto the supermassive black-hole. In the less massive halos the AGN feedback has only a moderate effect on the evolution of the SFR and of the accretion rate, that are mostly controlled by the SN feedback. With reference to the figure, for , the star-formation continues at an almost constant rate for a few Gyrs. On the other hand the accretion rate onto the central black-hole is at the Eddington limit only up to an age of Gyr and afterwards drops to a strongly sub-Eddington regime. This is because the growth rate of the reservoir is approximately proportional to the SFR (and therefore slowly varying for few Gyrs) while the accretion rate grows exponentially until the mass contained in the reservoir is exhausted. From this moment on the accretion rate is essentially equal to the (strongly sub-Eddington) inflow rate. For more massive halos the quenching of both the SFR and of the accretion occurs more or less simultaneously at ages of –0.6 Gyr, but while the SFR stops very rapidly, the AGN activity continues until the flow of the matter accumulated in the reservoir runs out. At ages Gyr the more massive galaxies are in passive evolution and therefore very weak in the far-IR while star-formation and the dust emission are still present in lower-mass galaxies.
3 Low redshift () populations
3.1 Late-type and starburst galaxies
We consider two galaxy populations: “warm” starburst galaxies and “cold” (normal) late-type galaxies. For the IR luminosity function of both populations we adopt the functional form advocated by Saunders et al. (1990):
| (7) |
where the characteristic density and luminosity , the low-luminosity slope and the dispersion of each population are, in principle, free parameters. However, the low-luminosity portion of the luminosity function is dominated by “cold” late-type galaxies and, as a consequence, the value of of the warm population is largely unconstrained; we have fixed it at . In turn, the “warm” population dominates at high luminosities so that the data only imply an upper limit to . We have set .
For the “warm” population we have assumed power law density and luminosity evolution [; ] up to , and being free parameters. The “cold” population comprises normal disc galaxies for which chemo/spectrophotometric evolution models (Mazzei et al., 1992; Colavitti et al., 2008) indicate a mild (a factor from to ) increase in the star formation rate, hence of IR luminosity, with look-back time. Based on these results we take, for this population, and no density evolution. At both and are kept to the values at multiplied by the smooth cut-off function , with and . The choice of the redshift cutoff for both populations of late-type galaxies is motivated by the fact that the disc component of spirals and the irregular galaxies are characterized by relatively young stellar populations (formation redshift –1.5). Above proto-spheroidal galaxies (including bulges of disk galaxies) dominate the contribution to the luminosity function, at least in the observationally constrained luminosity range. The other parameters are determined by minimum fits to selected data sets, as described in Sect. 5. Their best fit values and the associated uncertainties are listed in Table 1.
Although there is clear evidence of systematic variations of the IR SEDs of low- galaxies with luminosity (e.g., Smith et al., 2012), we tried to fit the data with just 2 SEDs, one for the “warm” and one for the “cold” population. These SEDs were generated by combining those of Dale & Helou (2002), that are best determined at mid-IR wavelengths, with those of Smith et al. (2012), primarily based on Herschel data in the range 100-500 m. Dale & Helou (2002) give SED templates for several values of the 60 to 100 m flux density ratio, . Using the relation between this ratio and the 3 to 1100 m luminosity, , given by Chapman et al. (2003) we established a correspondence between their SEDs and those by Smith et al., labeled by the values of . The combined SEDs are based on Smith et al. above m and on Dale & Helou at shorter wavelengths. By trial and error we found that the best fit to the data is obtained using for the “cold” population the SED corresponding to (actually the SEDs change very slightly for ) and for the “warm” population the SED corresponding to . These 2 SEDs are displayed in Fig. 4.
3.2 Reactivated AGNs
In the framework of our reference galaxy and AGN evolutionary scenario, most of the growth of super-massive black holes is associated to the star forming phase of spheroidal components of galaxies at when the great abundance of interstellar medium favours high accretion rates, at, or even slightly above, the Eddington limit. At later cosmic times the nuclei can be reactivated by, e.g., interactions, mergers or dynamical instabilities. The accretion rates are generally strongly sub-Eddington. Our evolutionary scenario cannot predict their amplitudes and duty cycles. We therefore adopted, also for these objects, a phenomenological backward evolution model analogous to that used for the “warm” galaxy population, i.e. luminosity functions of the same form of eq. (7) and power-law density and luminosity evolution with the same break and cutoff redshifts. However the parameters of the luminosity functions refer to m (see Sect. 3.1 and Table 1). The data do not allow a determination of the slopes, , of the faint portions of the luminosity functions. We have set for type-1 AGNs and for type-2. The steeper slope for type-2 was chosen on account of the fact that these dominate over type-1 at low luminosities. As in the case of normal late-type and of starburst galaxies, the other parameters are obtained by minimum fits, as detailed in Sect. 5, and the best fit values are listed, with their uncertainties, in Table 1. For type-2 AGNs pure density evolution was found to be sufficient to account for the data.
For type-1 AGNs we adopted the mean QSO SED by Richards et al. (2006), extended to mm wavelengths as described in Sect. 2.3, while for type-2 AGNs we adopted the SED of the local AGN dominated ULIRG Mrk 231, taken from the SWIRE library (Polletta et al., 2007). These SEDs are shown in Fig. 5 where the SED of type-3 AGNs associated to dusty star-forming proto-spheroidal galaxies is also plotted for comparison. The SED of type-3 AGNs is the most obscured at optical/near-IR wavelengths due to the effect of the dense, dusty interstellar medium of the high- host galaxies. This means that the counts at optical/near-IR wavelengths are dominated by type-1 AGNs with type-2 AGNs becoming increasingly important in the mid-IR. The 3 AGN populations have approximately the same ratio between the rest-frame m and the bolometric luminosity, as first pointed out by Spinoglio & Malkan (1989).
The type-1/type-2 space density ratio yielded by the model increases with luminosity, consistent with observations (e.g, Burlon et al., 2011) and with the receding torus model (Lawrence, 1991). In the framework of the standard unified model of AGNs type-1 and type-2 AGNs differ only in terms of the angle which the observer s line of sight makes with the axis of a dusty torus. If the line of sight to the central region is blocked by the torus, the AGN is seen as a type-2. According to the receding torus model the opening angle of the torus (measured from the torus axis to the equatorial plane) is larger in more luminous objects, implying that obscuration is less common in more luminous AGNs. Since our model implies that type-1 AGNs (but not type-2’s) are evolving in luminosity, they become increasingly dominant with increasing redshift.
4 Source counts and contributions to the background
The surface density of sources per unit flux density and redshift interval is
| (8) |
where ,
| (9) |
the comoving volume per unit solid angle is
| (10) |
and the luminosity distance and the angular diameter distance are related, in a flat universe, by
| (11) |
The differential number counts, i.e., the number of galaxies with flux density in the interval at an observed frequency per unit solid angle, are then
| (12) |
The integral number counts, i.e., the number of galaxies with flux density at frequency per unit solid angle, are given by
| (13) |
where and is the monochromatic luminosity of a source at the redshift observed to have a flux density . Counts (per steradian) dominated by local objects () can be approximated as
| (14) |
The redshift distribution, i.e. the surface density of sources with observed flux densities greater than a chosen limit per unit redshift interval, is
| (15) |
The steepness of the (sub-)mm counts of proto-spheroidal galaxies and their substantial redshifts imply that their counts are strongly affected by the magnification bias due to gravitational lensing (Blain, 1996; Perrotta et al., 2002, 2003; Negrello et al., 2007):
| (16) |
where is the amplification distribution that describes the probability for a source at redshift to be amplified by factor . Here we have approximated to unity the factor that would have appeared on the right-hand side, as appropriate for large-area surveys (see Jain & Lima, 2011).
We have computed using the SISSA model worked out by Lapi et al. (2012). The differential counts including the effect of lensing can be computed integrating eq. (16) over . The effect of lensing on counts of other source populations and on proto-spheroidal counts at shorter wavelengths is small and will be neglected in the following.
Interesting constraints on the halo masses of proto-spheroidal galaxies come from the auto- and cross-correlation functions of intensity fluctuations. A key quantity in this respect is the flux function, , i.e. the redshift distribution of the cumulative flux density of sources below the detection limit
| (17) |
The contribution of a source population to the extragalactic background at the frequency is
| (18) |
5 Determination of the best fit values of the parameters
A minimum approach for estimating the optimum values of the parameters of the physical model for proto-spheroidal galaxies and associated AGNs is unfeasible because of the lengthy calculations required. Some small adjustments compared to earlier versions (Granato et al., 2004; Lapi et al., 2006; Mao et al., 2007) were made, by trial and error, to improve the agreement with observational estimates of luminosity functions at . An outline of the model, including the definition of the relevant parameters, is presented in Appendix A. The chosen values are listed in Table 2. Discussions of physically plausible ranges can be found in Granato et al. (2004), Cirasuolo et al. (2005), Lapi et al. (2006), Shankar et al. (2006), Cook, Lapi, & Granato (2009) and Fan et al. (2010).
On the contrary, the minimum approach was applied to late-type/starburst galaxies and to reactivated AGNs. The minimization was performed using the routine MPFIT111http://purl.com/net/mpfit exploiting the Levenberg-Marquardt least-squares method (Moré, 1978; Markwardt, 2009).
The huge amount of observational data in the frequency range of interest here and the large number of parameters coming into play forced us to deal with subsets of parameters at a time using specific data for each subset. The parameters of the evolving AGN luminosity functions were obtained using:
-
•
the B-band local QSO luminosity function of Hartwick & Schade (1990),
-
•
the g-band QSO luminosity functions at and of Croom et al. (2009),
-
•
the , 1.24 m AGN luminosity functions of Assef et al. (2011),
-
•
the bright end [] of the local 60 m luminosity function of Takeuchi et al. (2003),
-
•
the Spitzer AGN counts at 8 and m of Treister et al. (2006).
The B- and g-band luminosity functions were used to constrain the parameters of type-1 AGNs (type-2 being important only at the low luminosity end) while the 1.24 m luminosity functions were regarded as made by a combination of type-1 and type-2 AGNs, the latter being dominant at low luminosities.
As for the evolving luminosity functions of “warm” and “cold” galaxy populations we used the following data sets:
-
•
the IRAS m local luminosity function of Soifer & Neugebauer (1991),
-
•
the Planck 350, 550, and m local luminosity functions of Negrello et al. (2012),
-
•
the Spitzer MIPS counts at 24, 70, and m of Béthermin et al. (2010),
-
•
the Herschel PACS counts at m of Berta et al. (2011),
-
•
the Herschel SPIRE counts at 250, 350, and m (Béthermin et al., 2012b).
The fits of the counts were made after having subtracted the contributions of proto-spheroidal galaxies, which are only important at wavelengths m. The best-fit values of the parameters are listed in Table 1, where values without errors denote parameters that were kept fixed, as mentioned in Sect. 3.
In comparing model results with observational data the instrumental spectral responses were taken into account. This is especially important in the mid-IR because of the complexity of the SEDs due to PAH emission lines. The monochromatic luminosity at the effective frequency in the observer’s frame is given by:
| (19) |
where is spectral response function and the integration is carried out over the instrumental band-pass. When the model is compared with luminosity function data at frequency (in the source frame) coming from different instruments for sources at redshift we use the response function of the instrument for which is closest to . In the case of source counts we use the response function appropriate for the most accurate data.
6 Results
6.1 Model versus observed luminosity functions and redshift distributions
The most direct predictions of the physical model for proto-spheroidal galaxies are the redshift-dependent SFRs and accretion rates onto the super-massive black-holes as a function of halo mass. During the dust enshrouded evolutionary phase the SFRs can be immediately translated into the IR (8–m) luminosity functions of galaxies. As mentioned above, according to our model, the transition from the dust-obscured to the passive evolution phase is almost instantaneous and we neglect the contribution of passive galaxies to the IR luminosity functions. In turn, the accretion rates translate into bolometric luminosities of AGNs given the mass-to-light conversion efficiency for which we adopt the standard value . The SEDs then allow us to compute the galaxy and AGN luminosity functions at any wavelength.
In contrast, the phenomenological model for late-type/starburst galaxies yields directly the redshift-dependent IR luminosity functions and that for reactivated AGNs yields the m luminosity functions. Again these can be translated to any wavelength using the SEDs described in the previous sections.
In Fig. 6 the model IR luminosity functions are compared with observation-based determinations at different redshifts. At the dominant contributions come from the stellar and AGN components of proto-spheroidal galaxies. These contributions fade at lower redshifts and essentially disappear at . The model implies that AGNs associated to proto-spheroidal galaxies are important only at luminosities higher than those covered by the Lapi et al. (2011) luminosity functions which therefore have been converted to bolometric luminosity functions using their galaxy SED, i.e. neglecting the AGN contribution, so that and . At “warm” and “cold” star forming galaxies take over, “cold” galaxies being important only at low luminosities. Type-2 AGNs (long-dashed pink lines) may dominate at the highest IR luminosities while type-1 AGNs (long-dashed light-blue lines) are always sub-dominant (in the IR).
The scale on the top -axis in Fig. 6 gives the star formation rates corresponding to the IR luminosities
| (20) |
and is therefore meaningful only to the extent that the AGN contribution is negligible. Moreover, the normalization constant applies to high- proto-spheroidal galaxies whose IR luminosity comes almost entirely from star-forming regions. For more evolved galaxies older stellar populations can contribute significantly to the dust heating (da Cunha et al., 2012); therefore is no longer a direct measure of the star formation rate and therefore the upper scale has to be taken as purely indicative.
Observational determinations of luminosity functions are available in many wave bands and for many cosmic epochs. The comparison between the model and the observed g-band (m) AGN luminosity functions at several redshifts is presented in Fig. 7, while the comparison in the J-band (m) is shown in Fig. 8. The conversion from monochromatic absolute AB magnitude to the corresponding monochromatic luminosity is given by . The contribution of type-2 AGNs at strongly increases from the g- to the J-band. Apart from the low-luminosity portion of the J-band luminosity function, very likely affected by incompleteness, the agreement between the model and the data is remarkably good.
The comparisons between the global (stellar plus AGN components) luminosity functions yielded by the model and those observationally determined at several redshifts and wavelengths are shown in Figs. 9–11. In Fig. 12 we compare model and observed redshift distributions at various wavelengths and flux density limits. The comparisons for all the other wavelengths for which estimates of the luminosity function are available can be found in the Web site http://people.sissa.it/zcai/galaxy_agn/.
Note that a substantial fraction of sources have only photometric redshifts. For example, the fraction of photometric redshifts is 91% for the VVDS-SWIRE survey with mJy (Rodighiero et al., 2010), 67.5% for the GOODS-N and 36% for the GOODS-S samples with mJy (Rodighiero et al., 2010). Only few sources at have spectroscopic redshifts (Berta et al., 2011). Note that photometric redshift errors tend to moderate the decline of the distributions at high-. The effect is analogous to the Eddington bias on source counts: errors move more objects from the more populated lower bins to the less populated higher bins than in the other way. Thus the observed distributions may be overestimated at the highest redshifts. In addition, optical identifications are not always complete. On the whole, observational estimates of luminosity functions and of redshift distributions may be affected by systematic effects difficult to quantify and the true uncertainties may be larger than the nominal values.
6.2 Model versus observed source counts and contributions to the CIB
Model and observed source counts at wavelengths from m to 1.38 mm are compared in Fig. 13. At wavelengths m, where, in the present framework, proto-spheroidal galaxies are most important, the model provides a simple physical explanation of the steeply rising portion of the counts, that proved to be very hard to account for by other both physical (Hayward et al., 2012; Niemi et al., 2012; Lacey et al., 2010) and phenomenological (e.g. Béthermin et al., 2012a; Gruppioni et al., 2011) models.
In our model the sudden steepening of the (sub-)mm counts is due to the appearance of proto-spheroidal galaxies that show up primarily at , being mostly in passive evolution at lower redshifts. Their counts are extremely steep because, due to the strongly negative K-correction, the sub-mm flux densities corresponding to a given luminosity are only weakly dependent on the source redshift. Then, since the far-IR luminosity is roughly proportional to the halo mass, the counts reflect the high- luminosity function whose bright end reflects, to some extent, the exponential decline of halo mass function at high masses. This situation results in a very strong magnification bias due to gravitational lensing (Blain, 1996; Perrotta et al., 2002, 2003; Negrello et al., 2007). The counts of strongly lensed galaxies depend on the redshift distribution of the unlensed ones. Thus, the good agreement between the model and the observed counts of strongly lensed galaxies (see the m, m and m panels of Fig. 13) indicates that the model passes this test on the redshift distribution.
Low- “warm” and “cold” star-forming galaxy populations become increasingly important with decreasing wavelength. At m proto-spheroidal galaxies yield only a minor contribution to the counts. The AGN (mostly type-2) contribution implied by the model is always sub-dominant. We find a maximum contribution in the mid-IR. At m it is up to 1 mJy and then rapidly increases up to above 10 mJy while at m it is – up to 0.5 mJy and increases up to above 2 mJy, in fair agreement with the observational estimates (Treister et al., 2006; Teplitz et al., 2011).
Another test on the redshift distribution is provided by the estimated counts in different redshift slices (Fig. 14), although we caution that the true uncertainties may be larger than the nominal ones since the observational estimates are partly based on photometric redshifts and on stacking. The consistency between the model and the data is reasonably good.
Figure 15 shows the contributions of the different populations to the cosmic infrared background (CIB). The model accounts for the full CIB intensity over the whole wavelength range. Only at m other galaxy populations, such as passively evolving galaxies, become important. According to the model, for m the main contribution to the CIB comes from proto-spheroidal galaxies and the fraction contributed by these objects increases with increasing wavelengths. Below m lower “warm” galaxies take over, with “cold” galaxies adding a minor contribution. AGNs are always sub-dominant. The model gives a total (type-1 type-2 type-3) AGN contribution of 8.6% at m and of 8.1% at m. For comparison, Teplitz et al. (2011) estimate a contribution of at m; Treister et al. (2006) and Ballantyne & Papovich (2007) find a contribution of at m. It must be noted that these observational estimates are endowed with substantial uncertainties: on one side they may be too low because strongly obscured AGNs may be missed, on the other side they may be too high because a significant fraction of the observed emission may come from the host galaxy.
7 Clustering properties of dusty galaxies and power spectra of the cosmic infrared background
An important test of our physical model for the evolution of dusty proto-spheroidal galaxies is provided by their clustering properties that are informative on their halo masses. A specific prediction of our model is that proto-spheroidal galaxies are the main contributors to the CIB at (sub-)mm wavelengths with “warm” starburst galaxies becoming increasingly important with decreasing wavelength. Since, in our model, proto-spheroidal galaxies are much more strongly clustered than starburst galaxies, the variation in the mixture with wavelength translates in quantitative predictions on the frequency dependence of the amplitude of the CIB power spectra and on the level of correlations among the maps at different frequencies.
We have updated the analysis by Xia et al. (2012) taking into account the new auto- and cross-frequency power spectra obtained by Viero et al. (2012) from Herschel/SPIRE measurements and the power spectrum at m derived by Pénin et al. (2012). The latter authors actually give also an estimate of the power spectrum at m. However the amplitude of the latter is anomalously large. As an example, for the wave-number we find that the amplitude normalized to the CIB intensity
| (21) |
[eq. (13) of Viero et al. (2012)] is –0.09 at 100, 250, 350 and m but jumps to at m. Since such a jump over a small wavelength range looks odd we decided not to use the m power spectrum.
All the relevant details on the formalism used are given by Xia et al. (2012). Briefly, the power spectrum of the galaxy distribution is parameterized as the sum of the 1-halo term, that dominates on small scales and depends on the distribution of galaxies within the same halo, and the 2-halo term, that dominates on large scales and is related to correlations among different halos. The Halo Occupation Distribution (HOD), which is a statistical description of how dark matter halos are populated with galaxies, is modeled using a central-satellite formalism (see, e.g., Zheng et al., 2005). This assumes that the first galaxy to be hosted by a halo lies at its center, while any remaining galaxies are classified as satellites and are distributed in proportion to the halo mass profile. The mean halo occupation function of satellite galaxies is parameterized as: , where is the halo mass and the power-law index is a free parameter. The key parameter in the 2-halo term is the minimum halo mass, , that determines the amplitude of the effective bias function .
In the Xia et al. (2012) paper the only free parameters are the minimum halo mass, , and the power-law index of the mean occupation function of satellites, , of proto-spheroidal galaxies. This is because the contribution of late-type galaxies to the power spectra at m is always subdominant and therefore the parameters characterizing their clustering properties were poorly constrained. This is no longer true if we add the m power spectrum, which, however, still provides only weak constraints on . We therefore fixed that parameter to . The fits to the Herschel/SPIRE power spectra determined by Viero et al. (2012) give and ( errors), close to the values found by Xia et al. (2012). The m data do not constrain these parameters further but yield . The nominal errors on each parameter have been computed marginalizing on the other and correspond to . We caution that the true uncertainties are likely substantially higher than the nominal values, both because the model relies on simplifying assumptions that may make it too rigid and because of possible systematics affecting the data. Our value of implies an effective halo mass [eq. (17) of Xia et al. (2012)] at of proto-spheroidal galaxies, making up most of the CIB, . This value is close to the estimated halo mass of the most effective star formers in the universe. Tacconi et al. (2008) estimated their mean comoving density at to be . For the standard CDM cosmology this implies that they are hosted by dark matter halos of .
The best fit model power spectra are plotted in Fig. 16 where the 1- and 2-halo contributions of proto-spheroidal and late-type galaxies are also shown. The relative contribution of the latter galaxy population increases with decreasing wavelength and becomes dominant at m. This trend implies a decrease of the level of correlations among the maps with increasing separation in wavelength. As illustrated by Fig. 17 the model is in very good agreement with the cross-wavelength correlations measured by Viero et al. (2012) and defined by [eq. (14) of Viero et al. (2012)]
| (22) |
8 Summary and conclusions
Studies of galaxy properties as a function of morphological type (e.g. Bernardi et al., 2010) have highlighted a dichotomy between the luminosity-weighted ages of early- and late-type galaxies. The former are mostly older than 8 Gyr while most of S or later-type spirals are younger than Gyr, corresponding to a formation redshift –1.5. Building on this datum we have worked out a model whereby the proto-spheroidal galaxies, in the process of forming the bulk of their stars, are the dominant population in the IR at while late-type galaxies dominate at lower redshifts. The model is ‘hybrid’ in the sense that it combines a physical, forward model for spheroidal galaxies and the early evolution of the associated AGNs with a phenomenological backward model for late-type galaxies and for the later AGN evolution.
To describe the cosmological evolution of proto-spheroidal galaxies and of the associated AGNs we adopted the physical model by Granato et al. (2004), upgraded working out, for the first time, the epoch-dependent luminosity functions of sources as a whole (stellar plus AGN component), taking into account in a self-consistent way the variation with galactic age of the global SED. With only minor adjustments of the parameters the model accurately reproduces the observed luminosity functions at all redshifts () and IR wavelengths at which they have been determined. The model naturally accounts for the observed positive evolution of both galaxies and AGNs up to and for the negative evolution at higher redshifts. This is the result of the combination of two competing effects. On one side cooling and free-fall timescales shorten with increasing redshift because of the increase of the matter density and this yields higher star formation rates, i.e. higher galaxy luminosities at given halo mass. The higher gas densities are also responsible for a delay of the AGN switch-off time by feedback implying positive luminosity and density evolution of these objects. These effects are thwarted by the decrease in the comoving density of massive halos that prevails above causing a decline of the bolometric luminosity functions of both galaxies and AGNs.
The model also provides a simple physical explanation of the steeply rising portion of the (sub-)mm counts, that proved to be very hard to account for by other physical and phenomenological models. The sharp steepening is due to the sudden appearance of proto-spheroidal galaxies that do not have, in this spectral band, an evolutionary connection with nearby galaxies because their descendants are in passive evolution at . Their (sub-)mm counts are extremely steep because, due to the strongly negative K-correction, the flux densities corresponding to a given luminosity are only weakly dependent on the source redshift. Then, since the far-IR luminosity is roughly proportional to the halo mass, the counts reflect, to some extent, the exponential decline of halo mass function at high masses.
The steepness of the counts imply a strong magnification bias due to gravitational lensing. The counts of strongly lensed sources depend on the redshift distribution that determines the distribution of lensing optical depths. In fact, this model was the only one that correctly predicted (Negrello et al., 2007) the strongly lensed counts at m and the correct redshift distribution of bright (mJy) sub-mm sources (Negrello et al., 2010; González-Nuevo et al., 2012).
The epoch-dependent luminosity function of late-type galaxies has been modeled in terms of two populations, “warm” and “cold” galaxies with different SEDs and different evolution properties. Simple truncated power law models have been adopted for the evolution of these populations. “Cold” (normal) late-type galaxies evolve (weakly) only in luminosity, while “warm” (starburst) galaxies evolve both in luminosity and in density.
Below the far-IR emission of proto-spheroidal galaxies and the associated AGNs fade out rather rapidly. The AGNs, however, can be reactivated e.g. by interactions. This later phase of AGN emission has been described by a phenomenological model analogous to that used for late-type galaxies, distinguishing between type-1 and type-2 AGNs.
In this framework, there is a systematic variation with wavelength of the populations dominating the counts and the contributions to the extragalactic background intensity. Above m the main contributors to the CIB are proto-spheroidal galaxies. In this wavelength range late-type galaxies dominate the counts only at the brightest (where normal “cold” star-forming galaxies prevail) and at the faintest flux densities (where “warm” starburst galaxies outnumber the proto-spheroids). But these galaxies become increasingly important with decreasing wavelength. Proto-spheroids are always subdominant below m. This strong variation with wavelength in the composition of IR sources implies specific predictions for the auto- and cross-power spectra of the source distribution, that may help discriminating between different models. Essentially all the alternative models have all source populations present over the full relevant redshift range. This implies a high correlation between the CIB intensity fluctuations at different frequencies. On the contrary, the present model predicts a high (close to unity) cross-correlation only at the longest wavelengths (m). At shorter wavelengths the cross correlation progressively weakens and we expect little cross-correlation between CIB fluctuations at, say, 100 and m. No observational determination is available for correlations among these wavelengths, but in the Herschel/SPIRE wavelength range, where cross correlations have been measured, the model results are in good agreement with observations.
According to our model, the AGN contribution to the CIB is always sub-dominant. It is maximal in the mid-IR where it reaches 8.6% at m and 8.1% at m. These contributions are close to, but somewhat lower than most observation-based estimates which however are complicated by the difficulty of separating the AGN emission from that of the host galaxy. The AGN contribution to the counts is also always subdominant. We find a maximum contribution in the mid-IR where the model gives AGN fractions in fair agreement with the observational estimates (Treister et al., 2006; Teplitz et al., 2011).
Appendix A Self-regulated evolution of high- proto-spheroidal galaxies
The gas initially associated to a galactic halo of mass , with a cosmological mass fraction is heated to the virial temperature at the virialization redshift, . Its subsequent evolution partitions it in three phases: a hot diffuse medium with mass infalling and/or cooling toward the center; cold gas with mass condensing into stars; low-angular momentum gas with mass stored in a reservoir around the central super-massive black hole, and eventually viscously accreting onto it. In addition, two condensed phases appear and grow, namely, stars with a total mass and the black hole with mass . As mentioned in Section 2.1 we restrict ourselves to the ranges and .
The evolution of the three gas phases is governed by the following equations:
| (A1) | |||||
that link the mass infall rate, , the variation of the cold gas mass, , and the variation of the reservoir mass, , to the condensation rate of the cold gas, , to the star formation rate , to the cold gas removal by supernova and AGN feedback, and respectively, to the fraction of gas restituted to the cold component by the evolved stars, , to the inflow rate of cold gas into the reservoir around the central super-massive black hole, , and to the back hole accretion rate, .
The hot gas cools and flows toward the central region at a rate
| (A2) |
with and
| (A3) |
where the coefficient is 10% smaller than the value used by Fan et al. (2010). Note that the cooling and inflowing gas we are dealing with is the one already present within the halo at virialization. In this respect it is useful to keep in mind that the virial radius of halo (kpc) is more than 30 times larger than the size of the luminous galaxy, and that only a minor fraction of the gas within the halo condenses into stars. Indeed, we need strong feedback processes, capable of removing most of the halo gas, to avoid an over-production of stars. This implies that any gas infalling from outside the halo must also be swept out by feedback; it could however become important for the formation of a disc-like structure surrounding the preformed spheroid once it enters the passive evolution phase, with little feedback (Cook, Lapi, & Granato, 2009). As mentioned in Sect. 2.1, the additional material (stars, gas, dark matter) infalling after the fast collapse phase that creates the potential well, i.e. during the slow-accretion phase, mostly produces a growth of the halo outskirts, and has little effect on the inner part where the visible galaxy resides.
The star formation rate is given by
| (A4) |
where the star formation timescale is with . For a Chabrier (2003) IMF of the form with for and for we find under the instantaneous recycling approximation.
The gas mass loss due to the supernova feedback is
| (A5) |
with
| (A6) | |||||
We adopt the following values: number of SNe per unit solar mass of condensed stars ; fraction of the released energy used to heat the gas ; kinetic energy released per SN ; halo binding energy (Mo & Mao, 2004).
The infrared luminosity (8–m) associated to dust enshrouded star formation is
| (A7) |
where the coefficient depends on the SED. We adopt (Lapi et al., 2011; Kennicutt, 1998).
The cold gas inflow rate into the reservoir around the super-massive black hole, driven by radiation drag, is given by
| (A8) |
with
| (A9) |
For the strength of the radiation drag we adopt and set . The model also follows the evolution of the cold gas metallicity, . An approximate solution of the equations governing the chemical evolution is (Lapi et al., in preparation)
| (A10) |
where , the metallicity of the primordial infalling gas is , and the mass fraction of newly formed metals ejected from stars, is given by
| (A11) |
with , , Myr, and Myr for the Chabrier’s IMF (). Equation (A11) accounts for the fact that, soon after the onset of star formation, the metal yield, mainly contributed by stars with large masses () and short lifetimes (Myr), is a relatively large fraction of the initial stellar mass () while, as the star formation proceeds, it progressively lowers to as the main contribution shifts to stars with intermediate masses and lifetimes Myr, and finally saturates to values as stars with masses and long lifetimes ( Myr) take over (Bressan et al., 1998). The two parameters and depends mainly on the IMF.
The accretion rate into the central black hole obeys the equation
| (A12) |
where is the accretion rate allowed by the viscous dissipation of the angular momentum of the gas in the reservoir
| (A13) | |||||
with and , being the overdensity of a virialized halo at redshift within its virial radius . is the accretion rate corresponding to the Eddington luminosity given the mass to light conversion efficiency (we set so that the Salpeter time yr) and is the Eddington ratio that we assume to slightly increase with redshift for
| (A14) |
up to a maximum value . The growth rate of the black hole mass is
| (A15) |
starting from a seed mass . The bolometric AGN luminosity is
| (A16) |
A minor fraction of it couples with the interstellar medium of the host galaxy giving rise to an outflow at a rate
| (A17) |
with
| (A18) |
and
| (A19) |
is the mechanical AGN luminosity, used to unbind the gas. The coefficient quantifying the strength of the QSO feedback is chosen to be . The ratio of the mechanical to the total AGN luminosity
| (A20) |
is constrained to be in the range 0.006–0.15.
Examples of the resulting evolution with galactic age of properties of the stellar and of the AGN component are shown in Fig. 18 for three values of the virial mass and .
As mentioned in Sect. 5, to improve the fits of the data we have modified, by trial and error, the values of some model parameters used in previous papers, still within their plausible ranges (see Table 2). The impact of these parameters on the derived luminosity functions can be more easily understood with reference to the time lag between the halo virialization and the peak in black hole accretion rate, (Lapi et al., 2006). The duration of star formation is (see Fig. 18) due to the drastic effect of QSO feedback in massive halos which dominate the bright end of the luminosity functions. Note that longer (or ) imply higher bright tails of the luminosity functions. The final black hole mass increases with increasing the coefficient, , of the optical depth of gas clouds [eq. (A9)] because it implies a higher efficiency of the radiation drag driving the gas into the reservoir. There is a degeneracy, to some extent, between and the gas metallicity , implying that cannot be tightly constrained (see Granato et al., 2004). The value of grows substantially in response to a small increase of the radiative efficiency that yields a slower growth of the black hole mass and a weaker QSO feedback. Higher values of the Eddington ratio, , result in lower values of both and of the final black hole mass. A rise of at high- is required to account for the observed space density of very luminous QSOs (see the high- data in Fig. 7 and Fig. 8; Lapi et al., 2006). A higher QSO feedback efficiency (higher ) shortens the duration of star formation, , but has a minor effect on and on the final black hole mass. Finally, the coefficient relating the SFR to the IR luminosity, , varies with age mix of stellar populations, chemical composition and IMF. Increasing it we shift the luminosity functions towards higher luminosities.
References
- Altieri et al. (2010) Altieri, B., Berta, S., Lutz, D., et al. 2010, A&A, 518, L17
- Angulo et al. (2012) Angulo, R. E., Springel, V., White, S. D. M., et al. 2012, arXiv:1203.3216
- Aretxaga et al. (2007) Aretxaga, I., Hughes, D. H., Coppin, K., et al. 2007, MNRAS, 379, 1571
- Aretxaga et al. (2011) Aretxaga, I., Wilson, G. W., Aguilar, E., et al. 2011, MNRAS, 415, 3831
- Assef et al. (2011) Assef, R. J., Kochanek, C. S., Ashby, M. L. N., et al. 2011, ApJ, 728, 56
- Austermann et al. (2009) Austermann, J. E., Aretxaga, I., Hughes, D. H., et al. 2009, MNRAS, 393, 1573
- Austermann et al. (2010) Austermann, J. E., Dunlop, J. S., Perera, T. A., et al. 2010, MNRAS, 401, 160
- Ballantyne & Papovich (2007) Ballantyne, D. R., & Papovich, C. 2007, ApJ, 660, 988
- Bardeen et al. (1986) Bardeen, J. M., Bond, J. R., Kaiser, N., & Szalay, A. S. 1986, ApJ, 304, 15
- Baugh et al. (2005) Baugh, C. M., Lacey, C. G., Frenk, C. S., et al. 2005, MNRAS, 356, 1191
- Bernardi et al. (2010) Bernardi, M., Shankar, F., Hyde, J. B., et al. 2010, MNRAS, 404, 2087
- Berta et al. (2011) Berta, S., Magnelli, B., Nordon, R., et al. 2011, A&A, 532, A49
- Béthermin et al. (2012a) Béthermin, M., Daddi, E., Magdis, G., et al. 2012a, ApJ, 757, L23
- Béthermin et al. (2010) Béthermin, M., Dole, H., Beelen, A., & Aussel, H. 2010, A&A, 512, A78
- Béthermin et al. (2011) Béthermin, M., Dole, H., Lagache, G., Le Borgne, D., & Penin, A. 2011, A&A, 529, A4
- Béthermin et al. (2012b) Béthermin, M., Le Floc’h, E., Ilbert, O., et al. 2012b, A&A, 542, A58
- Blain (1996) Blain, A. W. 1996, MNRAS, 283, 1340
- Boylan-Kolchin et al. (2009) Boylan-Kolchin, M., Springel, V., White, S. D. M., Jenkins, A., & Lemson, G. 2009, MNRAS, 398, 1150
- Bressan et al. (1998) Bressan, A., Granato, G. L., & Silva, L. 1998, A&A, 332, 135
- Brown et al. (2006) Brown, M. J. I., Brand, K., Dey, A., et al. 2006, ApJ, 638, 88
- Burgarella et al. (2009) Burgarella, D., Buat, V., Takeuchi, T. T., Wada, T., & Pearson, C. 2009, PASJ, 61, 177
- Burlon et al. (2011) Burlon, D., Ajello, M., Greiner, J., et al. 2011, ApJ, 728, 58
- Caputi et al. (2007) Caputi, K. I., Lagache, G., Yan, L., et al. 2007, ApJ, 660, 97
- Carroll et al. (1992) Carroll, S. M., Press, W. H., & Turner, E. L. 1992, ARA&A, 30, 499
- Chabrier (2003) Chabrier, G. 2003, PASP, 115, 763
- Chapman et al. (2005) Chapman, S. C., Blain, A. W., Smail, I., & Ivison, R. J. 2005, ApJ, 622, 772
- Chapman et al. (2003) Chapman, S. C., Helou, G., Lewis, G. F., & Dale, D. A. 2003, ApJ, 588, 186
- Chen et al. (2011) Chen, C.-C., Cowie, L. L., Wang, W.-H., Barger, A. J., & Williams, J. P. 2011, ApJ, 733, 64
- Cirasuolo et al. (2005) Cirasuolo, M., Shankar, F., Granato, G. L., De Zotti, G., & Danese, L. 2005, ApJ, 629, 816
- Clements et al. (2011) Clements, D. L., Bendo, G., Pearson, C., et al. 2011, MNRAS, 411, 373
- Clements et al. (2010) Clements, D. L., Rigby, E., Maddox, S., et al. 2010, A&A, 518, L8
- Colavitti et al. (2008) Colavitti, E., Matteucci, F., & Murante, G. 2008, A&A, 483, 401
- Cook, Lapi, & Granato (2009) Cook, M., Lapi, A., & Granato, G. L. 2009, MNRAS, 397, 534
- Coppin et al. (2006) Coppin, K., Chapin, E. L., Mortier, A. M. J., et al. 2006, MNRAS, 372, 1621
- Croom et al. (2009) Croom, S. M., Richards, G. T., Shanks, T., et al. 2009, MNRAS, 399, 1755
- Croom et al. (2004) Croom, S. M., Smith, R. J., Boyle, B. J., et al. 2004, MNRAS, 349, 1397
- da Cunha et al. (2012) da Cunha, E., Charlot, S., Dunne, L., Smith, D., & Rowlands, K. 2012, IAU Symposium, 284, 292
- Dale & Helou (2002) Dale, D. A., & Helou, G. 2002, ApJ, 576, 159
- Dole et al. (2006) Dole, H., Lagache, G., Puget, J.-L., et al. 2006, A&A, 451, 417
- Dole et al. (2004) Dole, H., Le Floc’h, E., Pérez-González, P. G., et al. 2004, ApJS, 154, 87
- Dufresne (2004) Dufresne, D. 2004, Advances in Applied Probability, 36, 747
- Dunne et al. (2000) Dunne, L., Eales, S., Edmunds, M., et al. 2000, MNRAS, 315, 115
- Eales et al. (2010) Eales, S. A., Raymond, G., Roseboom, I. G., et al. 2010, A&A, 518, L23
- Elbaz et al. (2002) Elbaz, D., Cesarsky, C. J., Chanial, P., et al. 2002, A&A, 384, 848
- Elbaz et al. (1999) Elbaz, D., Cesarsky, C. J., Fadda, D., et al. 1999, A&A, 351, L37
- Fan et al. (2010) Fan, L., Lapi, A., Bressan, A., et al. 2010, ApJ, 718, 1460
- Fang et al. (1998) Fang, F., Shupe, D. L., Xu, C., & Hacking, P. B. 1998, ApJ, 500, 693
- Fontanot et al. (2009) Fontanot, F., Somerville, R. S., Silva, L., Monaco, P., & Skibba, R. 2009, MNRAS, 392, 553
- Franceschini et al. (2010) Franceschini, A., Rodighiero, G., Vaccari, M., et al. 2010, A&A, 517, A74
- Frayer et al. (2006) Frayer, D. T., Fadda, D., Yan, L., et al. 2006, AJ, 131, 250
- Fu et al. (2010) Fu, H., Yan, L., Scoville, N. Z., et al. 2010, ApJ, 722, 653
- Fukugita et al. (1996) Fukugita, M., Ichikawa, T., Gunn, J. E., et al. 1996, AJ, 111, 1748
- Glenn et al. (2010) Glenn, J., Conley, A., Béthermin, M., et al. 2010, MNRAS, 409, 109
- González-Nuevo et al. (2012) González-Nuevo, J., Lapi, A., Fleuren, S., et al. 2012, ApJ, 749, 65
- Granato & Danese (1994) Granato, G. L., & Danese, L. 1994, MNRAS, 268, 235
- Granato et al. (2004) Granato, G. L., De Zotti, G., Silva, L., Bressan, A., & Danese, L. 2004, ApJ, 600, 580
- Greve et al. (2012) Greve, T. R., Vieira, J. D., Weiß, A., et al. 2012, ApJ, 756, 101
- Greve et al. (2010) Greve, T. R., Wei, A., Walter, F., et al. 2010, ApJ, 719, 483
- Gruppioni et al. (2002) Gruppioni, C., Lari, C., Pozzi, F., et al. 2002, MNRAS, 335, 831
- Gruppioni et al. (2010) Gruppioni, C., Pozzi, F., Andreani, P., et al. 2010, A&A, 518, L27
- Gruppioni et al. (2011) Gruppioni, C., Pozzi, F., Zamorani, G., & Vignali, C. 2011, MNRAS, 416, 70
- Hartwick & Schade (1990) Hartwick, F. D. A., & Schade, D. 1990, ARA&A, 28, 437
- Hatsukade et al. (2011) Hatsukade, B., Kohno, K., Aretxaga, I., et al. 2011, MNRAS, 411, 102
- Hayward et al. (2012) Hayward, C. C., Narayanan, D., Kereš, D., et al. 2012, arXiv:1209.2413
- Hopwood et al. (2010) Hopwood, R., Serjeant, S., Negrello, M., et al. 2010, ApJ, 716, L45
- Ivison et al. (2010) Ivison, R. J., Swinbank, A. M., Swinyard, B., et al. 2010, A&A, 518, L35
- Jain & Lima (2011) Jain, B., & Lima, M. 2011, MNRAS, 411, 2113
- Johansson et al. (2011) Johansson, D., Sigurdarson, H., & Horellou, C. 2011, A&A, 527, A117
- Kaviani et al. (2003) Kaviani, A., Haehnelt, M. G., & Kauffmann, G. 2003, MNRAS, 340, 739
- Kennicutt (1998) Kennicutt, R. C., Jr. 1998, ARA&A, 36, 189
- Knudsen et al. (2008) Knudsen, K. K., van der Werf, P. P., & Kneib, J.-P. 2008, MNRAS, 384, 1611
- Kim et al. (2011) Kim, H.-S., Lacey, C. G., Cole, S., et al. 2011, arXiv:1111.0721
- Klypin et al. (2011) Klypin, A. A., Trujillo-Gomez, S., & Primack, J. 2011, ApJ, 740, 102
- Lacey et al. (2008) Lacey, C. G., Baugh, C. M., Frenk, C. S., et al. 2008, MNRAS, 385, 1155
- Lacey et al. (2010) Lacey, C. G., Baugh, C. M., Frenk, C. S., et al. 2010, MNRAS, 405, 2
- Lagache et al. (1999) Lagache, G., Abergel, A., Boulanger, F., Désert, F. X., & Puget, J.-L. 1999, A&A, 344, 322
- Lahav et al. (1991) Lahav, O., Lilje, P. B., Primack, J. R., & Rees, M. J. 1991, MNRAS, 251, 128
- Lapi & Cavaliere (2011) Lapi, A., & Cavaliere, A. 2011, ApJ, 743, 127
- Lapi et al. (2011) Lapi, A., González-Nuevo, J., Fan, L., et al. 2011, ApJ, 742, 24
- Lapi et al. (2012) Lapi, A., Negrello, M., González-Nuevo, J., et al. 2012, ApJ, 755, 46
- Lapi et al. (2006) Lapi, A., Shankar, F., Mao, J., et al. 2006, ApJ, 650, 42
- Lawrence (1991) Lawrence, A. 1991, MNRAS, 252, 586
- Le Borgne et al. (2009) Le Borgne, D., Elbaz, D., Ocvirk, P., & Pichon, C. 2009, A&A, 504, 727
- Le Floc’h et al. (2009) Le Floc’h, E., Aussel, H., Ilbert, O., et al. 2009, ApJ, 703, 222
- Le Floc’h et al. (2005) Le Floc’h, E., Papovich, C., Dole, H., et al. 2005, ApJ, 632, 169
- Magnelli et al. (2009) Magnelli, B., Elbaz, D., Chary, R. R., et al. 2009, A&A, 496, 57
- Magnelli et al. (2011) Magnelli, B., Elbaz, D., Chary, R. R., et al. 2011, A&A, 528, A35
- Mao et al. (2007) Mao, J., Lapi, A., Granato, G. L., de Zotti, G., & Danese, L. 2007, ApJ, 667, 655
- Markwardt (2009) Markwardt, C. B. 2009, Astronomical Data Analysis Software and Systems XVIII, 411, 251
- Marsden et al. (2009) Marsden, G., Ade, P. A. R., Bock, J. J., et al. 2009, ApJ, 707, 1729
- Marsden et al. (2011) Marsden, G., Chapin, E. L., Halpern, M., et al. 2011, MNRAS, 417, 1192
- Matute et al. (2006) Matute, I., La Franca, F., Pozzi, F., et al. 2006, A&A, 451, 443
- Mazzei et al. (2007) Mazzei, P., Della Valle, A., & Bettoni, D. 2007, A&A, 462, 21
- Mazzei et al. (1992) Mazzei, P., Xu, C., & de Zotti, G. 1992, A&A, 256, 45
- Miville-Deschênes et al. (2002) Miville-Deschênes, M.-A., Lagache, G., & Puget, J.-L. 2002, A&A, 393, 749
- Mo & Mao (2004) Mo, H. J., & Mao, S. 2004, MNRAS, 353, 829
- Moré (1978) Moré, J. 1978, in Numerical Analysis, vol. 630, ed. G. A. Watson (Springer-Verlag: Berlin), p. 105
- Nakamura & Suto (1997) Nakamura, T. T., & Suto, Y. 1997, Progress of Theoretical Physics, 97, 49
- Narayanan et al. (2010) Narayanan, D., Hayward, C. C., Cox, T. J., et al. 2010, MNRAS, 401, 1613
- Negrello et al. (2012) Negrello, M., Clemens, M., González-Nuevo, J., et al. 2012, in preparation
- Negrello et al. (2010) Negrello, M., Hopwood, R., De Zotti, G., et al. 2010, Science, 330, 800
- Negrello et al. (2007) Negrello, M., Perrotta, F., González-Nuevo, J., et al. 2007, MNRAS, 377, 1557
- Niemi et al. (2012) Niemi, S.-M., Somerville, R. S., Ferguson, H. C., et al. 2012, MNRAS, 421, 1539
- Noble et al. (2012) Noble, A. G., Webb, T. M. A., Ellingson, E., et al. 2012, MNRAS, 419, 1983
- Oliver et al. (2010) Oliver, S. J., Wang, L., Smith, A. J., et al. 2010, A&A, 518, L21
- Palanque-Delabrouille et al. (2012) Palanque-Delabrouille, N., Magneville, Ch., Yeche, Ch., et al. 2012, arXiv:1209.3968
- Papovich et al. (2004) Papovich, C., Dole, H., Egami, E., et al. 2004, ApJS, 154, 70
- Patanchon et al. (2009) Patanchon, G., Ade, P. A. R., Bock, J. J., et al. 2009, ApJ, 707, 1750
- Pearson et al. (2010) Pearson, C. P., Oyabu, S., Wada, T., et al. 2010, A&A, 514, A8
- Pei (1995) Pei, Y. C. 1995, ApJ, 438, 623
- Pénin et al. (2012) Pénin, A., Lagache, G., Noriega-Crespo, A., et al. 2012, A&A, 543, A123
- Perrotta et al. (2002) Perrotta, F., Baccigalupi, C., Bartelmann, M., De Zotti, G., & Granato, G. L. 2002, MNRAS, 329, 445
- Perrotta et al. (2003) Perrotta, F., Magliocchetti, M., Baccigalupi, C., et al. 2003, MNRAS, 338, 623
- Planck Collaboration (2012) Planck Collaboration 2012, arXiv:1207.4706
- Polletta et al. (2007) Polletta, M., Tajer, M., Maraschi, L., et al. 2007, ApJ, 663, 81
- Pozzi et al. (2004) Pozzi, F., Gruppioni, C., Oliver, S., et al. 2004, ApJ, 609, 122
- Rahmati & van der Werf (2011) Rahmati, A., & van der Werf, P. P. 2011, MNRAS, 418, 176
- Reddy et al. (2012) Reddy, N., Dickinson, M., Elbaz, D., et al. 2012, ApJ, 744, 154
- Renault et al. (2001) Renault, C., Barrau, A., Lagache, G., & Puget, J.-L. 2001, A&A, 371, 771
- Renzini (2006) Renzini, A. 2006, ARA&A, 44, 141
- Richards et al. (2006) Richards, G. T., Lacy, M., Storrie-Lombardi, L. J., et al. 2006, ApJS, 166, 470
- Rieke et al. (2008) Rieke, G. H., Blaylock, M., Decin, L., et al. 2008, ApJ, 135, 2245
- Rodighiero et al. (2010) Rodighiero, G., Vaccari, M., Franceschini, A., et al. 2010, A&A, 515, A8
- Ross et al. (2012) Ross, N. P., McGreer, I. D., White, M., et al. 2012, arXiv:1210.6839
- Rowan-Robinson (2009) Rowan-Robinson, M. 2009, MNRAS, 394, 117
- Saunders et al. (1990) Saunders, W., Rowan-Robinson, M., Lawrence, A., et al. 1990, MNRAS, 242, 318
- Scott et al. (2012) Scott, K. S., Wilson, G. W., Aretxaga, I., et al. 2012, MNRAS, 423, 575
- Scott et al. (2010) Scott, K. S., Yun, M. S., Wilson, G. W., et al. 2010, MNRAS, 405, 2260
- Sedgwick et al. (2011) Sedgwick, C., Serjeant, S., Pearson, C., et al. 2011, MNRAS, 416, 1862
- Shankar et al. (2006) Shankar, F., Lapi, A., Salucci, P., De Zotti, G., & Danese, L. 2006, ApJ, 643, 14
- Shankar et al. (2004) Shankar, F., Salucci, P., Granato, G. L., De Zotti, G., & Danese, L. 2004, MNRAS, 354, 1020
- Sheth & Tormen (1999) Sheth, R. K., & Tormen, G. 1999, MNRAS, 308, 119
- Shimizu et al. (2012) Shimizu, I., Yoshida, N., & Okamoto, T. 2012, arXiv:1207.3856
- Shupe et al. (2008) Shupe, D. L., Rowan-Robinson, M., Lonsdale, C. J., et al. 2008, AJ, 135, 1050
- Silva et al. (1998) Silva, L., Granato, G. L., Bressan, A., & Danese, L. 1998, ApJ, 509, 103
- Smail et al. (2002) Smail, I., Ivison, R. J., Blain, A. W., & Kneib, J.-P. 2002, MNRAS, 331, 495
- Smith et al. (2012) Smith, D. J. B., Dunne, L., da Cunha, E., et al. 2012, arXiv:1208.3079
- Smolčić et al. (2012) Smolčić, V., Aravena, M., Navarrete, F., et al. 2012, A&A, 548, 4
- Soifer & Neugebauer (1991) Soifer, B. T., & Neugebauer, G. 1991, AJ, 101, 354
- Spinoglio & Malkan (1989) Spinoglio, L., & Malkan, M. A. 1989, ApJ, 342, 83
- Stecker & de Jager (1997) Stecker, F. W., & de Jager, O. C. 1997, ApJ, 476, 712
- Sugiyama (1995) Sugiyama, N. 1995, ApJS, 100, 281
- Springel et al. (2005) Springel, V., White, S. D. M., Jenkins, A., et al. 2005, Nature, 435, 629
- Swinbank et al. (2010) Swinbank, A. M., Smail, I., Longmore, S., et al. 2010, Nature, 464, 733
- Tacconi et al. (2008) Tacconi, L. J., Genzel, R., Smail, I., et al. 2008, ApJ, 680, 246
- Takagi et al. (2012) Takagi, T., Matsuhara, H., Goto, T., et al. 2012, A&A, 537, A24
- Takeuchi et al. (2003) Takeuchi, T. T., Yoshikawa, K., & Ishii, T. T. 2003, ApJ, 587, L89
- Teplitz et al. (2011) Teplitz, H. I., Chary, R., Elbaz, D., et al. 2011, AJ, 141, 1
- Treister et al. (2004) Treister, E., Urry, C. M., Chatzichristou, E., et al. 2004, ApJ, 616, 123
- Treister et al. (2006) Treister, E., Urry, C. M., Van Duyne, J., et al. 2006, ApJ, 640, 603
- Ueda et al. (2003) Ueda, Y., Akiyama, M., Ohta, K., & Miyaji, T. 2003, ApJ, 598, 886
- Vaccari et al. (2010) Vaccari, M., Marchetti, L., Franceschini, A., et al. 2010, A&A, 518, L20
- Valiante et al. (2009) Valiante, E., Lutz, D., Sturm, E., Genzel, R., & Chapin, E. L. 2009, ApJ, 701, 1814
- Vieira et al. (2010) Vieira, J. D., Crawford, T. M., Switzer, E. R., et al. 2010, ApJ, 719, 763
- Viero et al. (2012) Viero, M. P., Wang, L., Zemcov, M., et al. 2012, arXiv:1208.5049
- Wada et al. (2007) Wada, T., Oyabu, S., Ita, Y., et al. 2007, PASJ, 59, 515
- Wang et al. (2011) Wang, J., Navarro, J. F., Frenk, C. S., et al. 2011, MNRAS, 413, 1373
- Warren et al. (1994) Warren, S. J., Hewett, P. C., & Osmer, P. S. 1994, ApJ, 421, 412
- Wu et al. (2011) Wu, Y., Shi, Y., Helou, G., et al. 2011, ApJ, 734, 40
- Xia et al. (2012) Xia, J.-Q., Negrello, M., Lapi, A., et al. 2012, MNRAS, 422, 1324
- Yun et al. (2012) Yun, M. S., Scott, K. S., Guo, Y., et al. 2012, MNRAS, 420, 957
- Zemcov et al. (2010) Zemcov, M., Blain, A., Halpern, M., & Levenson, L. 2010, ApJ, 721, 424
- Zhao et al. (2003) Zhao, D. H., Mo, H. J., Jing, Y. P., Börner, G. 2003, MNRAS, 339, 12
- Zheng et al. (2005) Zheng, Z., Berlind, A. A., Weinberg, D. H., et al. 2005, ApJ, 633, 791
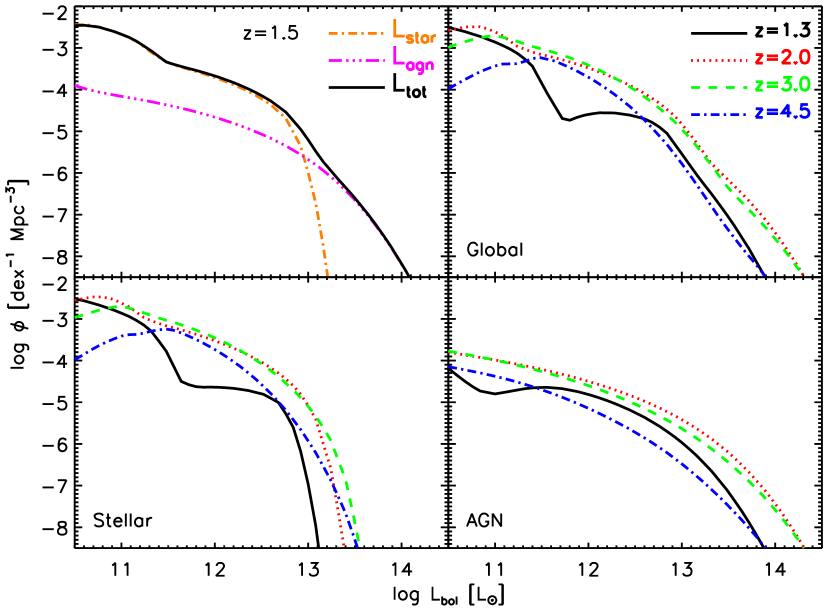
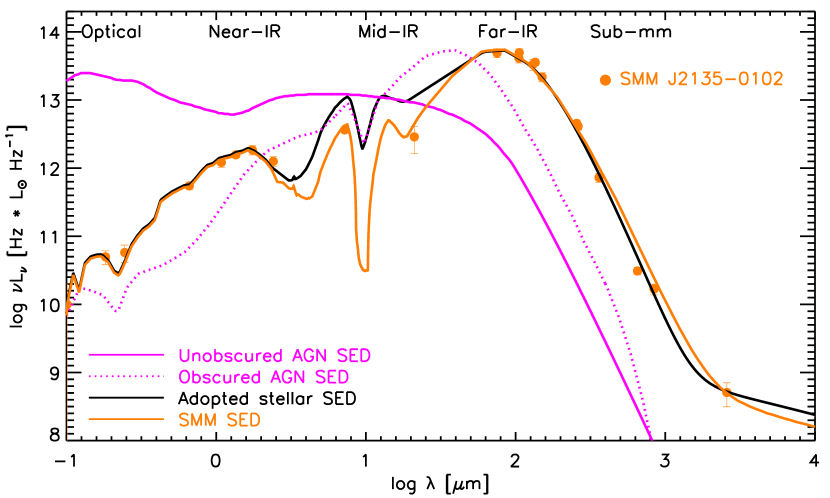
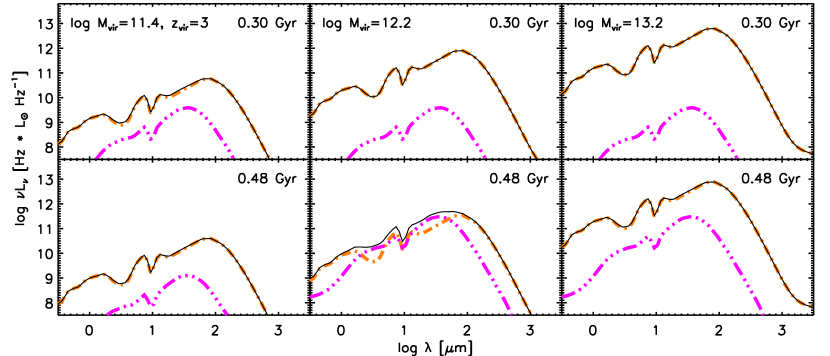
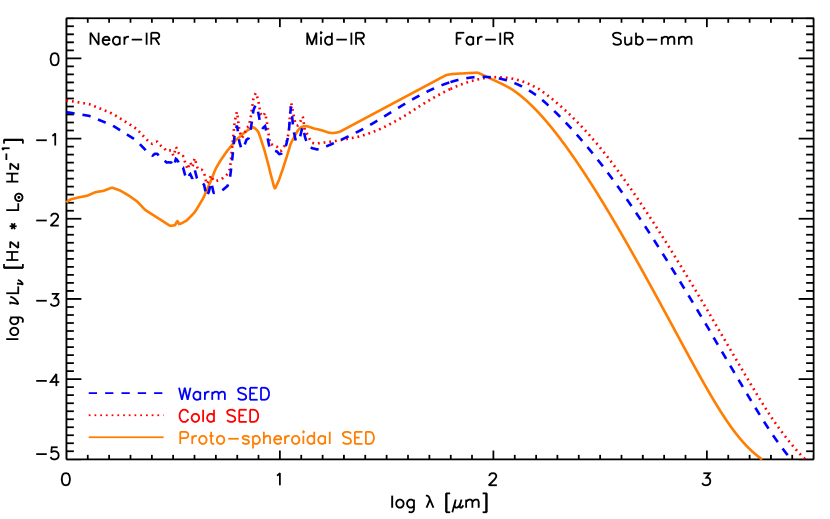
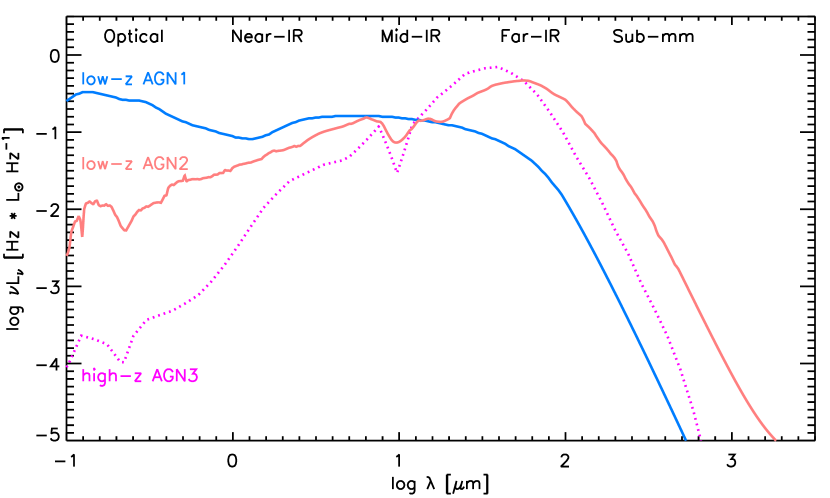

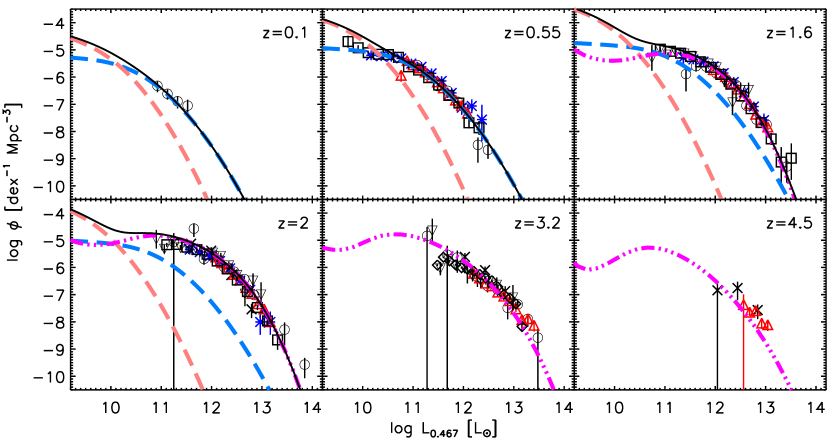

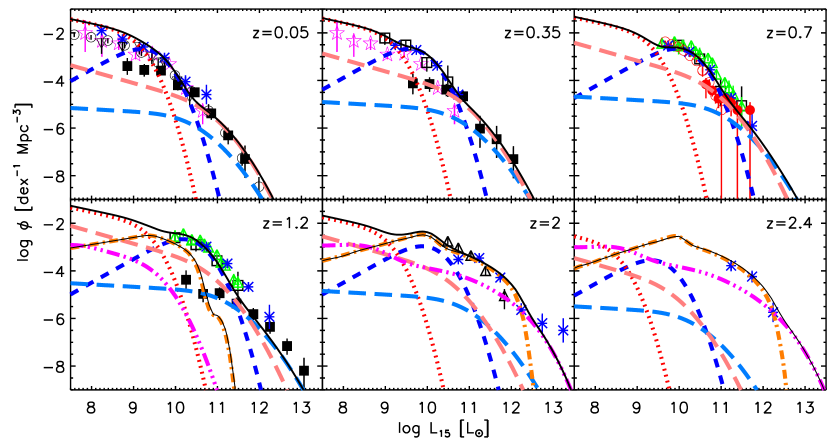
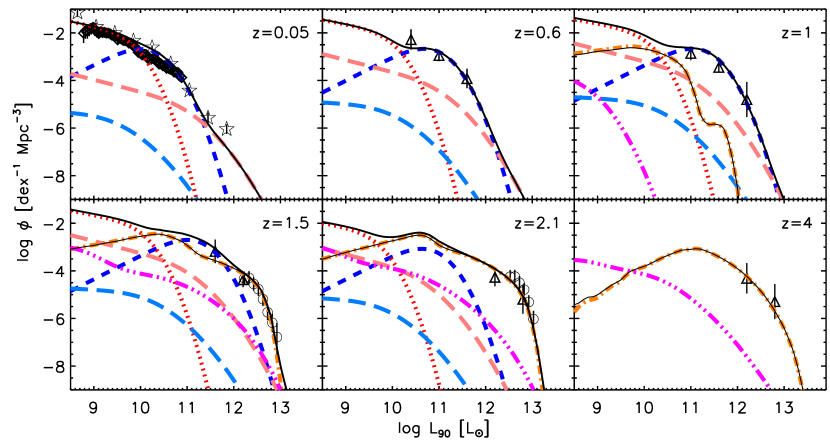
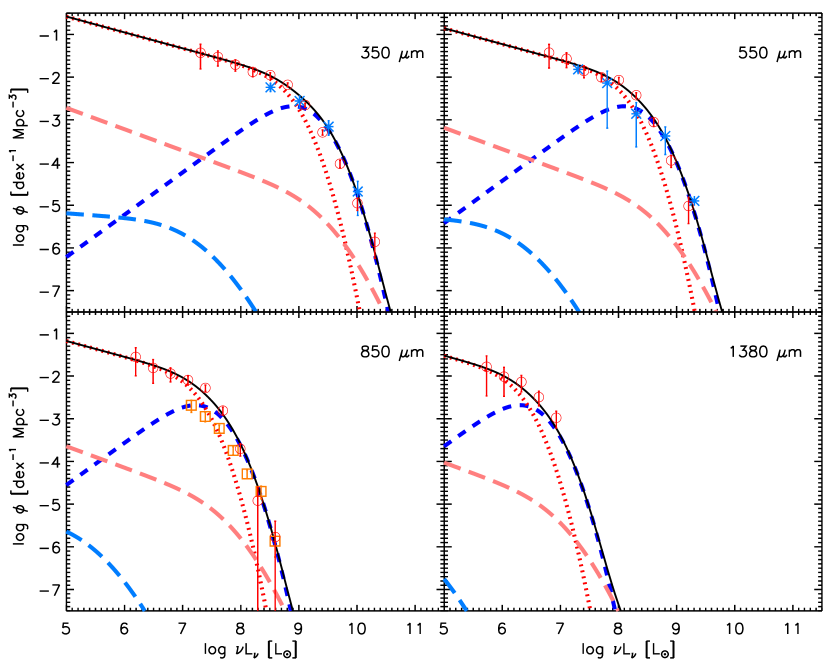
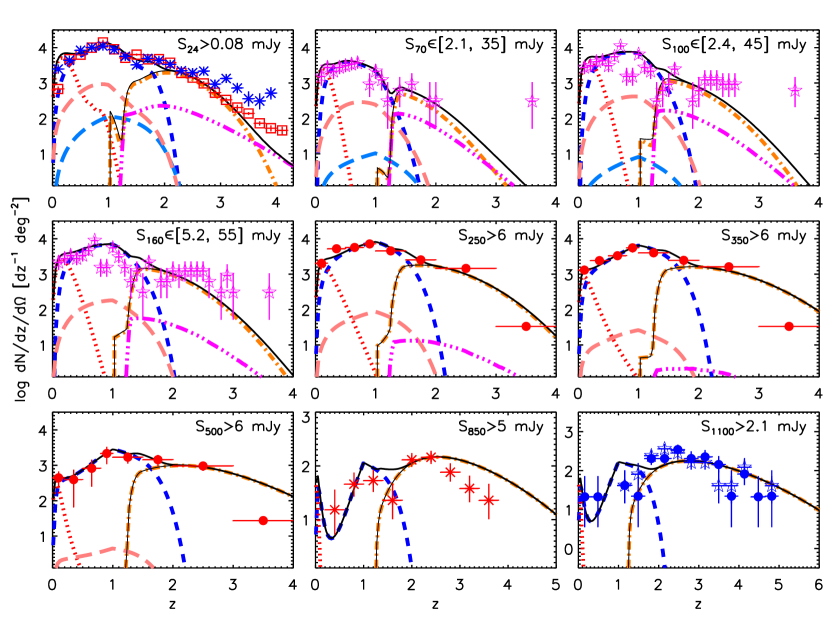
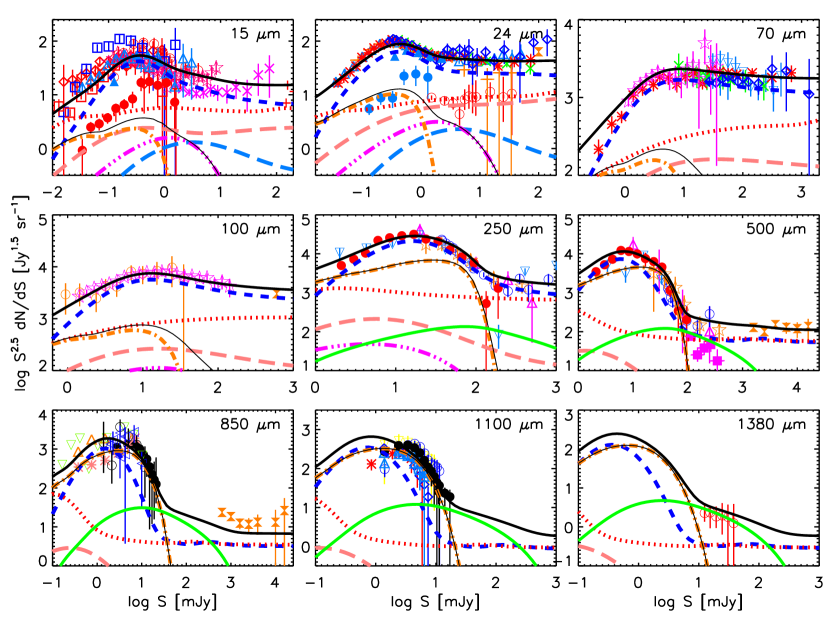
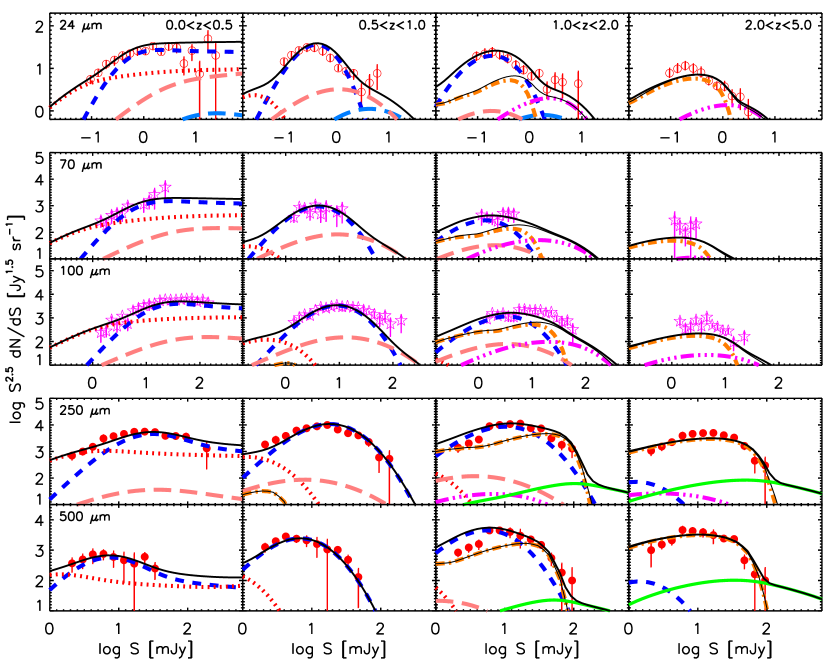
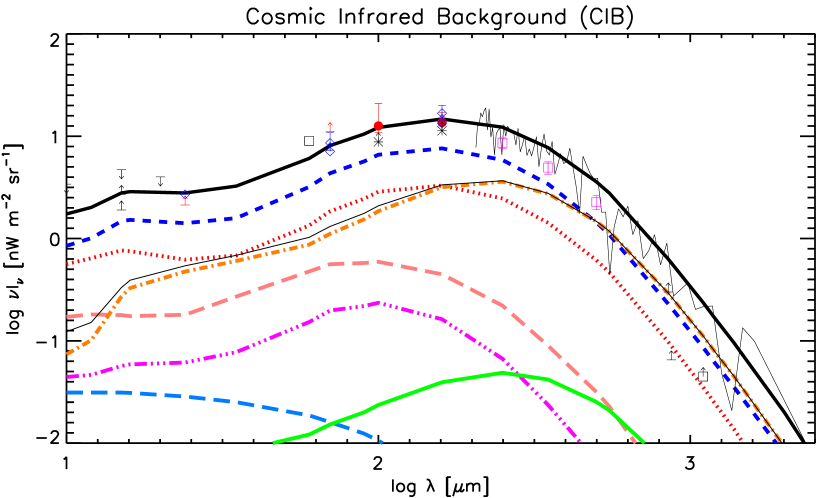
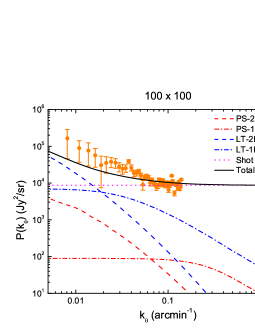
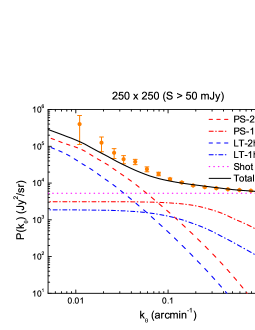
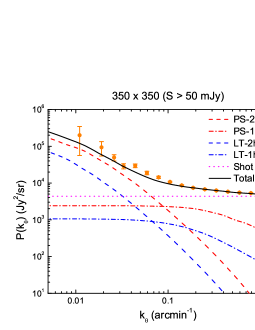


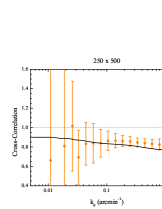
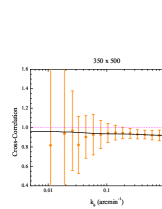
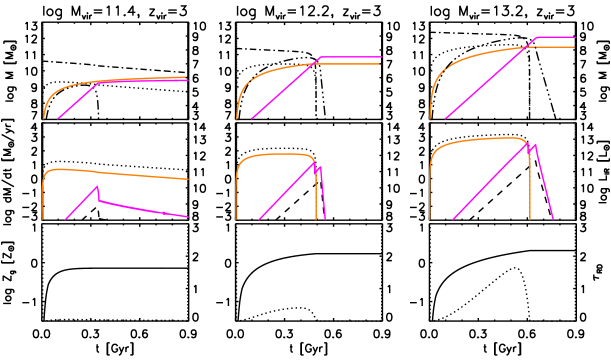
| AGN 1 (12 m) | AGN 2 (12 m) | Warm (IR) | Cold (IR) | |
|---|---|---|---|---|
| -5.409 0.098 | -4.770 0.122 | -2.538 0.051 | -1.929 0.112 | |
| 9.561 0.084 | 10.013 0.093 | 10.002 0.076 | 9.825 0.087 | |
| 1.1 | 1.5 | 0.01 | 1.372 0.121 | |
| 0.627 0.017 | 0.568 0.021 | 0.328 0.014 | 0.3 | |
| 2.014 0.400 | 4.499 0.317 | 0.060 0.200 | 0.0 | |
| 2.829 0.297 | 0.0 | 3.625 0.097 | 1.0 | |
| 1.0 | 1.0 | 1.0 | 1.0 | |
| 2.0 | 2.0 | 2.0 | 2.0 |
| Parameter | Value | Plausible range | Description |
| 3.0 | 1 - 10a | Normalization of optical depth of gas cloud [eq. (A9)] | |
| 0.10 | 0.06 - 0.42 | Black hole accretion radiative efficiency [eq. (A16)] | |
| 1 - 4 | a fewb | Redshift dependent Eddington ratio [eq. (A14)] | |
| 3.0 | 1 - 10a | Strength of QSO feedback [eq. (A19)] | |
| 3.1 | 2 - 4c | Conversion factor from of SFR to IR luminosity [eq. (A7)] | |
| 0.10 | 0.5 | Dispersion of mean stellar luminosity [eq. (2.2)] | |
| 0.35 | 0.5b | Dispersion of mean AGN luminosity [eq. (2.2)] | |
| 0.03 | 0.165 | Gas mass fraction at transition | |
| from obscured to unobscured AGNs [§ 2.2)] | |||
| 0.05 | 0.01 - 0.1d | Strength of SN feedback [eq. (A6)] | |
| 2.5 | 1 - 10e | Strength of radiation drag [eq. (A8)] |
| Wavelength (m) | Instrument | Field | Reference |
|---|---|---|---|
| 15, 24 | AKARI/IRC | NEP-deep | Takagi et al. (2012) |
| 15 | AKARI/IRC | de-lensed Abell 2218 | Hopwood et al. (2010) |
| 15 | AKARI/IRC | NEP-deep+wide | Pearson et al. (2010) |
| 15 | AKARI/IRC | CDFS | Burgarella et al. (2009) |
| 15 | AKARI/IRC | NEP-deep | Wada et al. (2007) |
| 15 | ISO/ISOCAM | ELAIS-S | Gruppioni et al. (2002) |
| 15 | ISO/ISOCAM | ISOCAM deep surveys | Elbaz et al. (1999) |
| 16 | Spitzer/IRS | GOODS-N+S | Teplitz et al. (2011) |
| 24, 70 | Spitzer/MIPS | ADF-S | Clements et al. (2011) |
| 24, 70 | Spitzer/MIPS | Spitzer legacy fields | Béthermin et al. (2010) |
| 24 | Spitzer/MIPS | SWIRE fields | Shupe et al. (2008) |
| 24 | Spitzer/MIPS | NDWFS Bootes | Brown et al. (2006) |
| 24 | Spitzer/MIPS | GOODS-N | Treister et al. (2006) |
| 24 | Spitzer/MIPS | Deep Spitzer fields | Papovich et al. (2004) |
| 70, 100 | Herschel/PACS | GOODS, LH, COSMOS | Berta et al. (2011) |
| 70 | Spitzer/MIPS | xFLS | Frayer et al. (2006) |
| 70 | Spitzer/MIPS | Bootes, Marano, CDF-S | Dole et al. (2004) |
| 100 | Herschel/PACS | Abell 2218 | Altieri et al. (2010) |
| 250, 500 | Herschel/SPIRE | HerMES | Béthermin et al. (2012b) |
| 250, 500 | Herschel/SPIRE | H-ATLAS | Clements et al. (2010) |
| 250, 500 | Herschel/SPIRE | HerMES | Oliver et al. (2010) |
| 250, 500 | Herschel/SPIRE | HerMES P(D) | Glenn et al. (2010) |
| 250, 500 | BLAST | BGS P(D) | Patanchon et al. (2009) |
| 500 | Herschel/SPIRE | H-ATLAS | Lapi et al. (2012) |
| 550, 850 | Planck | Planck all-sky survey | Planck Collaboration (2012) |
| 850 | SCUBA | Clusters | Noble et al. (2012) |
| 850 | SCUBA | Abell 370 | Chen et al. (2011) |
| 850 | SCUBA | Clusters | Zemcov et al. (2010) |
| 850 | SCUBA | Clusters & NTT-DF | Knudsen et al. (2008) |
| 850 | SCUBA | SHADES | Coppin et al. (2006) |
| 850 | SCUBA | Clusters | Smail et al. (2002) |
| 870 | APEX/LABOCA | Clusters | Johansson et al. (2011) |
| 1100 | ASTE/AzTEC | AzTEC blank-field survey | Scott et al. (2012) |
| 1100 | ASTE/AzTEC | COSMOS | Aretxaga et al. (2011) |
| 1100 | ASTE/AzTEC | ADF-S, SXDF & SSA22 | Hatsukade et al. (2011) |
| 1100 | ASTE/AzTEC | GOODS-S | Scott et al. (2010) |
| 1100 | JCMT/AzTEC | SHADES | Austermann et al. (2010) |
| 1100 | JCMT/AzTEC | COSMOS | Austermann et al. (2009) |
| 1400 | SPT | SPT survey | Vieira et al. (2010) |