e-mail
brando@cpfs.mpg.de, Phone: +49 351 4646 2324, Fax: +49 351 4646 2360,
Web: www.cpfs.mpg.de
11institutetext: 1 Max Planck Institute for
Chemical Physics of Solids, Nöthnitzer Strasse 40, D-01187 Dresden, Germany.
2 Institute of Physics, Goethe University Frankfurt, Max-von-Laue-Strasse 1, 60438 Frankfurt am Main, Germany
3 I. Physikalisches Institut, Georg-August-Universität, 37077 Göttingen, Germany
\publishedXXXX
Magnetization study of the energy scales in YbRh2Si2 under chemical pressure
Abstract
\abstcolWe present a systematic study of the magnetization in YbRh2Si2 under slightly negative (6% Ir substitution) and positive (7% Co substitution) chemical pressure. We show how the critical field , associated with the high-field Lifshitz transitions, is shifted to lower (higher) values with Co (Ir) substitution. The critical field , which identifies the boundary line of the antiferromagnetic (AFM) phase increases with positive pressure and it approaches zero with 6% Ir substitution. On the other side, the crossover field , associated with the energy scale where a reconstruction of the Fermi surface has been observed, is not much influenced by the chemical substitution. Following the analysis proposed in Refs. [1, 2, 3, 4] we have fitted the quantity with a crossover function to indentify . The line follows an almost linear -dependence at sufficiently high fields outside the AFM phase, but it deviates from linearity at and in Yb(Rh0.93Co0.07)2Si2 it changes slope clearly inside the AFM phase. Moreover, the FWHM of the fit function depends linearly on temperature outside the phase, but remains constant inside, suggesting either that such an analysis is valid only for or that the Fermi surface changes continuously at inside the AFM phase.
keywords:
magnetization, heavy fermions, quantum criticality, YbRh2Si2.The general understanding of quantum critical points (QCPs) is based on the concept of a single energy scale that fades continuously for . The conventional theoretical approach associates with this energy scale an order parameter that is defined finite inside a region of the phase diagram and zero elsewhere [5, 6, 7]. The corresponding phase transition at is a quantum phase transition (QPT). If this region is separated from the rest by a second-order phase transition line, a QCP exists at the QPT. In materials with magnetic phase transitions, the energy scale is usually considered to be the ordering transition temperature - e.g., in the case of antiferromagnetic (AFM) systems, this is the Néel temperature - and the order parameter is the staggered magnetization [8, 9]. In metallic systems the magnetic order can be of the spin-density-wave (SDW) type and the same electrons which form the Fermi surface are involved in the QPT. Prominent examples of quantum critical systems are heavy-fermion compounds because of the small energy scale associated with the hybridization between nearly localized f-electrons with the conduction electrons. Here, the QPT separates a paramagnetic (PM) heavy Fermi liquid (FL) from an AFM metal. In these systems there are two principal energy scales: and which derive from the respective interactions, the Kondo and the RKKY. defines the temperature at which the localized -electrons start to hybridize with the itinerant -electrons to form a larger and heavier Fermi surface, is a measure of the inter-site exchange magnetic coupling. The interplay between these energy scales determines the magnetic ordering temperature and characterizes the QCP [10]. In real systems, however, the situation can be rather more complex, due to the presence of multiple energy scales that can get involved in the QPT [2]. In addition, many materials show more than just a single magnetic phase transition. Therefore, experimental studies of quantum criticality become quite demanding but, on the other hand, promising for the discovery of novel correlated phases of condensed matter.
A prototypical example of such a complex system is the tetragonal YbRh2Si2, which is particularly suitable for studying QPTs [11, 12, 13]. In fact, this compound has a large K and a very small mK that can be suppressed by a magnetic field mT (, with being the magnetically hard axis) or chemical negative pressure ( GPa) [13, 14, 15]. Three other intriguing features have recently been detected: (i) Another sharp phase transition at mK [16], (ii) a kink in the magnetization at T [17, 18], and (iii) a crossover energy scale [1, 2].
The origin of the low- transition is still unclear, but the comparison with the isoelectronic analogue YbCo2Si2 [19, 20] and the evolution of observed in the series Yb(Rh1-xCox)2Si2 (Co substitution corresponds to positive pressure) might suggest a second, possibly first-order, AFM transition [21, 22, 23]. The feature at has been interpreted as field-induced suppression of the HF state, as hydrostatic pressure experiments have revealed a clear correspondence between and the Kondo scale [17, 18]. Accurate de-Haas-van-Alphen experiments could show that the Fermi surface smoothly changes at suggesting a Lifshitz-like type of transition [24]. Meanwhile, thermopower experiments and renormalized band structure calculations have undoubtly demonstrated that the anomaly at is caused by the field-induced shift of a van-Hove singularity (in the quasiparticle density of states) through the Fermi level, causing two consecutive Lifshitz transitions [25, 26]. Finally, there is the crossover line which has been found in measurements of the Hall-effect [1] and various other thermodynamic properties [2]. The full width at half maximum (FWHM) of these crossovers displays a linear temperature dependence [3, 27]. This suggests a step-like change of the Hall coefficient at implying a Fermi surface reconstruction. These findings have corroborated a series of previous theoretical proposals which considered the Fermi surface collapse due to the critical breakdown of the Kondo screening effect at the field-induced AFM QCP, including degrees of freedom other than fluctuations of the order parameter [28, 29, 30, 31]. In addition, it has been shown that the linear dependence of the FWHM on temperature is consistent with the energy over temperature scaling of the quantum-critical single-electron fluctuation spectrum [27]. However, experimental evidence that the energy scale does not change much under applied pressure [3, 4], while the other energy scales , and are very pressure sensitive [14, 15, 23], has reopened the debate on how to interpret the experimental results. Three possibilities are currently considered: (i) The line represents a Kondo-destruction Lifshitz transition inside the magnetic phase with a change between two Fermi surfaces which have different topology [32, 33, 34, 35]; (ii) it represents the effect of a Zeeman-induced Lifshitz transition [36, 37, 38]; (iii) recent inelastic neutron scattering experiments associate the electron spin resonance signal [39] seen in YbRh2Si2 with a field-induced mesoscopic spin resonance, which evolves in field like the line [40].
In this article we follow the evolution of the three aforementioned energy scales under the effect of chemical pressure by means of magnetization measurements. Pressure is induced by substituting a small amount of either Co (positive pressure) or Ir (negative pressure) for Rh. The substitution is isoelectronic and small, to avoid the effect of disorder. The single crystals were grown from In flux as described in Ref. [41]. The good quality of the samples as well as the good agreement between chemical and hydrostatic pressure is shown in the Supplementary Information of Ref. [3].
Our crystals of YbRh2Si2, Yb(Rh0.93Co0.07)2Si2 and Yb(Rh0.94Ir0.06)2Si2 have a residual resistivity of 0.55, 3, and 7.4 cm, respectively. In the Yb(Rh0.93Co0.07)2Si2 sample two phase transitions have been found at mK and mK, whereas in Yb(Rh0.94Ir0.06)2Si2 no phase transition has been seen down to 20 mK. The dc-magnetization has been measured with a high-resolution Faraday magnetometer, in magnetic fields as high as 12 T and temperatures down to 50 mK [42]. The field was applied along the magnetic easy plane, i.e., perpendicular to the crystallographic -axis. We show how the critical field is shifted to lower (higher) values with Co (Ir) substitution, as expected [17]. On the other side, the crossover field is not much influenced by the chemical substitution. Performing the analysis proposed in Refs. [1, 2, 3, 4] we illustrate that seems to follow a linear dependence outside the AFM phase, deviating from linearity at temperatures close to , and in Yb(Rh0.93Co0.07)2Si2 it changes slope inside the magnetic phase. Moreover, the FWHM of the crossover fit function is linear-in- outside the AFM phases but constant inside the Yb(Rh0.93Co0.07)2Si2 AFM phase, suggesting that either such an analysis is valid only for or the Fermi surface changes continuously at .
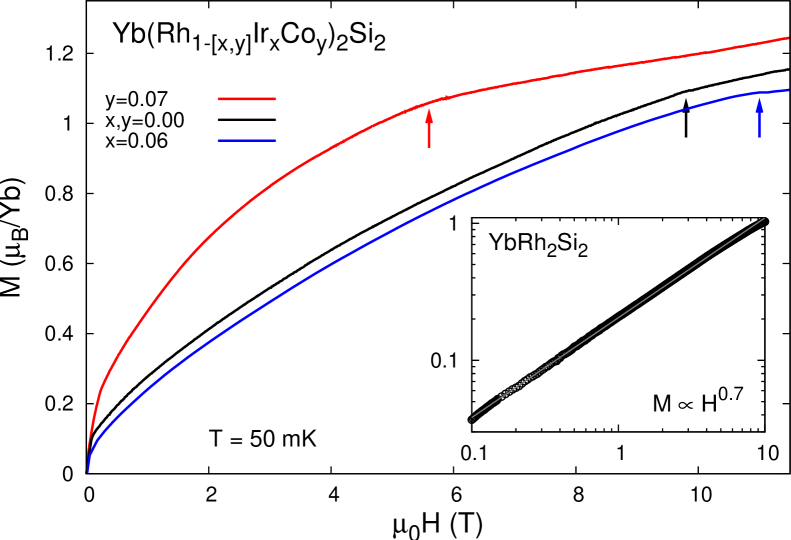
The first result is illustrated in Fig. 1, where the field-dependent magnetization curves for YbRh2Si2, Yb(Rh0.94Ir0.06)2Si2 and Yb(Rh0.93Co0.07)2Si2 samples are shown up to 12 T. In YbRh2Si2 the magnetization measured at 50 mK shows two clear kinks at about 0.1 (cf. Fig. 2) and 10 T [17]. Inbetween is proportional to , as demonstrated in the inset of the same figure, possibly reflecting the continuous evolution with magnetic field of the quasiparticle density of states at the Fermi energy [17, 18] given as a consequence of the suppression of the local Kondo effect [43, 25]. The upward arrows () indicate the fields , associated with the high-field Lifshitz transitions [17, 44]. In the Yb(Rh0.93Co0.07)2Si2 sample the kink at is shifted to about 5.6 T while in Yb(Rh0.94Ir0.06)2Si2 is shifted to 11 T, in agreement with previous pressure studies [17].
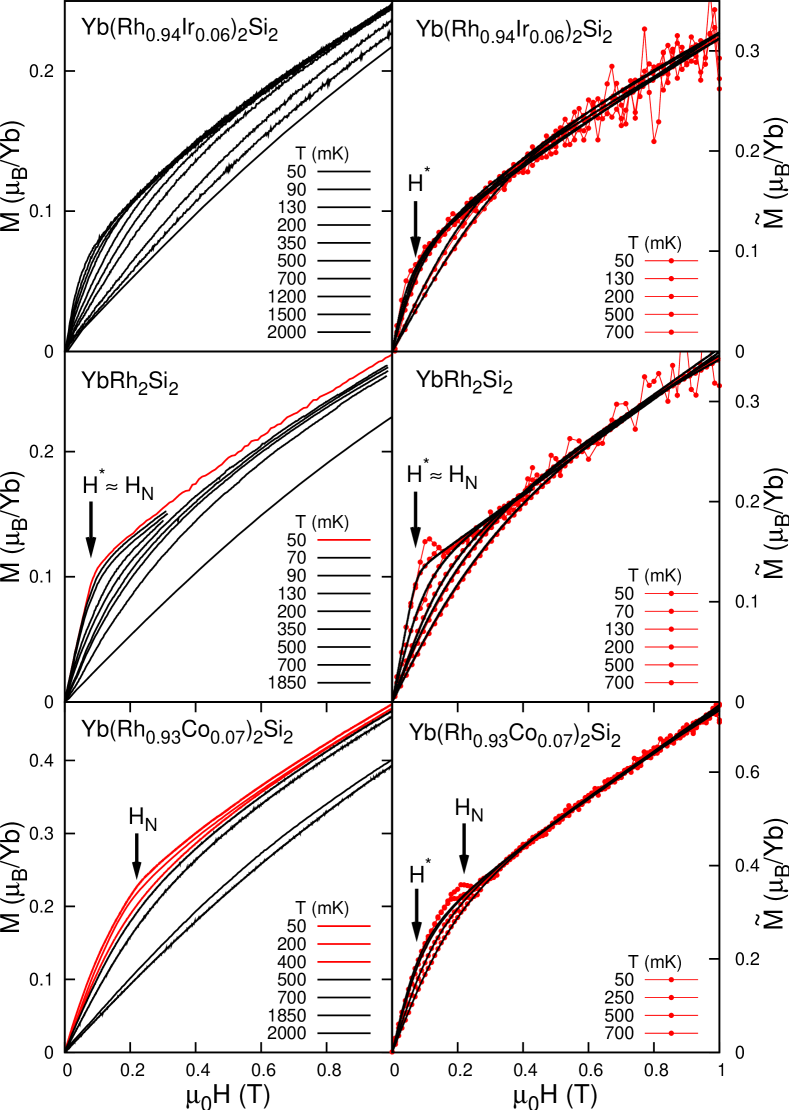
We focus now on the energy scale . The field , associated with this energy scale, was identified in YbRh2Si2 with the change of slope of the quantity , i.e. the kink in vs. , derived from magnetization isotherms (cf. Fig. 2, right panels) [2, 4, 45]. At 50 mK, the kink in at about mT derives from the kink in at about 100 mT which remains sharp even at temperatures higher than mK (cf. curves in middle panels of Fig. 2 at 70 and 90 mK). Therefore, the kink at can not be associated with the critical field of the AFM phase, but matches quite well the crossover field extracted from Hall-effect, magnetoresistivity and ac-susceptibility measurements [2, 3, 27]. Moreover, is also visible in Yb(Rh0.94Ir0.06)2Si2 where is almost zero. We have performed the analysis proposed in Refs. [1, 2] for the three single crystals (see Fig. 2). In analogy with the Hall-effect signatures observed at , vs. might be fitted with the integral of the following step function:
| (1) |
where parameters and denote the linear slope of vs. before and after the kink. Since vs. is not linear for , we have previously used the quantity vs. which represents the derivative of the magnetic free energy and is almost linear above T up to at least 2 T (right frames of Fig. 2). We have performed these fits for all our isotherms as shown in the right panels of Fig. 2. It is worth mentioning, that, for instance, the fact that at 50 mK in the stoichiometric crystal the critical fields and almost coincide would imply that at temperatures lower that 50 mK these energy scales might intersect each other (this hypothesis is currently being investigated by measurements of the Hall effect under pressure). For Co concentrations higher than 7% this analysis clould not be performed anymore because of the high and the stronger curvature of vs. .
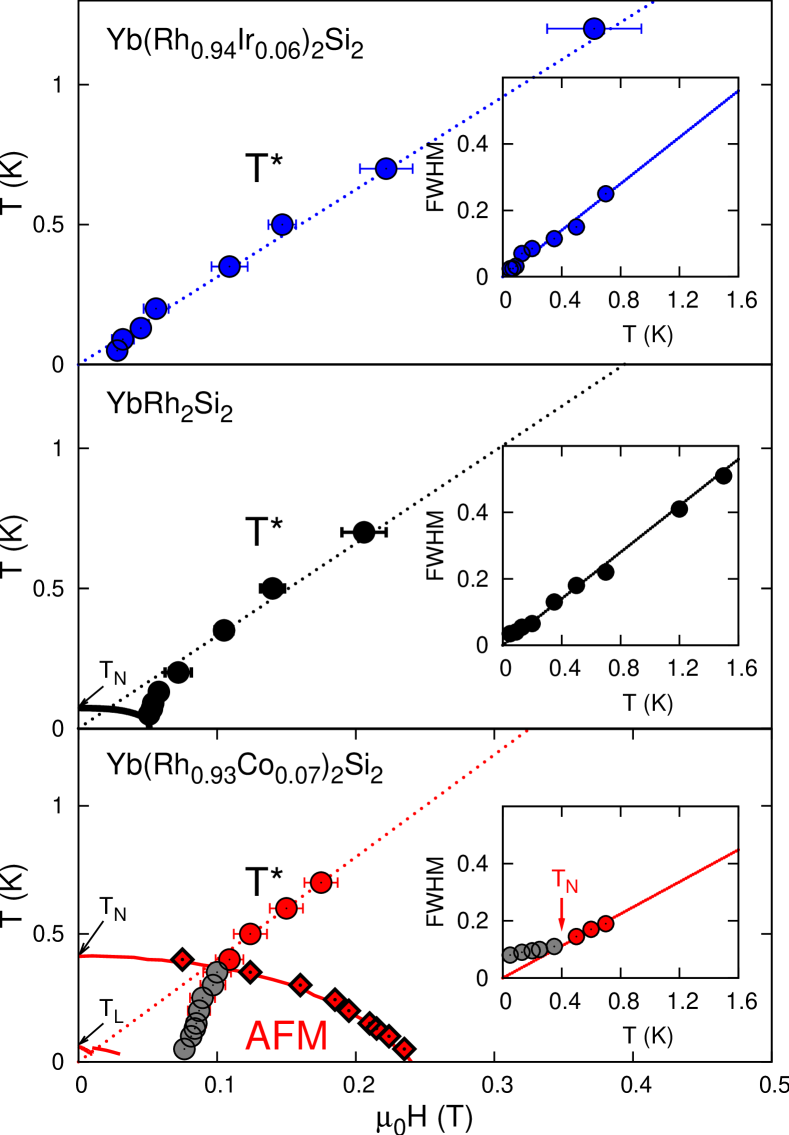
In the right frames of Fig. 2 the black lines are the fit to the data performed by integrating equation 1. The little humps are a consequence of the weak kinks in the magnetization isotherms due to the transition at from the AFM phase into the PM phase. At these kinks decreases slightly and shows a drop which is small when compared to the main magnetization signal. These humps are not considered during the fit procedures. This can be seen in the right panel of Fig. 2 where vs. is plotted for YbRh2Si2: The fit function for the data at 70 mK which show no hump since lies on the top of the fit function for the data at 50 mK which show a clear hump at . The same is valid for Yb(Rh0.93Co0.07)2Si2 where displays a distinct curvature already at fields (see lower right panel of Fig. 2). The fact that vs. does not change much when the temperature is lowered below is reflected in the almost constant position of the line inside the AFM phase (gray points in Fig. 3), as observed before [3].
The results of such fits are summarized in the phase diagrams of Fig. 3: The crossover field , associated with the energy scale , is not much influenced by the chemical substitution when compared to the substantial change of the AFM ordered phase, i.e. the enhancement of and . seems to follow a linear dependence outside the AFM phase, it deviates from linearity at and in the Yb(Rh0.93Co0.07)2Si2 sample it changes slope clearly inside the magnetic phase. Correspondingly, the FWHM of the crossover fit function depends linearly on temperature at sufficiently high magnetic fields outside the AFM phase in agreement with Ref. [27], but remains constant inside, suggesting either that such an analysis is valid only for , where it is not influenced by the ordered magnetic structure, or that the Fermi surface changes continuously at inside the magnetic phase. The pronounced change of slope inside the AFM phase of the Yb(Rh0.93Co0.07)2Si2 sample was not seen in ac-susceptibility measurements where T [3]. Our analysis of the magnetization provides T.
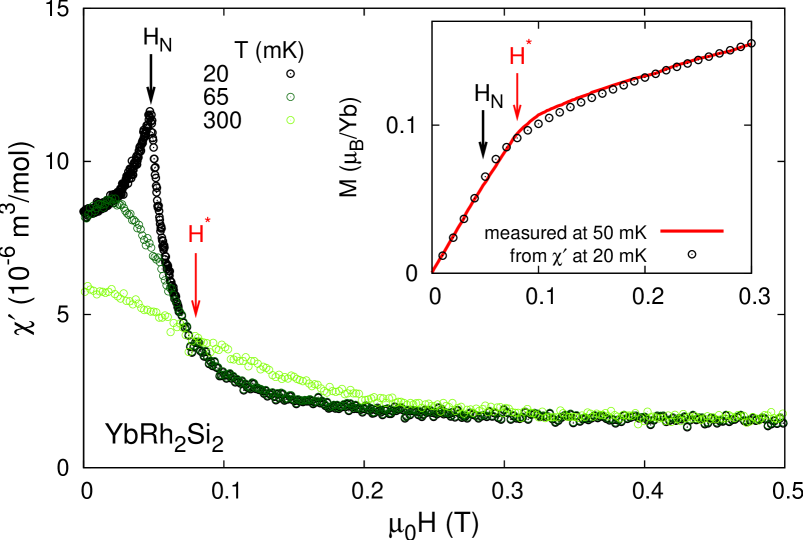
We discuss now the position of with respect to in YbRh2Si2. To detect the precise position of we have measured the -dependence of the ac-susceptibility in the very same sample at temperatures below and above . The results are shown in Fig. 4: At 20 mK, displays a clear peak at mT and then decreases rapidly and continuously. This feature indicates a metamagnetic-like transition from the AFM to a PM state. The kink in at about 0.1 T, which is in turn associated with the kink at T in , is the result of the rapid flattening of with increasing . No other anomalies are detected. Integrating the curve at 20 mK and plotting it together with the magnetization measured at 50 mK (inset of Fig. 4), we observe that the two curves match relatively well. From this analysis it can be inferred that in agreement with results from magnetotransport experiments [27]. Moreover, the red arrow in Fig. 4, which marks the position of , points towards the point where the three susceptibility curves cross each other (isosbestic point [47]). This indicates that in agreement with the maximum observed at in [3]. The Maxwell relation implies that the field dependence of the entropy has an inflection point at as it was demonstrated in Refs. [4, 48]. Thus, the line defines the lines of .
To conclude, we have analyzed magnetization isotherms of single crystals of YbRh2Si2, Yb(Rh0.94Ir0.06)2Si2 and Yb(Rh0.93Co0.07)2Si2 to indentify the position of the Fermi reconstruction crossover line in the phase diagrams. We confirm that is not much influenced by the Co and Ir isoelectronic substitution and that this line follows the points in the phase diagram where the entropy shows an inflection point. In the phase diagram of YbRh2Si2 this line is definitely located on the right of the AFM phase boundary line at the lowest temperatures. More importantly, in Yb(Rh0.93Co0.07)2Si2 the line clearly falls inside the AFM phase and the FWHM of the crossover function remains almost constant inside the AFM phase while , suggesting either that such an analysis is valid only for or that the Fermi surface changes continuously at . {acknowledgement} We are indebted to S. Friedemann, Q. Si, A. Steppke, Y. Tokiwa, M. Vojta, S. Wirth for motivating discussions. Part of the work was supported by the DFG Research Unit 960 “Quantum Phase Transitions”.
References
- [1] S. Paschen et al., Nature 432, 881 (2004).
- [2] P. Gegenwart et al., Science 315, 969 (2007).
- [3] S. Friedemann et al., Nature Phys. 5, 465 (2009).
- [4] Y. Tokiwa, P. Gegenwart, C. Geibel, and F. Steglich, J. Phys. Soc. Jpn. 78, 123708 (2009).
- [5] J. A. Hertz, Phys. Rev. B 14, 1165 (1976).
- [6] A. J. Millis, Phys. Rev. B 48, 7183 (1993).
- [7] T. Moriya and T. Takimoto, J. Phys. Soc. Jpn. 64, 960 (1995).
- [8] H. v. Löhneysen, A. Rosch, M. Vojta, and P. Wölfle, Rev. Mod. Phys. 79, 1015 (2007).
- [9] P. Gegenwart, Q. Si, and F. Steglich, Nature Phys. 4, 186 (2008).
- [10] S. Doniach, Physica B+C 91, 231 (1977).
- [11] O. Trovarelli et al., Phys. Rev. Lett. 85, 626 (2000).
- [12] P. Gegenwart et al., Phys. Rev. Lett. 89, 056402 (2002).
- [13] J. Custers et al., Nature 424, 524 (2003).
- [14] S. Mederle et al., J. Phys.: Condens. Matter 14, 10731 (2002).
- [15] M. E. Macovei, M. Nicklas, C. Krellner, C. Geibel, and F. Steglich, J. Phys.: Condens. Matter 20, 505205 (2008).
- [16] E. Schuberth et al., J. Phys.: Conf. Ser. 150, 042178 (2009).
- [17] Y. Tokiwa et al., Phys. Rev. Lett. 94, 226402 (2005).
- [18] P. Gegenwart et al., New J. Phys. 8, 171 (2006).
- [19] L. Pedrero et al., J. Phys.: Conf. Ser. 200, 012157 (2010).
- [20] L. Pedrero et al., Physical Review B 84, 224401 (2011).
- [21] C. Klingner, Dipl. thesis, Technical University, Dresden, 2009.
- [22] C. Klingner, C. Krellner, M. Brando, C. Geibel, and F. Steglich, New Journal of Physics 13, 083024 (2011).
- [23] C. Klingner et al., Physical Review B 83, 144405 (2011).
- [24] P. M. C. Rourke et al., Phys. Rev. Lett. 101, 237205 (2008).
- [25] G. Zwicknagl, Journal of Physics: Condensed Matter 23, 094215 (2011).
- [26] H. Pfau, unpublished .
- [27] S. Friedemann et al., Proc. Natl. Acad. Sci. 107, 14547 (2010).
- [28] P. Coleman, C. Pépin, Q. Si, and R. Ramazashvili, J. Phys.: Condens. Matter 13, R723 (2001).
- [29] Q. Si, M. S. Rabello, K. Ingersent, and J. L. Smith, Nature 413, 804 (2001).
- [30] T. Senthil, S. Sachdev, and M. Vojta, Phys. Rev. Lett. 90, 216403 (2003).
- [31] C. Pépin, Phys. Rev. Lett. 94, 066402 (2005).
- [32] Q. Si, Physica B 378-380, 23 (2006).
- [33] M. Vojta, Phys. Rev. B 78, 125109 (2008).
- [34] S. J. Yamamoto and Q. Si, Phys. Rev. Lett. 99, 016401 (2007).
- [35] P. Coleman and A. H. Nevidomskyy, Journal of Low Temperature Physics 161, 182 (2010).
- [36] A. Hackl and M. Vojta, Phys. Rev. Lett. 106, 137002 (2011).
- [37] S. Friedemann et al., arXiv:1207.0536 (2012).
- [38] A. Hackl and M. Vojta, arXiv:1207.1123 (2012).
- [39] J. Sichelschmidt, V. A. Ivanshin, J. Ferstl, C. Geibel, and F. Steglich, Physical Review Letters 91, 156401 (2003).
- [40] C. Stock et al., Phys. Rev. Lett. 109, 127201 (2012).
- [41] C. Krellner, S. Taube, T. Westerkamp, Z. Hossain, and C. Geibel, Philosophical Magazine 92, 2508 (2012).
- [42] T. Sakakibara, H. Mitamura, T. Tayama, and H. Amitsuka, Jpn. J. Appl. Phys. 33, 5067 (1994).
- [43] A. C. Hewson, J. Bauer, and W. Koller, Phys. Rev. B 73, 045117 (2006).
- [44] A. Steppke et al., Phys. Status Solidi (b) 247, 737 (2010).
- [45] P. Gegenwart et al., Physica B 403, 1184 (2008).
- [46] T. Westerkamp, Quantenphasenübergänge in den Schwere-Fermionen-Systemen Yb(Rh1-xMx)2Si2 und CePd1-xRhx, PhD thesis, Technische Universität Dresden, 2009.
- [47] M. Eckstein, M. Kollar, and D. Vollhardt, Journal of Low Temperature Physics 147, 279 (2007).
- [48] Y. Tokiwa, T. Radu, C. Geibel, F. Steglich, and P. Gegenwart, Phys. Rev. Lett. 102, 066401 (2009).