The Outburst of the Blazar S5 0716+71 (catalog ) in 2011 October: Shock in a Helical Jet
Abstract
We present the results of optical ( band) photometric and polarimetric monitoring and Very Long Baseline Array (VLBA) imaging of the blazar S5 0716+714 (catalog ) along with Fermi -ray data during a multi-waveband outburst in 2011 October. We analyze total and polarized intensity images of the blazar obtained with the VLBA at 43 GHz during and after the outburst. Monotonic rotation of the linear polarization vector at a rate of per night coincided with a sharp maximum in -ray and optical flux. At the same time, within the uncertainties, a new superluminal knot appeared, with an apparent speed of . The general multi-frequency behavior of the outburst can be explained within the framework of a shock wave propagating along a helical path in the blazar’s jet.
Subject headings:
galaxies: active — BL Lacertae objects: individual (S5 0716+71) — galaxies: jets — polarization1. Introduction
The blazar S5 0716+71 (catalog ) is one of most intensively studied BL Lac objects. The redshift determinations () are based on measurements of the size of a marginally detected host galaxy and a location near three galaxies with redshifts of 0.26 (Bychkova et al., 2006; Nilsson et al., 2008). Optical variability has been studied by many teams; the blazar exhibits persistent activity on both long and short (intraday) timescales, as shown by, e.g., Wagner et al. (1996); Ghisellini et al. (1997), Hagen-Thorn et al. (2006), and Stalin et al. (2006, 2009), and by the results of several WEBT campaigns (Raiteri et al., 2003; Ostorero et al., 2006; Villata et al., 2008; Chen et al., 2008). Violent polarimetric variability of S5 0716+71, among other blazars, was studied by Ikejiri et al. (2011). Uemura et al. (2010), using a Bayesian approach, suggest that the behavior of polarization in S5 0716+714 implies the presence of a number of polarization components having quite short timescales of variations. Larionov et al. (2008) reported that a huge optical outburst of S 50716+71 in 2008 April was accompanied by a rotation of the position angle of the electric vector (EVPA) of linear polarization.
In this paper, we report the results of our observations of S5 0716+71 during a major optical outburst in 2011 October, which coincided with an unprecedented -ray outburst (Blinov et al., 2011). We present our observations in § 2, describe the phenomenological model in § 3, and apply it to the data and draw conclusions in § 4.
2. Observations and Results
The observations reported here were collected as a part of a long-term multi-wavelength study of blazars that follows nonthermal activity at optical and -ray frequencies. An overview of this program is given in Marscher (2012).
2.1. Optical Observations
We obtained observational data at the 70-cm AZT-8 reflector of the Crimean Astrophysical Observatory, 40-cm LX-200 telescope in St. Petersburg, both equipped with identical photometers-polarimeters based on ST-7 CCDs, and 1.8-m Perkins telescope of Lowell Observatory using the PRISM camera. The photometric measurements in band were supplemented by observations at the 2-m Liverpool Telescope at La Palma, Canary Islands, Spain. Polarimetry at AZT-8 and the Perkins telescope was made in Cousins band, and in white light at LX-200, with effective wavelength close to . The photometric errors do not exceed .
Instrumental polarization was found via stars located near the object under the assumption that their radiation is unpolarized. The Galactic latitude of S5 0716+714 is and , so that interstellar polarization (ISP) in this direction is less than 0.5%. To correct for the ISP, the mean relative Stokes parameters of nearby stars were subtracted from the relative Stokes parameters of the object. This accounts for the instrumental polarization as well. The errors in degree of polarization are less than 1% (in most cases less than 0.5%), while the EVPA is determined with a precision of 1–2 degrees.
2.1.1 Results
Our regular photometric and polarimetric monitoring of S5 0716+71 started in 2005. Since then, we have obtained more than 1000 data points almost uniformly spread over a 7-year interval, although we intensified our observations during the periods of highest activity of the source.
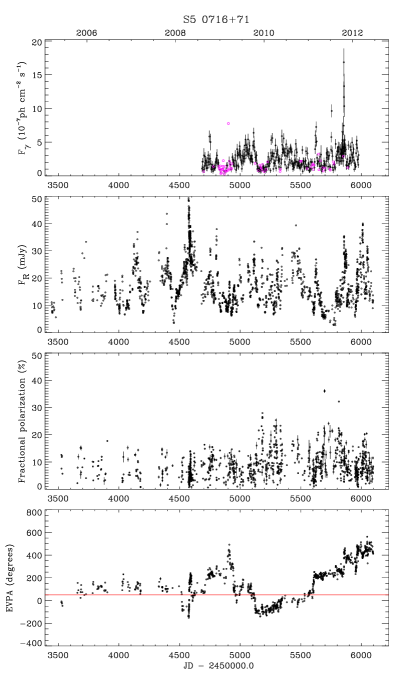
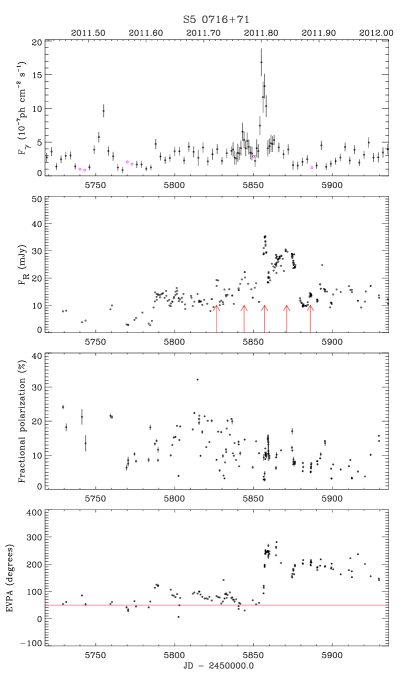
Figure 1 presents the flux and polarization behavior of S5 0716+71 (catalog ) for 2005–2011. We supplement this plot with a panel showing the -ray light curve from Fermi LAT open access data in order to show that the most prominent -ray activity ever recorded for this source was observed during the October 2011 optical outburst. In Fig. 2 we show a blowup of the last six months of 2011. Table 1 lists the photometric and polarimetric data of S5 0716+71 around the time of the outburst.
| JD-2400000 | Telescope | ||||||
|---|---|---|---|---|---|---|---|
| (days) | (mag) | (mag) | (%) | (%) | () | () | |
| 55823.516 | 13.496 | 0.012 | 20.11 | 0.41 | 246.7 | 0.5 | LX-200 |
| 55826.543 | 13.002 | 0.003 | 8.64 | 0.17 | 262.9 | 0.5 | AZT-8+ST7 |
| 55827.554 | 13.012 | 0.002 | 16.90 | 0.24 | 258.7 | 0.4 | AZT-8+ST7 |
| 55828.547 | 13.582 | 0.003 | 5.51 | 0.40 | 257.6 | 2.1 | AZT-8+ST7 |
| 55829.544 | 13.542 | 0.004 | 16.75 | 0.28 | 235.6 | 0.4 | AZT-8+ST7 |
| 55830.560 | 13.598 | 0.003 | 9.77 | 0.50 | 243.0 | 1.4 | AZT-8+ST7 |
| 55831.574 | 13.219 | 0.002 | 3.17 | 0.16 | 254.0 | 1.5 | AZT-8+ST7 |
| 55832.531 | 13.373 | 0.003 | 11.66 | 0.41 | 269.8 | 1.0 | LX-200 |
| 55833.533 | 13.361 | 0.003 | 20.14 | 0.32 | 266.9 | 0.4 | AZT-8+ST7 |
| 55836.488 | 13.384 | 0.003 | 19.93 | 0.87 | 258.1 | 1.2 | LX-200 |
Note. — Table 1 is published in its entirety in the electronic edition of the Journal. A portion is shown here for guidance regarding its form and content.
The optical light curve of S5 0716+71 displays violent variability on both long (months-years) and short (days-weeks) timescales. Changes in the degree of polarization seem to occur erratically: within the time interval 2005–2009 it varied from 0 to 15%, while later the mean level of polarization increased, reaching a record value of 36% on the night of 2011 May 14 (JD 2455696). The EVPA also exhibited prominent changes. To solve the ambiguity, we have added/subtracted each time that the subsequent value of EVPA is less/more then the preceding one.
2.2. Radio Observations
The BL Lac object S5 0716+71 is monitored by the Boston University group with the Very Long Baseline Array (VLBA) at 43 GHz within a sample of bright -ray blazars111http://www.bu.edu/blazars with an angular resolution of 0.1 mas, which corresponds to 0.45 pc at the source distance (, , ). The VLBA data were calibrated and imaged in the same manner as discussed in Jorstad et al. (2005).
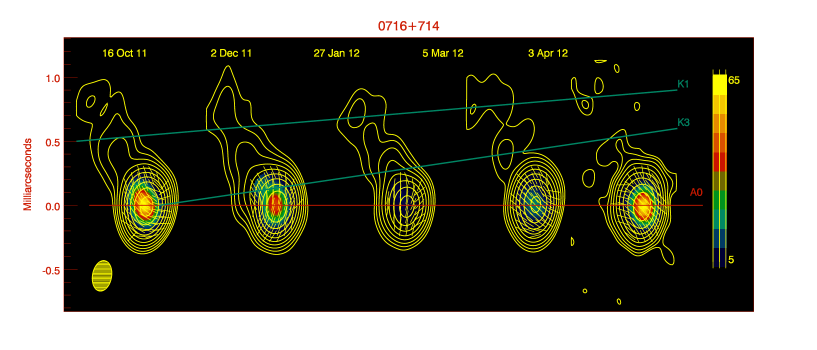
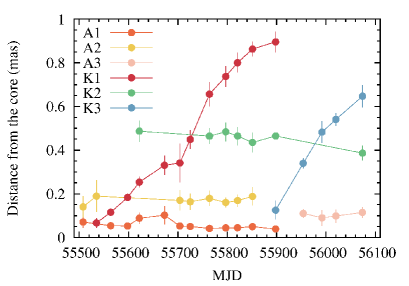
We fit the VLBA data at 16 epochs from 2010 December to 2012 May by a model consisting of a number of components with circular Gaussian brightness distributions. During this period we identify 6 components, , and , in addition to the core, (Fig. 3), 4), which is, presumably, a stationary feature located at the southern edge of the jet in the images. Figure 5 shows the evolution of the distance of knots from the core, while Figure 6 plots the trajectories of the knots.
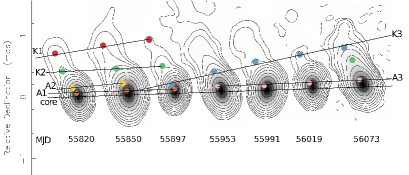
Knots and move to the northeast along slightly different trajectories with apparent speeds of 18.10.5 c and 212 c, respectively. An apparent speed of 20 c seems to be common in the parsec scale jet of S5 0716+71 (see, e.g., Rastorgueva et al., 2011). Knot undergoes both an acceleration along the jet =0.230.06 mas yr-2 and perpendicular to the jet =-0.190.06 mas yr-2. An extrapolation of the motion of back to the core suggests that it passed through the core on MJD 5585010. Figure 4 shows total and polarized intensity images of the quasar while emerged from the core.
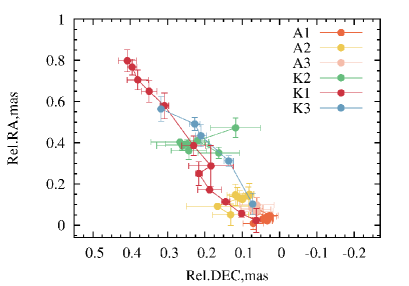
Features , , , and are rather stable in distance with respect to the core, although they show scatter in position angle that exceeds the uncertainties of the modeling. Jorstad et al. (2001) found that “stationary hot spots” are a common characteristic of compact jets, with the majority of such features located within a range of projected distances of 1-3 pc from the core. These authors propose three categories of models for stationary components in supersonic jets: a) standing recollimation shocks caused by imbalances between the pressure internal and external to the jet; b) sites of maximum Doppler beaming where the jet points most closely to the line of sight; and c) stationary oblique shocks, where the jet bends abruptly. We conclude that knots , , and fall most likely in category , since they are quasi-stationary with an observed “lifetime” of several months to a year. In addition, according to numerical simulations by Gómez et al. (1997), when a moving knot passes through a standing recollimation shock, the components blend into a single feature and split up after the collision with no changes in proper motion of the moving knot. This scenario seems to be observed in the case of approaching (Fig. 5). Knot , however, could be a trailing component that forms behind a strong shock (Agudo et al., 2001), since it is observed just after the appearance of the fast moving knot . The latter might change the internal pressure in the jet, resulting in the disappearance of knots and (see Fig. 5). Knot may belong to category , since the position angle of is different from that of , , and (Fig. 6) and the kinematics of moving knot changes in the vicinity of . In the case of a stationary feature produced at a bend in the jet, the proper motion of a moving knot approaching the stationary feature should decrease before and increase after the knot passes through the bend (Alberdi et al., 1993). Such a behavior can be inferred from Figure 5 when knot approaches and recedes from knot .
2.3. Gamma-ray Observations
The -ray emission from S5 0716+71 was detected throughout the entire period of Fermi observations starting in 2008 August, although most of the time at a level . We analyze the Fermi LAT data for the period of 2011 January-November with 2-day binning, as well as with 1-day binning and a 6-hour shift, during the huge -ray outburst of 2011 October, when the flux from the source was close to . This prevents missing any possible short-lived events, to make the correlation analysis more robust, and to avoid the dependence of the results on the start of the time bins. We use the standard Fermi analysis software package Science Tools v9r27p1, with the instrument response function P7SOURCE_V6, the Galactic diffuse emission model gal_2yearp7v6_v0, and the isotropic background model iso_p7v6source. The background models include all sources from the 2FGL within . The spectrum of S5 0716+71 as well as spectra of all background sources are modelled as a power-law with photon index fixed to the catalog values.
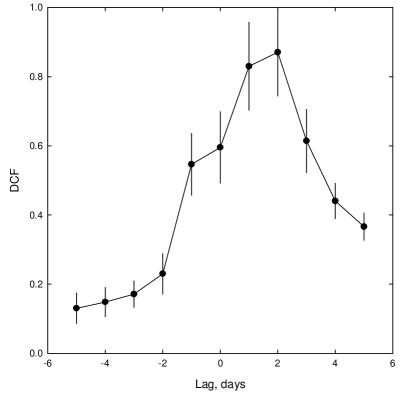
We calculate the discrete correlation function (DCF) (Edelson & Krolik, 1988) of the optical and -ray flux variations during 2011. The results are given in Fig. 7. Optical variations lag those at -ray energies by days (DCF centroid position).
3. Modeling of Photometric and Polarimetric Behavior
We suppose, following Marscher et al. (2008), that most of optical photometric and polarimetric variability arises when a compact emission region (e.g., a shock wave) propagates downstream from the black hole, following a spiral path. (Alternatively, the jet could have a helical geometry.) We notice that prominent optical outbursts are quite often both preceded and followed by minor flares. We interpret this phenomenon as a manifestation of the oscillating Doppler beaming of the emission (lighthouse effect, see Camenzind & Krockenberger (1992)). The observed series of outbursts correspond to the time intervals when the viewing angle of the shock wave is at a minimum.
The main parameters that determine the visible behavior of the outburst are:
-
•
jet viewing angle
-
•
bulk Lorentz factor of the shocked plasma
-
•
temporal evolution of the outburst ; the factor is responsible for different time scales of the rise and decline of the outburst; primed quantities refer to the plasma frame
-
•
Doppler time contraction in the observer’s frame,
-
•
shocked plasma compression = ratio of post-shock to pre-shock density
-
•
spectral index of the emitting plasma
-
•
pitch angle of the spiral motion and helical field
-
•
period of the shock’s spiral revolution in the observer’s frame .
The viewing angle of the compact emission region is obtained from the relation:
| (1) |
Relativistic aberration leads to a change in direction of the normal to the shock front :
| (2) |
If the unshocked magnetic field is chaotic upstream of the shock wave, the fractional polarization of the shocked plasma radiation (see, e.g., Hughes, Aller, & Aller, 1985) is:
| (3) |
and the position angle is determined by the direction of the projected minor axis of the shock wave:
| (4) |
The Doppler factor is given by
| (5) |
The periods of rotation in the source frame and observer’s frame are connected through the relation
| (6) |
where is the source’s redshift.
Knowledge of (from the timescale of recurrence of outbursts), estimates of and , obtained from analysis of radio images, and evaluation of the spiral’s radius allow us to constrain the values of and and to calculate the Doppler-contracted time in the observer’s frame, . Doppler boosting of the radiation from the shocked plasma, as a discrete source, leads to
| (7) |
We notice that in most cases when the source is in a quiescent state and no outburst is detected, there remains polarization at the level of . We assume that this is the polarized radiation of the ambient jet, presumably changing on substantially longer timescales (except possibly for random fluctuations due to turbulence in the jet). In the local frame the ratio is of the order of a few percent. The radiation from the undisturbed jet is also subject to Doppler boosting, and we (rather arbitrarily) set . Since the ambient jet is a roughly steady and continuous source, its radiation is amplified by . Notice that, in spite of the low value of , in the observer’s frame the boosted radiation of the shock may far exceed that of the ambient jet.
We add emission from the quasi-stationary features — probably standing shocks — whose fluxes become significant after the moving shock crosses them. We postulate that the temporal behavior of this added radiation is of the same form as that of the shock:
Here accounts for the ratio of the ambient jet to shock luminosity, with time delay . In our model we suppose that this radiation is added to the “constant” radiation of the jet, but not to its polarized part. Finally, the observed radiation of the jet is and total observed flux .
We consider a single variable source plus an initially constant source whose polarization vector is displaced relative to the jet direction by an angle (see, e.g., Marscher, 2010). Accounting for the contribution of this “constant” polarized source ( and ), we get the absolute Stokes parameters:
| (8) |
Finally, the normalized Stokes parameters are given by
| (9) |
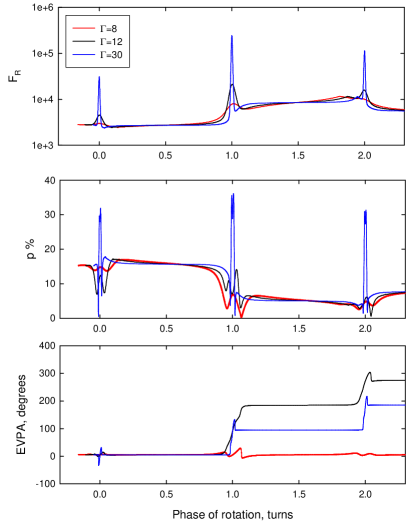
Figure 8 shows the dramatically different behavior of flux and polarization with all of the above mentioned parameters fixed, allowing only the Lorentz factor of the shock to change. We see that the model of a shock propagating in the helical path may in a natural way explain the successions of outbursts, often observed in blazar light curves, as a manifestation of a single event. A variety of observed patterns of photometric and polarimetric behavior may be explained by the interplay of the shock Lorentz factor, jet viewing angle, helical path pitch angle, and shape and length of the outburst. We do not take into account the light travel delay caused by the finite size of the shock wave; if included, this would result in some smoothing of the model light curve and polarization behavior.
4. Discussion and Conclusions
Quasi-periodic flares in the light curves of blazars are expected in models of magnetically launched jets, where the plasma moves with relativistic velocities following helical paths (Vlahakis, 2006). In light of this, it is rather surprising that numerous extensive observational campaigns have uncovered only a few cases that could be interpreted as a manifestation of a lighthouse effect from spiral relativistic motion, e.g., 3C 273 (catalog ) (, optical band Courvoisier et al., 1988); OJ 287 (catalog ) (, optical bands Wu et al., 2006); BL Lac (catalog ) (, optical photometry and polarimetry Hagen-Thorn et al., 2002); and AO 0235+16 ( in X-rays Rani et al., 2009). Radio variability tends to occur on timescales longer than these periods. However, radio mapping provides some picturesque examples of periodic structures that correspond to longer timescales in AGN jets, as in the case of PKS 0637-752 (catalog ) ( years Godfrey et al., 2012). As noted in Larionov et al. (2010), the jet might exhibit a fractal helical structure, where geometric scales that increase with distance from the central engine correspond to increasing variability timescales. Recent polarimetric studies of the nucleus of M87 (catalog ) (Perlman et al., 2011) have revealed strong variations of the polarization vector, synchronous with the flux variations, that can be interpreted as a manifestation of a shock propagating through a helical jet.
We have obtained densely sampled optical photometric and polarimetric data during an unprecedented -ray outburst in S5 0716+71, and analyzed the changes in the structure of the blazar at 43 GHz. We find a rotation of the position angle of linear polarization, which occurred at the epoch of maximum optical brightness. This event would have been missed if our observations did not occur consecutively from 3 sites (St. Petersburg, Crimea, Arizona). This implies that such events may be rather common during blazar flares.
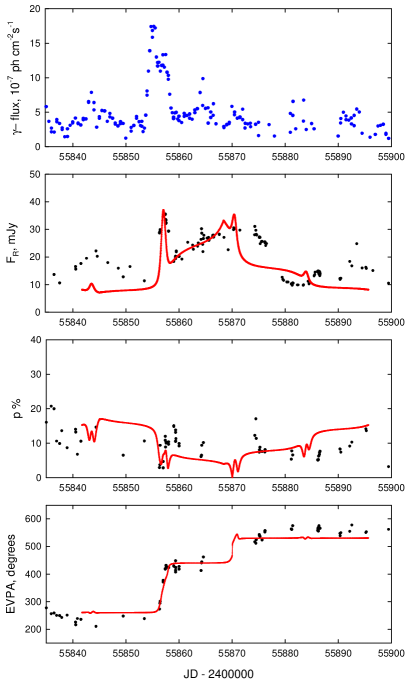
Figure 9 shows the time evolution of the observational parameters (-ray and optical flux, degree of polarization and positional angle) within the model discussed above. Values of the adjustable parameters are listed in Table 2. Several of the trends of the data resemble similar features in the model flux and polarization curves. Particularly, we see a succession of quasi-periodic flares before and after the main outburst (marked with vertical arrows in Fig 2) and fast oscillation of the degree of polarization around the main flare. This conforms with the model presented here. Turbulence may play a role in modulating the behavior (e.g., the discrepant flux and degree of polarization near MJD 55675) beyond the capabilities of the simplified model proposed here.
| ,% | |||||||||||||||
|---|---|---|---|---|---|---|---|---|---|---|---|---|---|---|---|
| (1) | (2) | (3) | (4) | (5) | (6) | (7) | (8) | (9) | (10) | (11) | (12) | (13) | (14) | (15) | (16) |
| 5.8 | 7.5 | 22 | 1.8 | 10 | 0.0095 | 13.2 | 1.5 | 0.47 | 0.11 | 0.06 | 132 | 1.1 | 1.50 | 0.47 | 10 |
Note. — Units of are parsecs, – days, – years. , and are fractions of .
The -ray outburst started 4 before the optical, which corresponds to pc distance in the source frame. The emergence of knot K3 at the same time as the optical/-ray outburst leads to the conclusion that these events were co-spatial. However, we note that our model uses a lower Lorentz factor of the shock wave () and a wider viewing angle () than that obtained from the radio images (). This could reflect acceleration of the plasma flow in the jet downstream from the regions where the optical/-ray outburst took place (see, e.g., Homan et al., 2009).
References
- Agudo et al. (2001) Agudo, I., Gómez, J.-L., Martí, J.-M., et al. 2001, ApJ, 549, L183
- Alberdi et al. (1993) Alberdi, A., Marcaide, J. M., Marscher, A. P., et al. 1993, ApJ, 402, 160
- Blinov et al. (2011) Blinov, D., Morozova, D., & Larionov, V. 2011, The Astronomer’s Telegram, 3700, 1
- Bychkova et al. (2006) Bychkova, V. S., Kardashev, N. S., Boldycheva, A. V., Gnedin, Y. N., & Maslennikov, K. L. 2006, Astronomy Reports, 50, 802
- Camenzind & Krockenberger (1992) Camenzind, M., & Krockenberger, M. 1992, A&A, 255, 59
- Chen et al. (2008) Chen, A. W., D’Ammando, F., Villata, M., et al. 2008, A&A, 489, L37
- Courvoisier et al. (1988) Courvoisier, T. J.-L., Robson, E. I., Hughes, D. H., et al. 1988, Nature, 335, 330
- Edelson & Krolik (1988) Edelson, R. A., & Krolik, J. H. 1988, ApJ, 333, 646
- Ghisellini et al. (1997) Ghisellini, G., Villata, M., Raiteri, C. M., et al. 1997, A&A, 327, 61
- Godfrey et al. (2012) Godfrey, L. E. H., Lovell, J. E. J., Burke-Spolaor, S., et al. 2012, ApJ, 758, L27
- Gómez et al. (1997) Gomez, J. L., Marti, J. M. A., Marscher, A. P., Ibanez, J. M. A., & Alberdi, A. 1997, ApJ, 482, L33
- Hagen-Thorn et al. (2002) Hagen-Thorn, V. A., Larionov, V. M., Jorstad, S. G., & Larionova, E. G. 2002, AJ, 124, 3031
- Hagen-Thorn et al. (2006) Hagen-Thorn, V. A., Larionov, V. M., Efimova, N. V., et al. 2006, Astronomy Reports, 50, 458
- Homan et al. (2009) Homan, D. C., Kadler, M., Kellermann, K. I., et al. 2009, ApJ, 706, 1253
- Hughes, Aller, & Aller (1985) Hughes, P. A., Aller, H. D., & Aller, M. F., 1985, ApJ, 298, 301
- Ikejiri et al. (2011) Ikejiri, Y., Uemura, M., Sasada, M., et al. 2011, PASJ, 63, 639
- Jorstad et al. (2001) Jorstad, S. G., Marscher, A. P., Mattox, J. R., et al. 2001, ApJS, 134, 181
- Jorstad et al. (2005) Jorstad, S. G., Marscher, A. P., Lister, M. L., et al. 2005, AJ, 130, 1418
- Larionov et al. (2008) Larionov, V., Konstantinova, T., Kopatskaya, E., et al. 2008, The Astronomer’s Telegram, 1502
- Larionov et al. (2010) Larionov, V. M., Villata, M., & Raiteri, C. M. 2010, A&A, 510, A93
- Marscher et al. (2008) Marscher, A. P., Jorstad, S. G., D’Arcangelo, F. D., et al. 2008, Nature, 452, 966
- Marscher (2010) Marscher, A. P. 2010, Jets in Active Galactic Nuclei, in Lecture Notes in Physics, ed. T. Belloni, Berlin Springer Verlag, 794, arXiv:0909.2576
- Marscher (2012) Marscher, A. P. 2012, International Journal of Modern Physics Conference Series, 8, 151
- Nilsson et al. (2008) Nilsson, K., Pursimo, T., Sillanpää, A., Takalo, L. O., & Lindfors, E. 2008, A&A, 487, L29
- Ostorero et al. (2006) Ostorero, L., Wagner, S. J., Gracia, J., et al. 2006, A&A, 451, 797
- Perlman et al. (2011) Perlman, E. S., Adams, S. C., Cara, M., et al. 2011, ApJ, 743, 119
- Raiteri et al. (2003) Raiteri, C. M., Villata, M., Tosti, G., et al. 2003, A&A, 402, 151
- Rani et al. (2009) Rani, B., Wiita, P. J., & Gupta, A. C. 2009, ApJ, 696, 2170
- Rastorgueva et al. (2011) Rastorgueva, E. A., Wiik, K. J., Bajkova, A. T., et al. 2011, A&A, 529, A2
- Stalin et al. (2006) Stalin, C. S., Gopal-Krishna, Sagar, R., et al. 2006, MNRAS, 366, 1337
- Stalin et al. (2009) Stalin, C. S., Kawabata, K. S., Uemura, M., et al. 2009, MNRAS, 399, 1357
- Uemura et al. (2010) Uemura, M., Kawabata, K. S., Sasada, M., et al. 2010, PASJ, 62, 69
- Villata et al. (2008) Villata, M., Raiteri, C. M., Larionov, V. M., et al. 2008, A&A, 481, L79
- Vlahakis (2006) Vlahakis, N. 2006, in Blazar Variability Workshop II: Entering the GLAST Era, ed. H. R. Miller, K. Marshall, J. R. Webb, & M. F. Aller, Astron. Soc. Pacific Conf. Ser., 350, 169
- Wagner et al. (1996) Wagner, S. J., Witzel, A., Heidt, J., et al. 1996, AJ, 111, 2187
- Wu et al. (2006) Wu, J., Zhou, X., Wu, X.-B., et al. 2006, AJ, 132, 1256