A Model-Based Analysis of GC-Biased Gene Conversion
in the Human and Chimpanzee Genomes
1Gladstone Institutes, University of California, San Francisco, CA
94158, USA
2Dept. of Biological Statistics and Computational Biology, Cornell
University, Ithaca, NY 14853, USA
3 Depts. of Developmental Biology and Computational & Systems Biology, University of Pittsburgh, Pittsburgh, PA 15201 USA
4Institute for Human Genetics and Division of Biostatistics, University
of California, San Francisco, CA 94107, USA
aCurrent Address: Dept. of Biomedical Informatics and Center for Human Genetics Research, Vanderbilt University,
Nashville, TN 37232 USA
†These authors contributed equally to this work.
∗To whom correspondence should be addressed; E-mail:
acs4@cornell.edu; kpollard@gladstone.ucsf.edu.
Abstract
GC-biased gene conversion (gBGC) is a recombination-associated process that favors the fixation of G/C alleles over A/T alleles. In mammals, gBGC is hypothesized to contribute to variation in GC content, rapidly evolving sequences, and the fixation of deleterious mutations, but its prevalence and general functional consequences remain poorly understood. gBGC is difficult to incorporate into models of molecular evolution and so far has primarily been studied using summary statistics from genomic comparisons. Here, we introduce a new probabilistic model that captures the joint effects of natural selection and gBGC on nucleotide substitution patterns, while allowing for correlations along the genome in these effects. We implemented our model in a computer program, called phastBias, that can accurately detect gBGC tracts 1 kilobase or longer in simulated sequence alignments. When applied to real primate genome sequences, phastBias predicts gBGC tracts that cover roughly 0.3% of the human and chimpanzee genomes and account for 1.2% of human-chimpanzee nucleotide differences. These tracts fall in clusters, particularly in subtelomeric regions; they are enriched for recombination hotspots and fast-evolving sequences; and they display an ongoing fixation preference for G and C alleles. We also find some evidence that they contribute to the fixation of deleterious alleles, including an enrichment for disease-associated polymorphisms. These tracts provide a unique window into historical recombination processes along the human and chimpanzee lineages; they supply additional evidence of long-term conservation of megabase-scale recombination rates accompanied by rapid turnover of hotspots. Together, these findings shed new light on the evolutionary, functional, and disease implications of gBGC. The phastBias program and our predicted tracts are freely available.
Introduction
Gene conversion is the nonreciprocal exchange of genetic information from a ‘donor’ to an ‘acceptor’ sequence, primarily resulting from the repair of mismatched bases in heteroduplex recombination intermediates during meiosis [1]. In many cases, the process of resolving mismatches between G/C (guanine or cytosine; denoted ‘strong’ or ‘S’) and A/T (adenine and thymine; ‘weak’ or ‘W’) alleles appears to be biased in favor of S alleles [2, 1, 3]. Such GC-biased gene conversion (gBGC) elevates the fixation probabilities for S alleles relative to W alleles at positions of W/S polymorphism, and if it acts in a recurrent manner over a sufficiently long time, it can result in a significant excess of WS over SW substitutions and a consequent increase in equilibrium GC content. It has been known since the 1980s both that gene conversion occurs in various eukaryotes [4] and that mismatch repair can be significantly biased [5]. As complete genome sequences have become widely available, evidence has accumulated that gBGC played an important role in genomic evolution across many branches of the tree of life. In particular, it is likely that gBGC significantly influenced the genomic distribution of GC content, the fixation of deleterious mutations, and rapidly evolving sequences in many species [6, 7, 8, 9, 10, 11, 12, 13].
Aside from limited experimental evidence of a GC-bias in meiosis, mostly from yeast, much of what is known about gBGC comes from two indirect sources of information: global patterns of variation within or between species suggesting a fixation bias favoring S alleles [14, 15, 11, 16, 12] and the existence of numerous loci exhibiting dense clusters of substitutions with a pronounced WS bias [7, 8, 9, 13]. Both types of evidence correlate strongly with recombination rates, consistent with a cause from gBGC, although other recombination-associated factors might also contribute [15]. However, these observations provide limited information about the general prevalence, strength, and functional consequences of gBGC in humans and other mammals. Genome-wide patterns of variation are influenced by diverse forces that act in a highly heterogeneous manner across the genome, and it is difficult to measure the specific contribution of gBGC. Clusters of biased substitutions provide more direct evidence of a local influence from gBGC. So far, however, such clusters have been identified by considering either genomic windows of fixed size or pre-identified genomic segments (such as protein-coding exons or fast-evolving noncoding regions), which has limited the regions that can be detected. In addition, many studies have focused on small numbers of clusters showing extreme substitution rates and WS biases.
For modelers of molecular evolution, gBGC is an anomaly—a process separate and distinct from the fundamental processes of mutation, recombination, drift, and selection that underlie most models, yet one with the potential to profoundly influence patterns of variation within and between species. Like selection, gBGC acts in the window between the emergence of genetic polymorphism due to mutation and its elimination due to the fixation or loss of derived alleles. Unlike selection, however, gBGC is neutral with respect to fitness. The influence of gBGC at individual nucleotides can be modeled approximately by treating it as a selection-like force that depends only on whether a new mutation is WS, SW, or neither [17, 15, 13]. However, this approach ignores the close association of gBGC with the notoriously difficult-to-model process of recombination, which leads to a complex correlation structure along the genome (i.e., gBGC “tracts” separated by regions of no gBGC). Owing to these difficulties, with only a few exceptions [9, 13], gBGC has been ignored in phylogenetic or population genetic models, and considered at most in post hoc analyses (e.g., by examining identified genomic regions for an excess of WS substitutions). These approaches are clearly limited in efficiency and effectiveness, and there is a need for improved models of gBGC that can be applied on a genome-wide scale. There is also a need for high quality annotations of gBGC-affected regions for use by investigators when interpreting comparative and population genomic analyses.
Another reason to develop improved models of gBGC is that gBGC-induced nucleotide substitutions provide a unique window into historical recombination processes, by serving as a proxy for average recombination rates along a lineage of interest. By contrast, the other main sources of information about recombination—sperm typing [18], genotypes for known pedigrees [19], and patterns of linkage disequilibrium in present-day populations [20]—provide information about recombination that goes back no farther than the coalescence time between individuals. Pronounced differences between the human and chimpanzee recombination maps suggest that recombination rates in hominoids have changed rapidly [21, 22, 23]. gBGC may provide useful information about the recombination processes during the critical period between the divergence of humans and chimpanzees (4–6 million years ago [Mya]) and the coalescence time for human individuals (1 Mya, on average). (Archaic hominin genome sequences are of limited use for this purpose, because they are still few in number and would extend coalescence times only slightly.)
In this article, we address these issues by introducing a novel model-based approach for the identification of gBGC tracts. Our approach makes use of statistical phylogenetic models that jointly consider gBGC and natural selection [13]. In addition, it approximates the recombination-associated correlation structure of gBGC along the genome using a hidden Markov model. We have implemented this approach in a computer program called phastBias, which is available as part of the open-source PHylogenetic Analysis with Space/Time models (PHAST) software package (http://compgen.bscb.cornell.edu/phast) [24]. Using simulations, we show that phastBias can identify tracts of various lengths from unannotated multiple alignments with good power. We then analyze genome-wide predictions of gBGC tracts in the human and chimpanzee genomes, comparing them with recombination rates, patterns of polymorphism, functional elements, fast-evolving sequences, and other genomic features. This analysis sheds light on the prevalence and fitness consequences of gBGC, and on recombination processes during the time since the human/chimpanzee divergence. Our predictions of gBGC tracts are freely available as browser tracks (http://genome-mirror.bscb.cornell.edu). We anticipate that these tracks will be useful for avoiding false positives in scans for positive selection, understanding the evolution of specific loci, and investigating the broader evolutionary forces shaping the human genome.
Results
Probabilistic Model
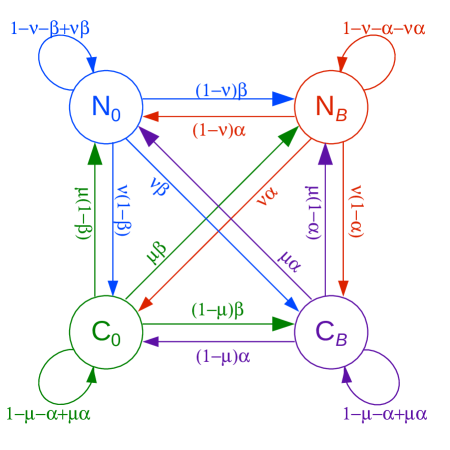
We model gBGC tracts using a phylogenetic hidden Markov model (phylo-HMM) with four states, representing all combinations of gBGC or no gBGC in a specified “target” genome (e.g., human or chimpanzee), and of evolutionary conservation or no evolutionary conservation across the phylogeny (Figure 1; Methods). The phylo-HMM framework [25] allows the distinct rates and patterns of nucleotide substitution for each state to be described using a full statistical phylogenetic model, and it captures the pronounced correlations along the genomes in these patterns using a first-order Markov model. Our phylo-HMM can be thought of as a straightforward generalization of the two-state model used by the phastCons program for prediction of evolutionarily conserved elements [26] that additionally predicts gBGC tracts in the target genome. We directly consider evolutionary conservation together with gBGC because the dramatic reduction in substitution rates in functional elements would otherwise be a confounding factor in the identification of gBGC tracts. The model allows conserved elements and gBGC tracts to overlap or occur separately. The joint effects of gBGC and selection are modeled by treating gBGC as a selection-like force that specifically favors the fixation of G and C alleles, as in other recent work. In particular, the influence of selection is described using a population-scaled selection coefficient, , and the influence of gBGC is described using an analogous population-scaled GC-disparity parameter, (where is the effective population size) [13] (see also [17, 15]). The parameter measures the strength of gBGC, and values cause WS substitution rates to increase and SW substitution rates to decrease. A key feature of our approach is that it permits identification of gBGC tracts of any length based on characteristic substitution patterns, independent of predefined windows or genomic annotations.
Because the signal for gBGC in the data is typically quite weak, we make several assumptions to reduce the complexity of the model. Briefly, we model negative selection as uniformly decreasing evolutionary rates on all lineages, we ignore positive selection, and we assume that the disparity parameter is the same for all gBGC tracts. In addition, we pre-estimate the parameters describing the neutral phylogeny and evolutionary conserved elements using restricted models, we fix the tract-length parameter based on our prior expectation for tract lengths, and we treat the parameter as a “tuning” parameter to be set by trial and error (see summary of model parameters in Table 1). Our simulation study indicates that fairly high accuracy in tract prediction is possible despite these simplifying assumptions and approximations (see below and Methods for details). We have implemented our model in a program called phastBias in the PHAST package [24]. PhastBias makes use of existing features in PHAST for alignment processing, phylogenetic modeling, efficient HMM-based inference, and browser track generation.
Simulation Study
While the absence of high-quality annotations of gBGC tracts makes it difficult to assess prediction accuracy, we are able to gain some insight into the performance of phastBias using simulated data. To make our simulated data as realistic as possible, we started with real genome-wide alignments, and simulated new human sequences only, using our phylogenetic model to define neutral and conserved sequences, and interspersed gBGC tracts of fixed lengths (see Methods). This strategy ensures that features such as variation in mutation rates, changes in equilibrium GC content, conserved elements, indels, alignment errors, and missing data are all retained in the nonhuman sequences. We used phastBias to predict human-specific tracts based on these partially simulated alignments and compared our predictions with the “true” tracts assumed during simulation. We found that the nucleotide-level false positive rate was always very low in these experiments ( / bp), so we measured the specificity of our predictions using the nucleotide-level positive predictive value (PPV), defined as the fraction of all bases predicted to be in gBGC tracts that truly belong in gBGC tracts. As a measure of power, we used the nucleotide-level true positive rate (TPR), the fraction of bases in true gBGC tracts that were correctly predicted as being in tracts.
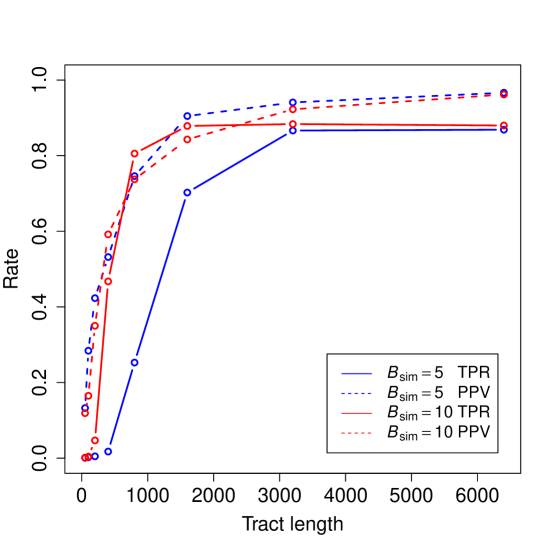
First, we explored the performance of phastBias on simulated gBGC tracts of various lengths, generated with several different values of the GC-disparity parameter (denoted ). Under our model, increasing produces tracts with more substitutions and greater GC bias in their substitution patterns. As expected, both our power to detect gBGC and the specificity of our predictions increases with the lengths of the true tracts and with (Figure 2). We found that power and specificity were both quite good for tracts of 1,000–1,500 bases or longer, provided gBGC is reasonably strong (). Current estimates of the lengths and GC-disparity of real gBGC tracts [27, 8] suggest that phastBias should have good power for many tracts (see Discussion).
Next, we examined the influence on prediction performance of our choice of the tuning parameters for expected tract-length () and gBGC strength (). We found that the performance of the method was not highly sensitive to the value of , so we decided to fix the expected tract length at 1 kilobase (kb) (by setting ) based on empirical evidence indicating that mammalian gene conversion tracts are approximately this size [1, 27]. By contrast, the choice of had a much stronger influence on the observed prediction performance. Power was highest for small values of , regardless of the value used to simulate the tracts () (Supplementary Figure S1). However, this increase in power comes at only a modest cost in PPV, which remains fairly high (90%) except when the elements are both short and under weak gBGC (e.g., mean lengths of 100, ). These results suggest that phastBias is inherently somewhat conservative with its predictions, and that setting to a relatively low value helps to improve sensitivity for tracts having a range of true gBGC intensities, at minimal cost in specificity.
Predicted gBGC Tracts
We applied phastBias to genome-wide alignments of the human, chimpanzee, orangutan, and rhesus macaque genomes, and used it to predict tracts in the human and chimpanzee genomes likely to have experienced gBGC since the divergence of these two species 4–6 Mya (see Methods). In separate runs, we selected either the human or the chimpanzee genome as the “target,” and we set the tuning parameter to values of 2, 3, 4, 5, and 10 (in increasing strength of gBGC). As expected from our simulation study, the number, lengths, and genomic coverage of the predicted tracts depend fairly strongly on the choice of . In particular, coverage decreases from more than 1% to 0.07% as is increased from 2 to 10 (Table 2). Because the tracts predicted with high are largely found within those predicted with lower (Supplementary Table S2 and because a value of appears to result in good power while controlling false positives (see above), we will focus on the tracts predicted with for the remainder of the article. The absolute sensitivity of these predictions of course depends on unknown properties of true gBGC tracts, but our simulation experiments indicate that power is fairly good, at least for the subset of tracts 1 kb in length with a reasonably pronounced GC-disparity (Figure 2).
With , the predictions for the human genome include 9,439 gBGC tracts covering 0.33% of the genome (Table 2). These predicted tracts average 1,018 bp in length (median 788 bp), consistent with our choice of , but they display a fairly broad length distribution (Supplementary Figure S2), indicating that our choice of tuning parameters is not overly restrictive. Most predicted tracts contain exclusively or predominantly WS substitutions (Supplementary Figure S3). The statistics for the chimpanzee genome are similar, but in this case there are somewhat fewer tracts (8,677), their lengths are reduced (mean = 842 bp, median = 663 bp), and genomic coverage is about 25% lower (at 0.25%). The reduced coverage of the chimpanzee genome holds even if we consider only tracts that completely fall within regions of high-quality, syntenic alignment between the two genome assemblies. These differences between the human and chimpanzee predictions could reflect differences between species in the degree to which recombination events are concentrated in recombination hotspots [23] (see Discussion).
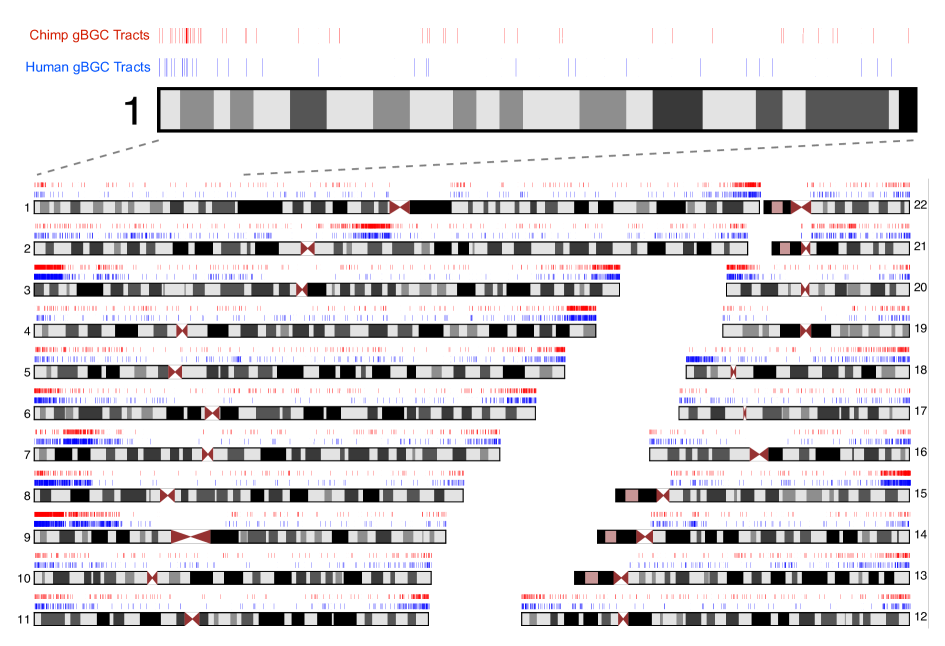
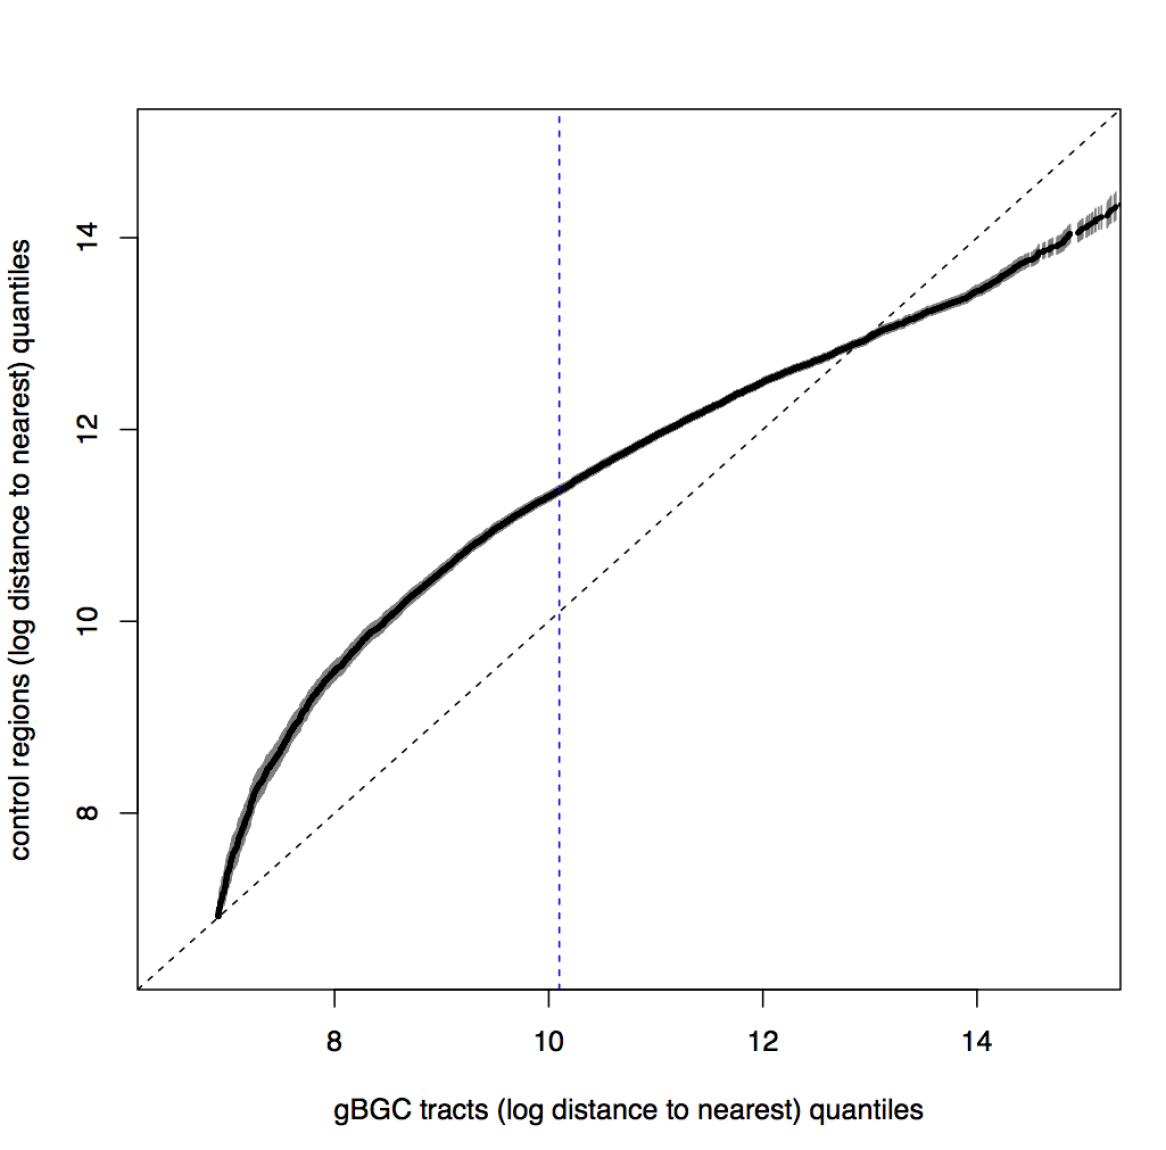
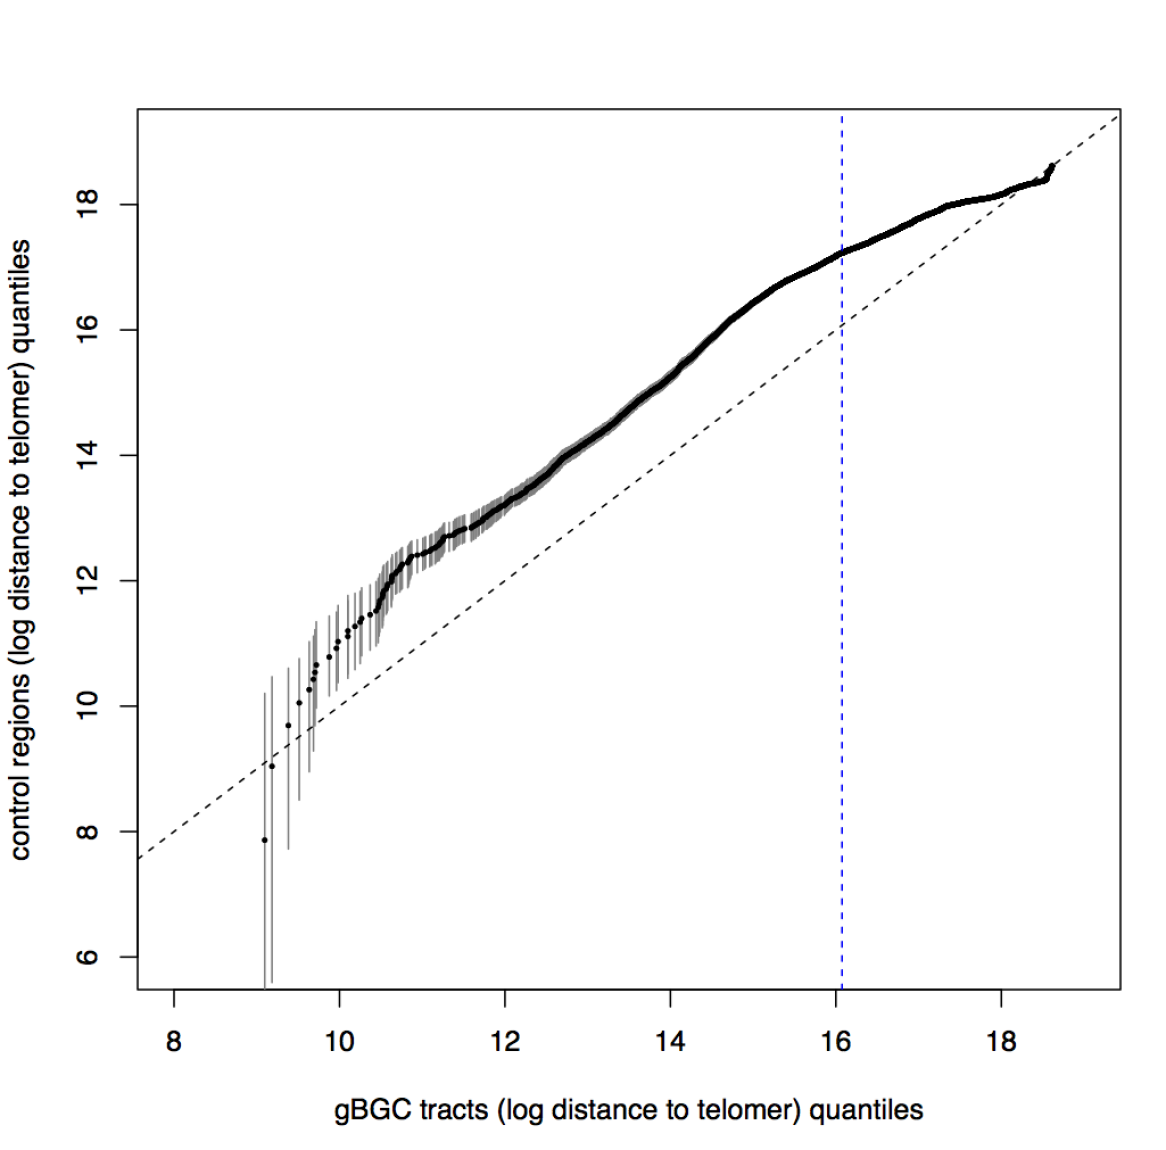
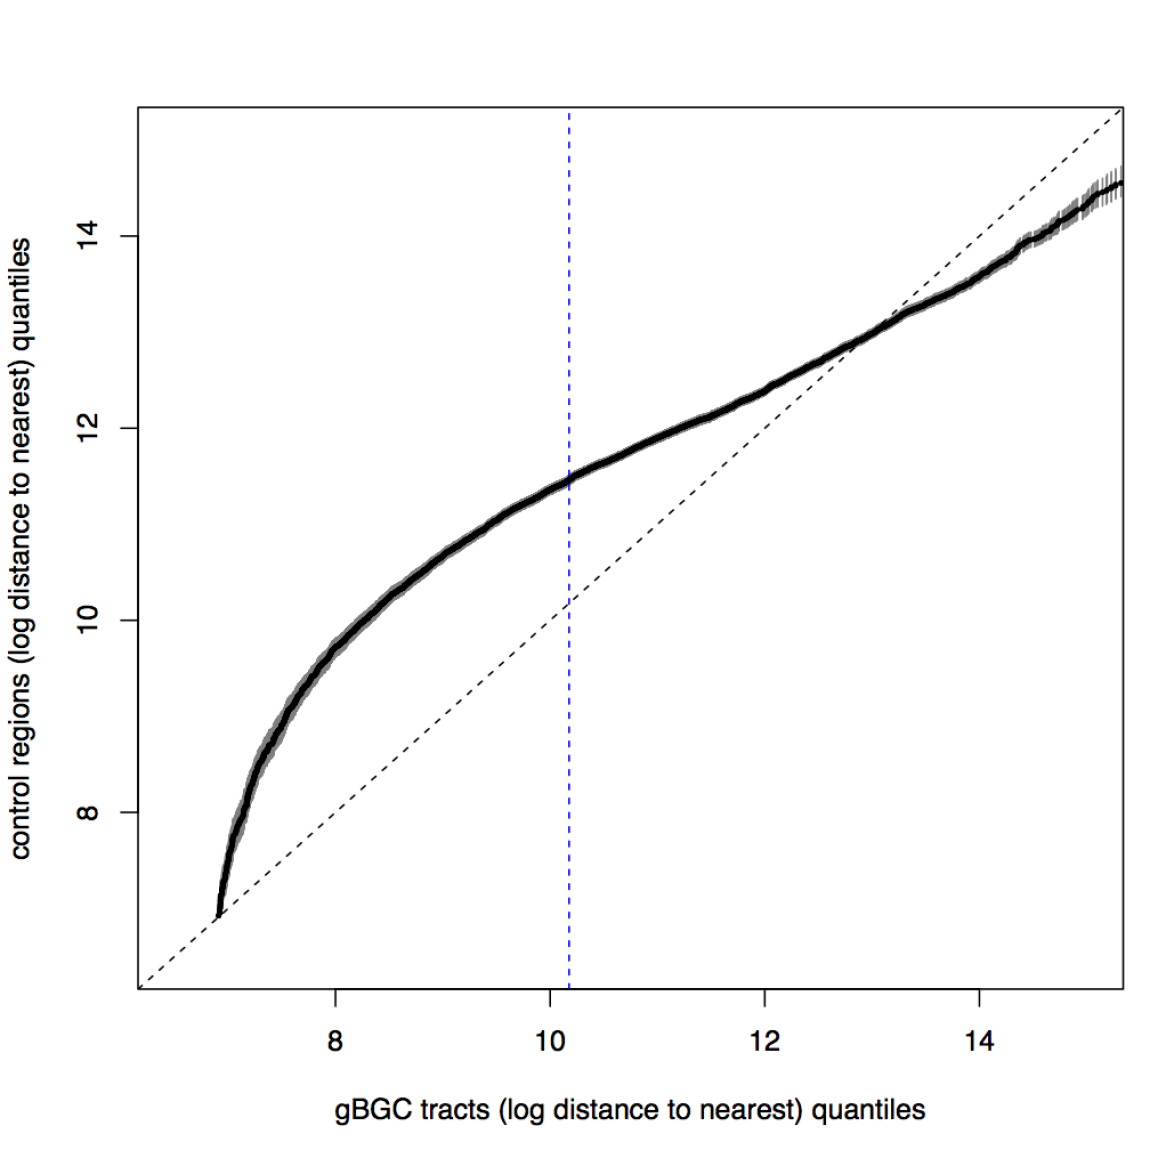
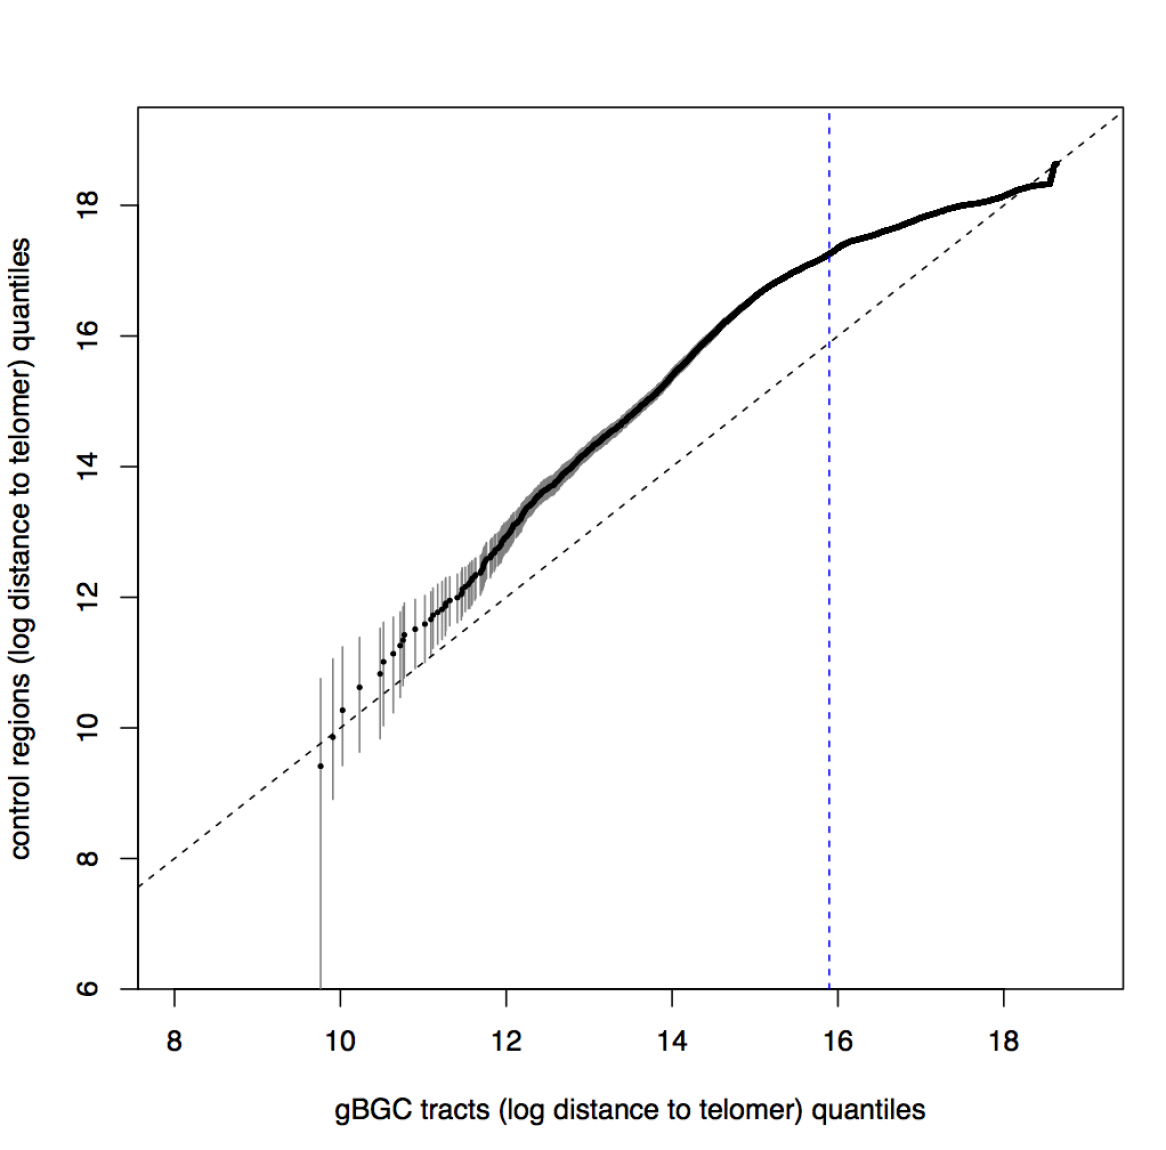
The human predictions are distributed across the human genome but show a clear tendency to cluster near the ends of chromosomes (Figure 3), consistent with previous findings [14, 28, 12]. The median distance from the nearest telomere is only about one third that observed for a set of GC-content-matched control regions (9.6 megabases (Mb) vs. an average of 30.4 Mb over 1000 replicates, ; see Methods and Supplementary Figure S4). Similarly, the median distance between tracts is less than one third that for the controls, even after merging tracts 1 kb apart to account for possible biases from the HMM-based prediction method (24.3 kb vs. an average of 86.0 kb, ). In addition to the clusters of tracts near present-day telomeres, there is an obvious cluster near the centromere of chromosome 2, reflecting the telomeres of two ancestral chromosomes that fused at this site sometime after the human/chimpanzee divergence [29, 14]. The genomic distribution of the predicted tracts in chimpanzee is generally similar to that in human (Figure 3, Supplementary Material).
Together, the human and chimpanzee tracts account for about 1.2% of all human/chimpanzee nucleotide differences apparent in our genome-wide alignments (435,729 differences). About half (214,195) of the nucleotide differences within the tracts can be confidently explained by WS substitutions on either the human or chimpanzee lineage, of which slightly more than half (115,699) fall on the human lineage. Thus, even with our limitations in power, our predictions suggest a non-negligible influence of gBGC on overall levels of human/chimpanzee nucleotide divergence.
Recombination Rates
The predicted human gBGC tracts are substantially enriched for recombination hotspots from the HapMap project [30]: 1,228 (13%) overlap a hotspot, compared with an average of 796 for the control regions (). In addition, the average recombination rate [31] within these tracts is more than twice the rate in the control regions (3.85 centimorgans per megabase (cM/Mb) vs. 1.61 cM/Mb, ; Table 3). A parallel analysis of the chimpanzee gBGC tracts based on the genome-wide recombination rate map from the PanMap Project [23] showed, similarly, that recombination rates in predicted gBGC tracts were more than twice as high as in control regions (Table 3). Pedigree-based human recombination maps [19] produced similar results (data not shown).
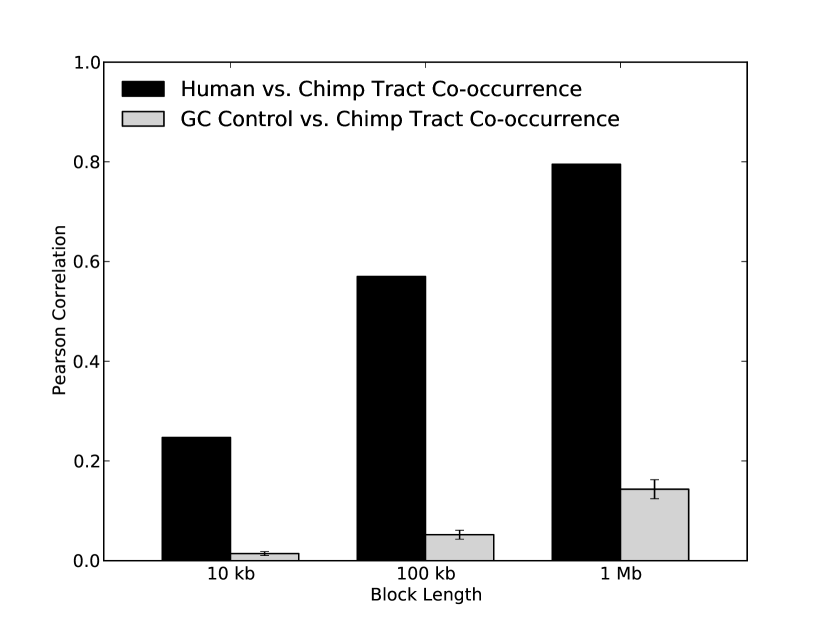
At fine scales, the human and chimpanzee tracts show a modest, but significant, degree of overlap (Figure 3): 605 (6.4%) of the human tracts directly overlap a chimpanzee tract, compared with an average of 86 for the control regions (). Shared recombination hotspots account for only a small minority (1%) of the overlapping tracts. However, the correlation in tract locations between species is much stronger at broader scales. For example, if the fractions of nucleotides in gBGC tracts are compared in orthologous genomic blocks of various sizes, the human/chimpanzee Pearson’s correlation increases from for 10 kb blocks to for 100 kb blocks, and to for 1 Mb blocks (Supplementary Figure S5). These observations mirror those for human and chimpanzee recombination rates, which correlate well at scales of 1 Mb or larger but much more poorly at finer scales [21, 22, 23].
To gain further insight into the conservation of the gBGC tracts, we mapped the human gBGC tracts to orthologous locations in the chimpanzee genome, and the chimpanzee tracts to orthologous locations in the human genome. We then compared the recombination rates in these “ortho-tracts” with those in control regions, as with the tracts predicted for each species. Unlike recombination hotspots [23], the predicted gBGC tracts show significantly elevated recombination rates at orthologous positions in the other species (Table 3). However, these recombination rates are not nearly as elevated as those in the genome in which the tracts were predicted. Together, these observations indicate that, while the human and chimpanzee gBGC tracts are only weakly correlated, they nevertheless exhibit residual correlation beyond what is observed with present-day recombination rates, probably because they reflect average recombination rates over millions of years (see Discussion).
In both human and chimpanzee, the predicted tracts show a weak positive correlation with GC-content on a megabase scale. This correlation is somewhat stronger for human (Pearson’s correlation for 1 Mb blocks: ) than for chimpanzee (), mirroring observations of a stronger correlation of recombination rate with GC-content in human than in chimpanzee [23].
Genomic Annotations
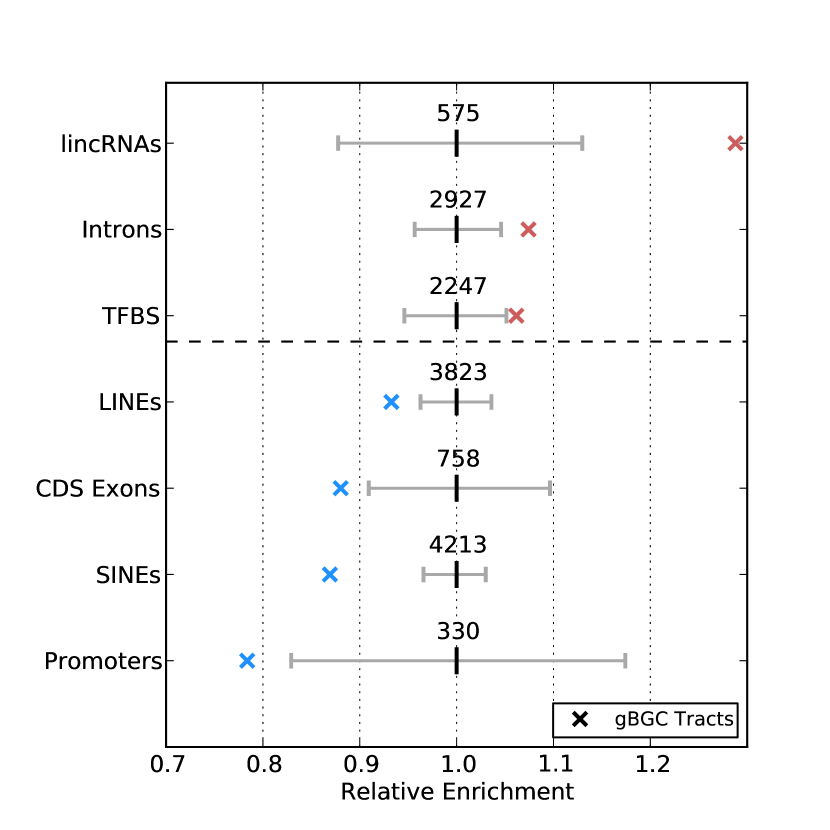
To shed light on the functional implications of gBGC, we examined the degree of overlap of the predicted human gBGC tracts with various sets of genomic annotations (listed in Methods). In comparison with the control regions, we found that the human gBGC tracts were significantly depleted for overlap with known protein-coding exons, core promoters (1 kb upstream of annotated transcription start sites), miscellaneous RNAs, LINEs and SINEs, while they were significantly enriched for overlap with introns, lincRNAs, and a collection of ChIP-seq-supported transcription factor binding sites (Supplementary Figure S6). However, all of these enrichments and depletions were modest in magnitude, with fold-changes of about 0.8–1.3. Overall, the gBGC tracts appear to be fairly representative of sequences of the same GC content. It is possible that the depletion for gBGC tracts in protein-coding exons and promoters could result in part from strong purifying selection counteracting GC-biased fixation.
GC-Bias in Derived Alleles
To distinguish between fixation- and mutation-related biases, we compared the derived allele frequencies at polymorphic WS and SW sites in the predicted tracts and control regions. To control for the possibility of an ascertainment bias from polymorphic sites at which the derived allele is present in the human reference genome, we performed this analysis twice: once with the original gBGC tracts, and once with predictions based on alignments in which polymorphic sites in the human genome had been masked with ‘N’s.
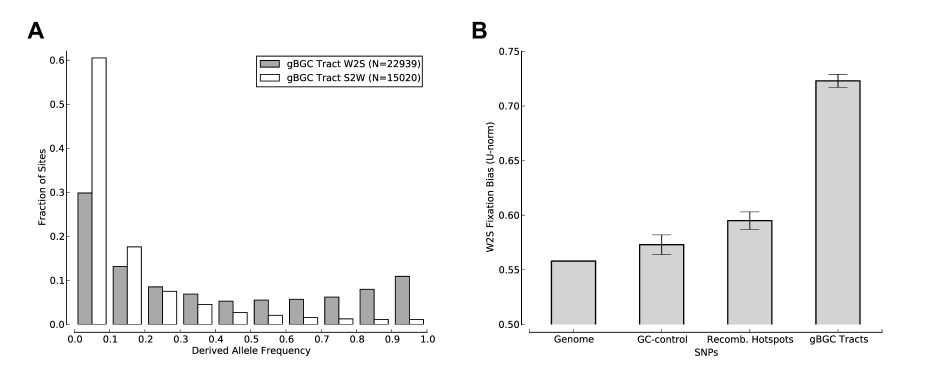
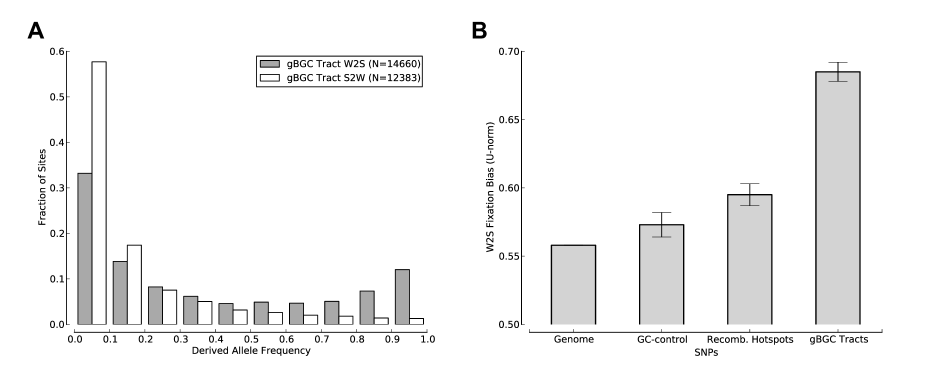
Based on data from the 1000 Genomes Project [31] (YRI population), the predicted gBGC tracts displayed significantly elevated derived allele frequencies at sites of inferred WS mutations compared with sites of inferred SW mutations (WS DAF skew of 0.723 0.006; Figure 4A). This skew in DAFs was significantly greater than that observed genome-wide (0.558 0.001) or in recombination hotspots (0.595 0.008; Figure 4B), and it was larger than observed in any of the 1000 control region replicates (0.573 0.009). The tracts are also far more biased than any of the regions considered by Katzman et al. [16], which were identified using sliding windows of fixed size and likely contained a mixture of gBGC tracts and non-tracts. Results were similar for the CEU (0.703 0.007) and CHB-JPT populations (0.678 0.008). These results held for the tracts based on the polymorphism-masked alignments, although the magnitude of the skew was somewhat reduced in this case (0.685 0.007 for YRI; Supplementary Figure S7). Together, these results strongly indicate an on-going preference for the fixation of G and C alleles in the predicted gBGC tracts.
Fixation of Deleterious Alleles
Theoretical modeling has shown that gBGC, in principle, can overcome negative selection and result in the fixation of weakly deleterious alleles [8, 3, 10]. However, there is currently little direct empirical evidence of a contribution of gBGC to fixed or segregating deleterious alleles [11]. Our genome-wide tract predictions enabled us to investigate the link between gBGC and deleterious alleles in two ways: by testing for enrichments for disease-associated genomic regions in gBGC tracts, and by examining evidence of purifying selection in orthologous regions of other mammalian genomes.
First, we examined the relationship between the gBGC tracts and four sets of putatively disease-associated genomic regions: 10,711 polymorphic sites from dbSNP annotated as “pathogenic” or “probable pathogenic” [32]; 43,952 polymorphic sites from the Human Gene Mutation Database (HGMD) [33] (see also [11]); 11,444 genomic regions from the Genetic Association Database (GAD) [34]; and 6,435,165 polymorphic sites with evidence of functional importance (classes 1–5) in RegulomeDB [35]. For the dbSNP pathogenic and HGMD comparisons, we considered sets of control regions that overlapped the same number of exonic SNPs as the gBGC tracts. This control is designed to avoid misleading findings of significance that simply reflect the GC content, exon coverage, and/or rates of polymorphism in the gBGC tracts, since these disease-associated region sets are mostly found in coding regions. Similarly, we used control regions matched to SNPs considered by RegulomeDB, since it only includes non-coding SNPs (Methods). We found that the gBGC tracts overlapped significantly more putatively disease-related SNPs from the dbSNP, HGMD, and RegulomeDB collections, and significantly more of the GAD regions, than did the matched control regions (Table 4; for each).
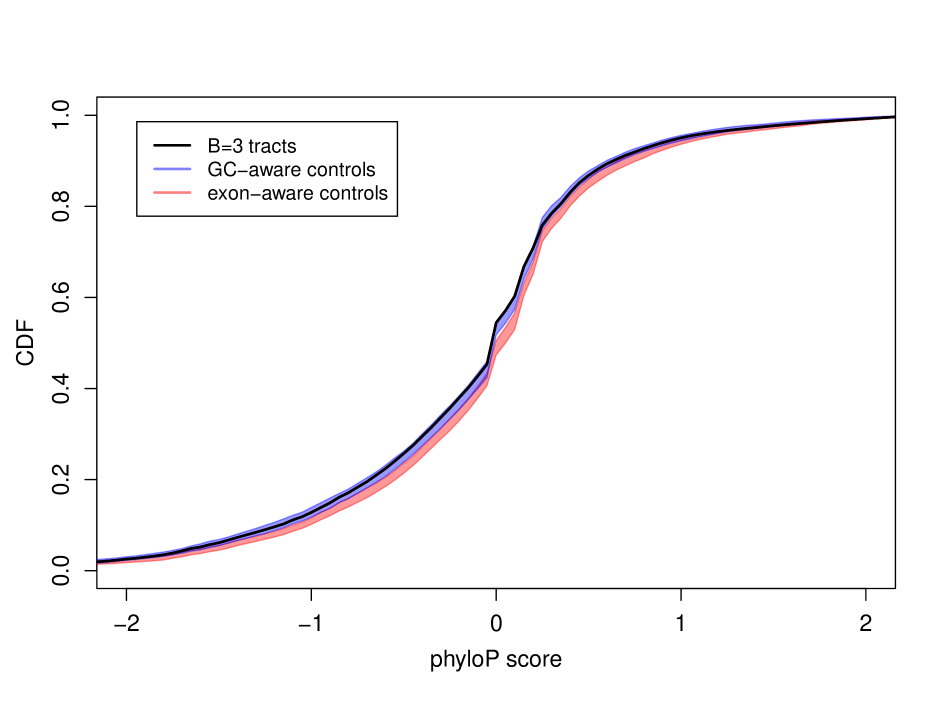
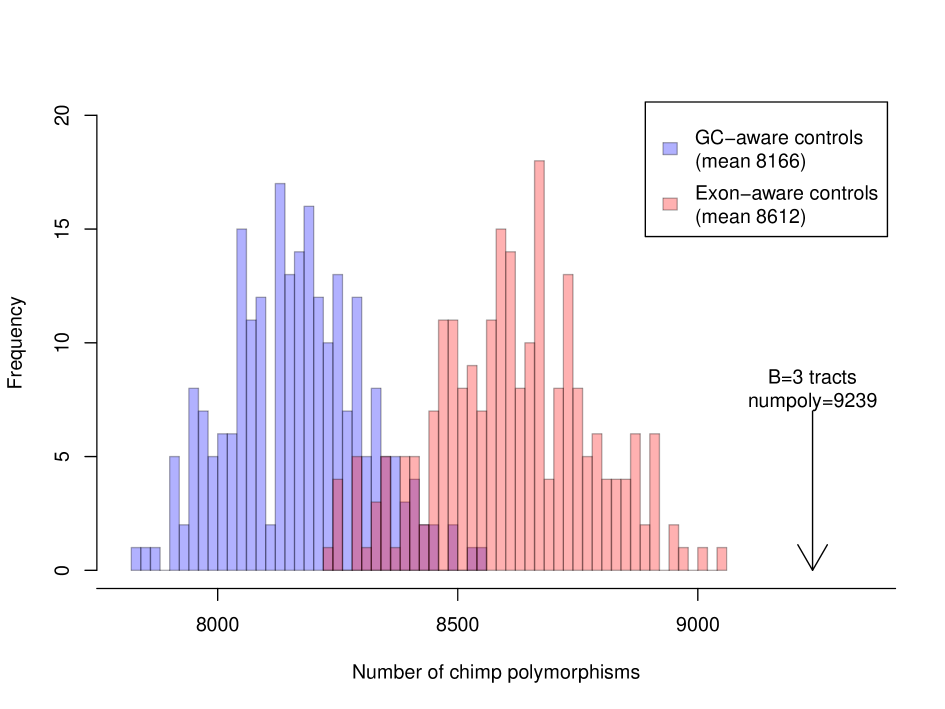
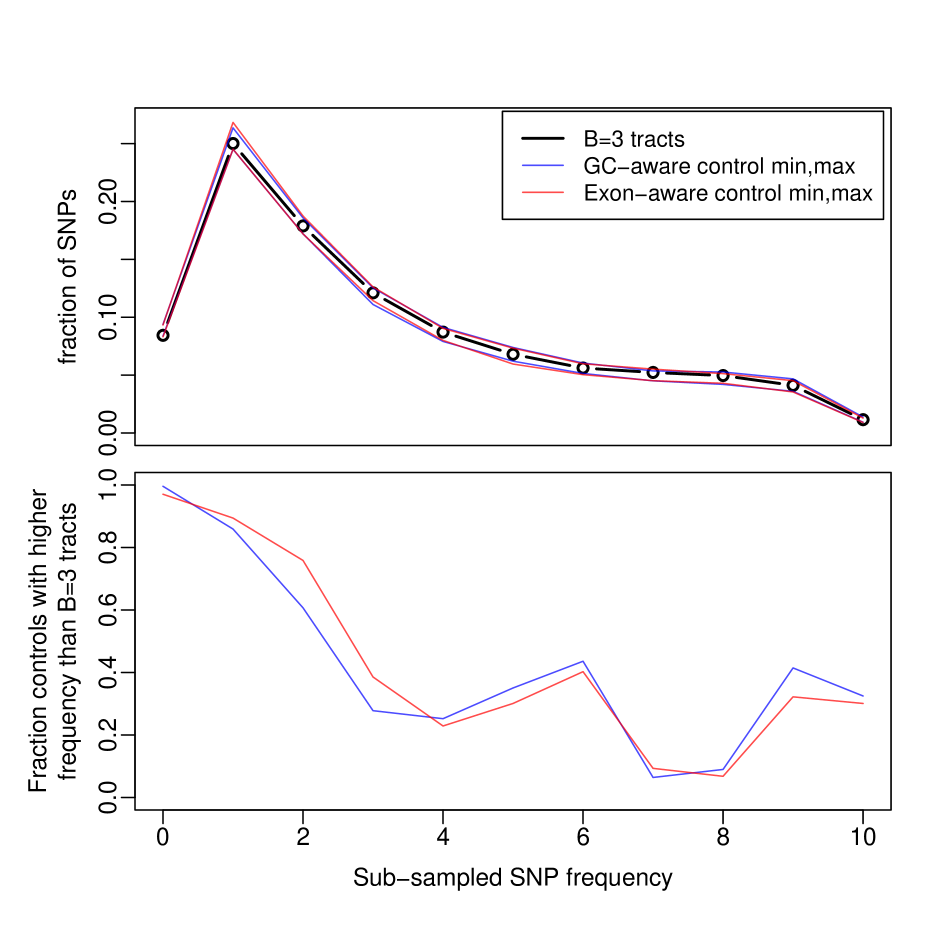
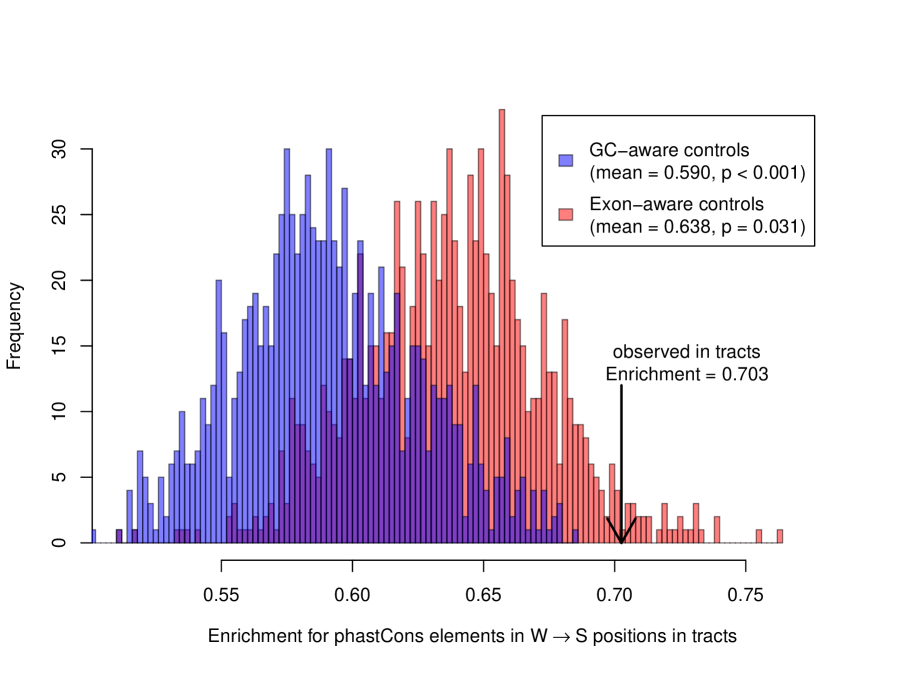
Second, we looked for evidence of purifying selection in chimpanzees and other species at the locations of WS substitutions within the predicted human tracts. If a substantial number of these mutations were driven to fixation by gBGC despite negative selection against them, we would expect to observe an excess of evolutionary conservation, a deficiency of polymorphisms, and/or a skew toward low-frequency derived alleles at orthologous locations in other species. However, we found that the bulk distributions of phyloP conservation scores [36], computed for eutherian mammals but excluding human and chimpanzee (Methods), were nearly identical for the tracts and the GC-matched controls (Supplementary Figure S8). In addition, we compared chimpanzee polymorphisms [23] in regions orthologous to our human tracts and control regions, and found no deficiency of polymorphisms (Supplementary Figure S9) and no excess of low-frequency derived alleles (Supplementary Figure S10) within the tracts. Indeed, the regions orthologous to the human tracts displayed an excess of chimp polymorphisms, perhaps reflecting increased power for gBGC detection in regions of elevated mutation rates. On the other hand, we did observe a significant enrichment for overlap with evolutionarily conserved elements identified using phastCons [26] at locations of WS substitutions within the predicted tracts (Supplementary Figure S11). Thus, we found mixed evidence linking gBGC with fixation of deleterious alleles.
Overlap with Fast-Evolving Sequences
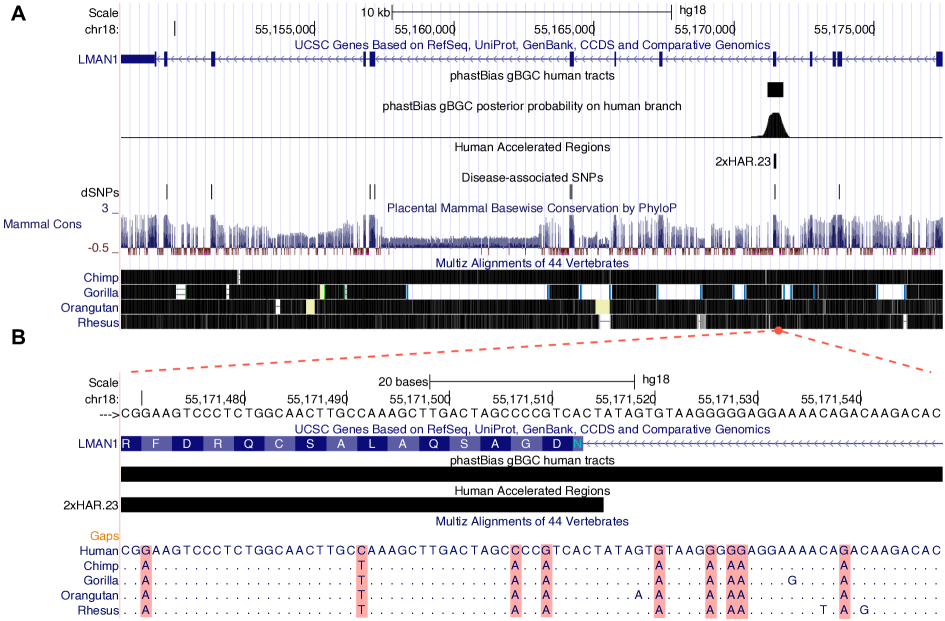
Many fast-evolving regions of the human genome display an excess of WS substitutions, leading to the suggestion that gBGC may play a role in their evolution [37, 6, 38, 13, 7, 9]. Supporting this hypothesis, our predicted gBGC tracts overlap 13 of the 202 (6.4%) HARs identified by Pollard et al. [37], more than observed for any of the 1000 GC-control region replicates (). Notably, the HARs overlapped by gBGC tracts included HAR1, HAR2, and HAR3, the three fastest evolving sequences in this set. We also examined an expanded set of 721 HARs [39] and found that gBGC tracts overlapped 75 of them (10%; ; see example in Figure 5). Next, we compared the gBGC tracts with the 10 protein-coding genes recently identified as showing signatures of positive selection on the human branch based on a likelihood ratio test [40]. One of these genes is overlapped by a gBGC tract, significantly more than expected based on exon-aware controls (). The overlapped gene, ADCYAP1, was also highlighted by another group [9] as showing strong evidence of an influence from gBGC. We repeated our analysis with 157 genes identified in another recent study as showing signatures of human-specific positive selection [41], and found that the gBGC tracts overlapped 11 (7%) of these genes, somewhat more than average for the exon-aware control replicates (7.4, ). Considering our limitations in power (see Discussion), these results indicate the gBGC has contributed to a substantial fraction of fast-evolving sequences in the human genome.
Genome Browser Track
Our predicted tracts for human and chimpanzee are available as a UCSC Genome Browser track at http://genome-mirror.bscb.cornell.edu (Figure 5). This track displays both our discrete predictions of gBGC tracts and a continuous-valued plot indicating the posterior probability that each position is influenced by gBGC. Using this track it is possible to browse the predicted tracts in their full genomic context, perform queries intersecting them with other browser tracks, and download them for further analysis. We expect this track to be particularly useful for other investigators who wish to exclude gBGC-influenced regions of the genome from other molecular evolutionary analyses, such as the identification of genes under positive selection. The tracts themselves will also be directly useful for studying the evolution of recombination rates and their relationship to substitution rates and patterns.
Discussion
This paper describes an analysis of predicted gBGC tracts in the human and chimpanzee genomes, based on a new computational method called phastBias. PhastBias makes use of a hidden Markov model and statistical phylogenetic models that consider the influence of both natural selection and gBGC on substitution rates and patterns. Unlike previous methods for identifying signatures of gBGC, it does not depend on a sliding window or previous genomic annotations, but instead can flexibly identify tracts of various sizes directly from genome-scale multiple alignments. The method appears to have good power for tracts of about 1 kilobase or longer, provided gBGC has acted with a reasonably high average intensity along the lineage of interest. Our predictions in the human and chimpanzee genomes cover about 0.3% of each genome, and explain about 1.2% of human/chimpanzee single nucleotide differences. Consistent with a cause from gBGC, the predicted tracts are correlated with recombination rates, tend to fall in subtelomeric regions, and exhibit an ongoing fixation bias for G and C alleles. In addition, they tend to overlap previously identified fast-evolving coding and non-coding regions, suggesting that gBGC has contributed significantly to the evolution of these sequences. Overall, our analyses indicate that gBGC has been an important force in the evolution of human and chimpanzees since their divergence 4–6 million years ago.
Many attributes of the predicted gBGC tracts are consistent with recombination as the driving force of gBGC. Nevertheless, the tract locations are only partially correlated with recombination rates in human and chimpanzee. Moreover, while the tracts are enriched for recombination hotspots in both species, there are thousands of hotspots that do not overlap a gBGC tract, and the majority of tracts do not overlap a hotspot. These differences can be explained by several factors. First, the hotspots we have analyzed reflect recombination patterns in modern human populations, while the gBGC tracts reflect average patterns since the divergence of humans and chimpanzees. Many current hotspots presumably have not had sufficient time to produce a detectable signature of biased substitution, while many extinct hotspots contributed to gBGC for long periods of time in the past. The gBGC imprint of such historical recombination hotspots can be observed most dramatically near the fusion of chromosome 2 (Figure 3). Second, models of gBGC suggest that it can occur in conjunction with both crossover and noncrossover recombination events, but current recombination maps reflect crossover events only [3]. An imperfect correlation of these types of events, together with statistical noise in current estimates of crossover rates, likely accounts for some of the absence of correlation between recombination rates and gBGC tracts. Finally, biased substitution rates are influenced by factors other than recombination, such as mutation rates and natural selection. For example, strong purifying selection at or near a hotspot could eliminate the signature of gBGC.
The locations of the human and chimpanzee tracts are strongly correlated on megabase scales, but, like recombination rates, they differ significantly on fine scales, and few human and chimpanzee tracts directly overlap one another (Figure 3; Supplementary Figure S5). Nevertheless, even at fine scales, the gBGC tracts for the two species agree better than recombination hotspots, which are essentially uncorrelated [23]. This observation probably stems from the fact that gBGC tracts reflect time-averaged recombination rates, and historical recombination rates were presumably better correlated than those in present-day humans and chimpanzees. In general, the predicted gBGC tracts provide a valuable window into historical recombination processes, but this window is “blurred” by time-averaging over millions of years. Nevertheless, together with other sources of information about historical recombination processes—such as new methods based on patterns of incomplete lineage sorting (K. Munch, T. Mailund, J.Y. Dutheil, and M.H. Schierup, in prep.)—predictions of gBGC tracts may help to fill in our picture of the evolution of recombination rates in hominoids.
Despite the overall similarity of the human and chimpanzee predictions, the coverage of the predicted tracts is about 25% lower in the chimpanzee genome. A possible cause of this difference is the greater concentration of recombination events in hotspots in humans [23]. This difference could lead to a stronger population-level signal for gBGC in humans, allowing for more predictions and longer predicted tract lengths. Because this concentration of recombination events is more pronounced for European than for African populations, it may be of interest to predict separate sets of tracts for individuals of European and African descent and see whether an excess of gBGC tracts are observed in Europeans.
The difference between humans and chimpanzees in the concentration of recombination events may derive from differences in the activity of the hotspot-specifying protein PRDM9, which shows substantially greater allelic diversity in chimpanzees than in humans [23]. Consistent with this hypothesis, there is a much weaker signal for sequence motifs potentially involved in PRDM9 binding at chimpanzee hotspots than at human hotspots. In an attempt to shed light on the ancestral binding preferences of PRDM9, we applied motif discovery methods to the predicted gBGC tracts in the human and chimpanzee genomes. However, in both species this analysis turned up only a few motifs, none of which resembled the well-defined motifs reported for the human genome [42, 23]. It may be that the ancestral recombination hotspots in both species are more like the ones in present-day chimpanzees than those in present-day humans, with poorly defined sequence motifs. Alternatively, the absence of well-defined motifs may simply reflect rapidly evolving PRDM9 binding preferences and the time-averaged nature of the gBGC tracts, which together could eliminate a clear signal for motif discovery.
Given what is currently known about gBGC, it is impossible to obtain direct measurements of the completeness and accuracy of our predicted tracts. Our simulation experiments suggest that both sensitivity and specificity are reasonably good for tracts at least 1–2 kb in length with , but we often miss shorter or less biased gBGC tracts (Figure 2), and the true distributions of tract lengths and values are unknown (although estimates of [43] and [8] have been reported for highly recombining regions). It is important to bear in mind that represents an average along an entire branch of the phylogeny. Many regions may have experienced quite strong gBGC but for short evolutionary intervals, resulting in small average values of and poor detection power. Thus, while our genome-wide predictions improve on what is currently available, it seems plausible that they still represent the “tip of the iceberg”—a relatively small subset of all genomic regions significantly influenced by gBGC, perhaps unusual for their length or GC-disparity.
It is worthwhile to consider two other indirect sources of information about our power for gBGC tract prediction. First, Katzman et al. [16] found that about 20% of the 40 kb genomic intervals they examined show significant WS DAF skew. If we conservatively assume one 1–2 kb tract per gBGC-influenced window, this observation would imply that at least 0.5–1.0% of the human genome has been influenced by gBGC on population genomic time scales, compared with the phastBias estimate (for ) of 0.3%. Second, using a method optimized for the analysis of individual HARs, Kostka et al. [13] estimated that 24% of HARs experienced significant gBGC (19% exclusively and 5% in combination with positive selection), or 3.7 times as many as overlap our phastBias predictions (6.4%). Thus, these two imperfect indicators of power suggest that, with , phastBias underpredicts gBGC tracts by a factor of roughly 2–4 or more. The genomic coverage of our predictions may be closer to the truth (1.1%; Table 2), but these predictions appeared to be of poorer quality on inspection, apparently because the phylo-HMM states with and without gBGC were insufficiently distinct to control false positive rates.
It is also worth noting that, while the likelihood ratio tests of Kostka et al. [13] appeared to have greater power for gBGC in HARs overall, phastBias sometimes achieves improved sensitivity by considering the entire genome (including flanking sequences) rather than just a designated collection of elements. Indeed, of the thirteen HARs that overlap one of our gBGC tracts, three were not identified by Kostka et al., apparently for this reason. These instances of improved sensitivity are especially noteworthy given that phastBias must address the more difficult problem of unconstrained genome-wide prediction, with the attendant potential for large numbers of false positives predictions.
In principle, gBGC can overcome purifying selection and help to drive deleterious alleles to high frequencies [8, 3, 10], but it has been difficult to find direct empirical evidence for a reduction in fitness (genetic load) caused by gBGC. Our predicted gBGC tracts provide two hints of an empirical link between gBGC and fitness reductions. First, the predicted tracts are significantly enriched for disease-associated polymorphisms in current human populations, suggesting that gBGC has helped to drive at least some of these alleles to appreciable frequencies, and, indeed, may still be active in maintaining these deleterious alleles. Second, the inferred WS substitutions in the tracts are enriched for overlap with evolutionarily conserved sequences in eutherian mammals, suggesting long-term purifying selection against the (presumably) gBGC-driven G/C allele at some of these positions. However, other lines of evidence were inconsistent with these findings, and despite several attempts (Supplementary Material), we were unable to obtain reliable estimates of the overall contribution of gBGC to deleterious substitutions in the human genome. This estimation problem is difficult because many correlates of gBGC are also correlates of nucleotide substitution rates, and because most gBGC-induced substitutions are probably neutral, with only a small fraction being deleterious. This will be an interesting and important topic for future work.
Methods
Probabilistic Model
Our phylogenetic hidden Markov model has four states: one that assumes both evolutionary conservation and gBGC (CB), a second with gBGC but no conservation (NB), a third with conservation but no gBGC (C0), and a fourth with neither conservation nor gBGC (N0) (Figure 1). To avoid over-parameterization, we make the following simplifying assumptions. First, we model gBGC only on the lineage leading to a pre-defined “target” genome (human or chimpanzee), because gBGC is expected to be a transient phenomenon, typically affecting a single lineage in any genomic position of interest. gBGC tracts are allowed to occur on other lineages, but these tracts are expected to have a negligible influence on inferences in the target genome and are not directly modeled. Second, negative selection, in contrast to gBGC, is assumed to apply uniformly across all branches of the phylogeny. Third, positive selection is ignored. We omit positive selection and lineage-specific negative selection from the model because they are expected to be fairly rare, to leave a relatively weak signal in the data at human-chimpanzee evolutionary distances [44], and to primarily operate at a somewhat different genomic scale from gBGC (e.g., at the level of individual binding sites or clusters of amino acids, rather than genomic tracts of hundreds or thousands of bases). We expect our modeling framework to be robust to occasional sequences under positive or lineage-specific selection, because the primary signal for tract prediction is a WS substitution bias, and selection generally will not produce such a bias consistently across many bases. Finally, we assume that the strength of gBGC and the strength of negative selection in the target genome are constant across the genome. A similar homogeneity assumption is employed in phastCons and appears to have a minimal impact on power and accuracy for element identification [26].
With these assumptions, the phylogenetic models for the four states are defined as follows.
-
1.
Neutral/No gBGC (N0): Neutral evolution is described by an HKY substitution model [45], with free parameters for the transition/transversion ratio () and stationary nucleotide frequencies (). We assume the accepted tree topology for the species under consideration: (((human, chimpanzee), orangutan), rhesus macaque). The branch length proportions were obtained from the Conservation tracks in the UCSC Genome Browser (assembly hg18) [46]. (They were originally estimated from fourfold degenerate sites in protein coding genes under a strand-symmetric general reversible model.) These branches were scaled locally to accommodate regional variation in mutation rate (see below).
-
2.
Neutral/gBGC (NB): This model is identical to the neutral model except that it assumes gBGC influences substitution rates and patterns on the lineage leading to the target species (human or chimpanzee) according to the model of Kostka et al. [13]. The strength of gBGC is described by the GC-disparity parameter , which increases the rate of WS substitutions and decreases the rate of SW substitutions.
-
3.
Conserved/No gBGC (C0): Evolutionary conservation is modeled, as in phastCons, by multiplying the branch lengths of the neutral model by a factor (). In all other respects, this model is identical to the neutral model. Note that the application of a multiplicative scale factor to the neutral branch lengths is mathematically equivalent to selecting a constant value for the population-scaled selection coefficient in the joint BGC/selection model of Kostka et al. [13].
-
4.
Conserved/gBGC (CB): This model is identical to model NB except that it assumes gBGC acts with strength on the lineage leading to the target species.
The state-transition probabilities are defined by four parameters, denoted , , , and (Figure 1, Table 1). The parameters and are inherited from phastCons [26] and describe the conditional probabilities of transitioning from a conserved state to a neutral state, and from a neutral state to a conserved state, respectively. The parameters and are analogous, defining the conditional probabilities of transitioning out of, and into, a gBGC tract, respectively. The sixteen possible state transition probabilities are obtained by multiplying the appropriate pairs of conditional probabilities and enforcing the standard normalization constraints (Figure 1). This “cross-product” construction corresponds to a prior assumption of independence for the two types of transitions (conservation no conservation and gBGC no gBGC).
Given a multiple sequence alignment, standard algorithms for statistical phylogenetics and hidden Markov models can be used to calculate the likelihood of the data under this model, to predict the most likely state path (Viterbi), or to calculate the marginal posterior probability of each state at each alignment column (reviewed in [25]).
Parameter Estimation
In principle, the nine free parameters in our model (Table 1) could all be estimated directly from the data by maximum likelihood, using an expectation maximization or numerical optimization algorithm. In practice, however, parameter estimation is difficult because there are no validated gBGC tracts to use for supervised training of the model, and the signal in the data is not sufficiently strong to support a fully unsupervised estimation procedure. Instead, we partition the parameters into three groups: those for the neutral substitution process, those for the model of conserved elements, and those specific to the gBGC tracts. The first two groups of parameters are pre-estimated from the data without consideration of gBGC, by what can be considered an empirical Bayes approach. The parameters in the third group are then estimated by a combination of methods.
Specifically, the free parameters for the neutral substitution process (, , and ) are estimated per alignment block (see below) using phyloFit [24], after conditioning on the tree topology and branch-length proportions (as described above). This strategy assumes that conserved elements and gBGC tracts are sparse and have at most a minor effect on average substitution rates for large genomic blocks. The three additional parameters that describe conserved elements (, , and ) are inherited directly from phastCons and therefore were simply set to the values used for the Conservation tracks in the UCSC Genome Browser. The remaining parameters include the GC-disparity and the gBGC transition probabilities and . As discussed in the Results section, we found that —which can be interpreted as an inverse prior expected length for gBGC tracts—has only a weak influence on our predictions (within a reasonable range) and decided to simply fix it at 1/1000, corresponding to a prior expectation of 1 kb tracts. We treated as a “tuning” parameter and considered various possible values in a plausible range. The final parameter, , was estimated from the data (separately for each alignment block) by expectation maximization, conditional on fixed values of all other parameters.
Tract Prediction
To predict gBGC tracts based on our model, we computed marginal posterior probabilities for the four model states at each genomic position using the forward/backward algorithm. We then computed the marginal posterior probability of gBGC by summing the probabilities for states NB and CB, and we predicted tracts by applying a threshold of 0.5 to this probability (i.e., the predicted tracts are maximal segments in which every position has a posterior probability of at least 50% of gBGC). We settled on this strategy after discovering that the more conventional Viterbi algorithm performed poorly in this setting, evidently due to uncertainty about the endpoints of tracts. This uncertainty causes the probability mass for a putative gBGC tract to be distributed across many possible HMM state paths, and as a result, the Viterbi algorithm often fails to predict a tract even when the posterior probability of gBGC is close to one. A potential drawback of our thresholding strategy is that fluctuating posterior probabilities could lead to highly fragmented tract predictions. However, we found that the posterior probability function was quite smooth in practice (probably owing to small values of the state transition probabilities) and fragmentation was not a problem. For example, at , only about 2% of the predicted human tracts fall within 50 base pairs of another tract. Nonetheless, when analyzing the genomic distribution of gBGC tracts relative to one another and to telomeres, we merged adjacent tracts (within 1 kb) in order to reduce any bias introduced by over fragmentation (Supplementary Material).
Genome-wide Alignments and Preprocessing
Our analyses of both simulated and real data were based on genome-wide alignments obtained from the UCSC Genome Browser (http://genome.ucsc.edu) [46]. We began with the 44-way vertebrate alignments produced with multiz [47] (hg18 assembly) and extracted the rows corresponding to the human, chimpanzee, orangutan, and rhesus macaque genomes, discarding alignment columns containing only gaps in these sequences. We also discarded columns in which the human genome contained a gap. Human-referenced alignments were used for both the human and chimpanzee gBGC tract predictions, as chimpanzee-based multiple alignments are not available. For convenience in processing, the resulting four-way alignments were partitioned into blocks of approximately 10 megabases (Mb) in length. The boundaries between blocks were required to occur in regions uninformative about gBGC (due to 1 kb with lack of alignment with the other species).
Simulation Study
We simulated human sequences with gBGC tracts for each 10 Mb block in the real genome-wide alignments as follows. First, we identified positions at which any sequence contained a CpG dinucleotide, because substitution rates are likely to be substantially elevated at such sites. Next, we used phastCons to identify conserved elements in the four species. We then fitted a phylogenetic model to the alignment columns in each of four categories (neutral/non-CpG, conserved/non-CpG, neutral/CpG, conserved/CpG) by estimating , , and for the most data-rich category (neutral/non-CpG), then estimating a separate for the CpG category (using phyloFit) and applying a branch-length scale-factor of 0.3 to the conserved categories. Next, we defined an alternative “gBGC” instance of each of the four estimated models by modifying the substitution rate matrix for the human branch according to our model of gBGC [13] and a given choice of (here denoted ). In this way, we obtained eight phylogenetic models, representing all combinations of conservation / no conservation, CpG / no CpG, and gBGC / no gBGC.
We generated synthetic human sequences by assigning one of these eight models to each alignment column, as follows. The conservation and CpG status of each column was maintained as originally annotated, so that the synthetic alignments would resemble the original ones as much as possible. The gBGC status was set to “no gBGC” for most columns, but set to “gBGC” for tracts of fixed size at randomly selected locations, at an average gBGC coverage of 0.1%. We then simulated a new human base for each alignment column conditional on the assigned phylogenetic model and the observed chimpanzee, orangutan, and rhesus macaque bases. This was accomplished using the ‘postprob.msa’ function in RPHAST, which computes the marginal distribution over bases at any node in the phylogeny conditional on a given phylogenetic model and collection of observed bases, using the sum-product algorithm. This function computes the desired distribution for the human base if the human sequence is masked and treated as missing data in the input. A particular base was selected by sampling from this marginal distribution.
We performed this simulation procedure for combinations of and fixed tract lengths of 200, 400, 800, 1600, 3200, and 6400. For each set of simulated alignments, we predicted gBGC tracts as described in the previous section, assuming several different values for the tuning parameter . For each data set and value of , we calculated the true positive rate (number of correctly predicted gBGC bases / total number of gBGC bases), false positive rate (number of incorrectly predicted gBGC bases / total number of non-gBGC bases), and positive predictive value (number of correctly predicted gBGC bases / number of predicted gBGC bases).
Genomic Annotations
We compared the predicted gBGC tracts with exon and intron definitions from Gencode version 3c and Ensembl genes [48], and with annotations of lincRNAs, miRNAs, miscRNAs, small non-coding RNAs, NMD transcripts, and pseudogenes from Gencode version 14 [49]. We also compared them with LINE and SINE elements from the rmskRM327 table in the UCSC Table Browser [50], and with a set of high-confidence predictions of transcription factor binding sites based on ChIP-seq data from ENCODE [51] (L. Arbiza, I. Gronau, B.A. Aksoy, M.J. Hubisz, B. Gulko, A. Keinan, and A. Siepel, in revision). In addition, we compared the tracts with genome-wide recombination rate estimates from the 1000 Genomes Project [31], recombination hotspots from the October 2006 release of HapMap [30], and chimpanzee recombination rate estimates from the PanMap project [23].
Disease-associated SNPs were obtained from several sources. SNPs annotated with “pathogenic” or “probable pathogenic” clinical significance were downloaded on October, 25, 2011 from dbSNP [32]. The HGMD dSNPs were obtained from the Supplementary Material of reference [11]. Regions of the human genome with positive genetic associations with disease were taken from the Genetic Association Database [34] on February 2, 2012. The level of evidence for the function of non-coding SNPs was downloaded from the RegulomeDB [35] web site on December 12, 2012. All data not in reference to the GRCh36/hg18 assembly were mapped to hg18 using the ‘liftOver’ tool from the UCSC Genome Browser.
Control Regions
To evaluate the statistical significance of various properties of interest, we compared the predicted gBGC tracts with sets of control regions matched to them in number, length distribution, and chromosome assignment. We also ensured that the control regions were matched to the gBGC tracts by GC content (by stratifying predictions and controls into 100 bins), which is known to correlate strongly with several relevant genomic features. We obtained a null distribution for each statistic of interest (such as the number of tracts overlapping exons, or the number human tracts overlapping orthologous chimpanzee tracts), by computing a value of the statistic for each of 1000 randomly sampled replicates of the control regions. One-sided empirical -values were computed as the fraction of sampled control sets for which the statistic was at least as extreme as observed in the predicted tracts. As noted in the text, we occasionally considered alternative sets of control regions designed to accommodate known biases in genomic regions of interest. For example, when evaluating the significance of overlap with disease-associated SNPs from HGMD and dbSNP, we used control regions matched to the predicted tracts in terms of their degree of exon overlap, since these sets consist mostly of coding SNPs. Similarly, for RegulomeDB, which is focused on non-coding SNPs, we used control regions that matched the overlap of the gBGC tracts with the set of SNPs considered by RegulomeDB.
Analysis of Derived Allele Frequencies
Our analysis of derived allele frequences was based on genotype data from the low-coverage pilot data set from the 1000 Genomes Project released in July 2010 [31]. These comprise SNP calls for the 22 autosomes in three HapMap population panels: YRI (59 individuals), CEU (60 individuals), and CHB-JPT (60 individuals). We computed the WS DAF skew of all gBGC tract SNPs as normalized values from a Mann-Whitney test on the derived allele frequencies of WS and SW SNPs, as previously described [16]. A WS DAF skew of 0.5 indicates no bias, and values greater than 0.5 indicate that WS mutations are favored.
Purifying Selection at Orthologous Positions
We evaluated evidence of purifying selection at regions of other mammalian genomes by considering (1) evolutionary conservation scores for mammals and (2) patterns of polymorphism in chimpanzee. In both cases, we compared regions orthologous to the predicted human tracts and regions orthologous to control regions. The first comparison used phyloP CONACC conservation scores [36] at positions of human-specific WS substitutions within the predicted tracts. To avoid possible biases from human-specific substitutions or from the chimpanzee sequence used to assign these substitutions to the human branch, we re-computed the phyloP scores based on alignments of eutherian mammals from which the human and chimpanzee sequences had been removed (leaving 30 mammalian species). We compared the tracts with both exon- and GC-matched control regions (Supplementary Figure S8). For the polymorphism analysis, we used data from the PanMap Project [23] and considered all nucleotides within the predicted tracts, because the subset of sites with both human-specific WS substitutions and chimpanzee polymorphisms was very small (42 sites).
Acknowledgments
We thank Laurent Duret, Graham Coop, and members of the Pollard and Siepel research groups for helpful discussions.
Funding
Funding was provided by National Institutes of Health (NIGMS) grant GM82901 (to K.S.P. and A.S.), a David and Lucile Packard Fellowship for Science and Engineering (to A.S.), and a PhRMA Foundation Informatics Fellowship (to J.A.C.).
References
- 1. Chen JM, Cooper DN, Chuzhanova N, Ferec C, Patrinos GP (2007) Gene conversion: mechanisms, evolution and human disease. Nat Rev Genet 8: 762–775.
- 2. Marais G (2003) Biased gene conversion: implications for genome and sex evolution. Trends Genet 19: 330–338.
- 3. Duret L, Galtier N (2009) Biased gene conversion and the evolution of mammalian genomic landscapes. Annu Rev Genom Hum G 10: 285–311.
- 4. Lamb BC (1984) The properties of meiotic gene conversion important in its effects on evolution. Heredity (Edinb) 53 ( Pt 1): 113–138.
- 5. Brown TC, Jiricny J (1988) Different base/base mispairs are corrected with different efficiencies and specificities in monkey kidney cells. Cell 54: 705–711.
- 6. Galtier N, Duret L (2007) Adaptation or biased gene conversion? Extending the null hypothesis of molecular evolution. Trends Genet 23: 273–277.
- 7. Berglund J, Pollard KS, Webster MT (2009) Hotspots of biased nucleotide substitutions in human genes. PLoS Biol 27: e26.
- 8. Galtier N, Duret L, Glémin S, Ranwez V (2009) GC-biased gene conversion promotes the fixation of deleterious amino acid changes in primates. Trends Genet 25: 1–5.
- 9. Ratnakumar A, Mousset S, Glemin S, Berglund J, Galtier N, et al. (2010) Detecting positive selection within genomes: the problem of biased gene conversion. Philos Trans R Soc Lond B Biol Sci 365: 2571–2580.
- 10. Glémin S (July 2010) Surprising fitness consequences of GC-biased gene conversion: I. mutation load and inbreeding depression. Genetics 185: 939-959.
- 11. Necşulea A, Popa A, Cooper DN, Stenson PD, Mouchiroud D, et al. (2011) Meiotic recombination favors the spreading of deleterious mutations in human populations. Hum Mutat 32: 198–206.
- 12. Capra JA, Pollard KS (2011) Substitution patterns are GC-biased in divergent sequences across the metazoans. Genome Biology and Evolution 3: 516-527.
- 13. Kostka D, Hubisz MJ, Siepel A, Pollard KS (2012) The role of GC-biased gene conversion in shaping the fastest evolving regions of the human genome. Mol Biol Evol 29: 1047–1057.
- 14. Dreszer TR, Wall GD, Haussler D, Pollard KS (2007) Biased clustered substitutions in the human genome: the footprints of male-driven biased gene conversion. Genome Res 17: 1420–1430.
- 15. Duret L, Arndt PF (2008) The impact of recombination on nucleotide substitutions in the human genome. PLoS Genet 4: e1000071.
- 16. Katzman S, Capra JA, Haussler D, Pollard KS (2011) Ongoing GC-biased evolution is widespread in the human genome and enriched near recombination hot spots. Genome Biology and Evolution 3: 614-626.
- 17. Nagylaki T (1983) Evolution of a finite population under gene conversion. Proc Natl Acad Sci USA 80: 6278–6281.
- 18. Jeffreys AJ, Murray J, Neumann R (1998) High-resolution mapping of crossovers in human sperm defines a minisatellite-associated recombination hotspot. Mol Cell 2: 267–273.
- 19. Kong A, Thorleifsson G, Gudbjartsson DF, Masson G, Sigurdsson A, et al. (2010) Fine-scale recombination rate differences between sexes, populations and individuals. Nature 467: 1099–1103.
- 20. Myers S, Bottolo L, Freeman C, McVean G, Donnelly P (2005) A fine-scale map of recombination rates and hotspots across the human genome. Science 310: 321–324.
- 21. Ptak SE, Hinds DA, Koehler K, Nickel B, Patil N, et al. (2005) Fine-scale recombination patterns differ between chimpanzees and humans. Nat Genet 37: 429–434.
- 22. Winckler W, Myers SR, Richter DJ, Onofrio RC, McDonald GJ, et al. (2005) Comparison of fine-scale recombination rates in humans and chimpanzees. Science 308: 107-111.
- 23. Auton A, Fledel-Alon A, Pfeifer S, Venn O, Segurel L, et al. (2012) A fine-scale chimpanzee genetic map from population sequencing. Science 336: 193-198.
- 24. Hubisz MJ, Pollard KS, Siepel A (2011) PHAST and RPHAST: phylogenetic analysis with space/time models. Briefings in Bioinformatics 12: 41-51.
- 25. Siepel A, Haussler D (2005) Phylogenetic hidden Markov models. In: Nielsen R, editor, Statistical Methods in Molecular Evolution, New York: Springer. pp. 325-351.
- 26. Siepel A, Bejerano G, Pedersen JS, Hinrichs AS, Hou M, et al. (2005) Evolutionarily conserved elements in vertebrate, insect, worm, and yeast genomes. Genome Res 15: 1034–1050.
- 27. Webb AJ, Berg IL, Jeffreys A (2008) Sperm cross-over activity in regions of the human genome showing extreme breakdown of marker association. Proc Natl Acad Sci USA 105: 10471–10476.
- 28. Romiguier J, Ranwez V, Douzery EJ, Galtier N (2010) Contrasting GC-content dynamics across 33 mammalian genomes: Relationship with life-history traits and chromosome sizes. Genome Research 20: 1001-1009.
- 29. IJdo JW, Baldini A, Ward DC, Reeders ST, Wells RA (1991) Origin of human chromosome 2: an ancestral telomere-telomere fusion. Proceedings of the National Academy of Sciences 88: 9051-9055.
- 30. International Hapmap Consortium (2007) A second generation human haplotype map of over 3.1 million SNPs. Nature 339: 851–861.
- 31. The 1000 Genomes Project Consortium (2010) A map of human genome variation from population-scale sequencing. Nature 467: 1061–1073.
- 32. Sherry ST, Ward MH, Kholodov M, Baker J, Phan L, et al. (2001) dbSNP: the NCBI database of genetic variation. Nucleic Acids Research 29: 308-311.
- 33. Stenson P, Mort M, Ball E, Howells K, Phillips A, et al. (2009) The Human Gene Mutation Database: 2008 update. Genome Med 1: 13.
- 34. Zhang Y, De S, Garner J, Smith K, Wang SA, et al. (2010) Systematic analysis, comparison, and integration of disease based human genetic association data and mouse genetic phenotypic information. BMC Medical Genomics 3: 1.
- 35. Boyle AP, Hong EL, Hariharan M, Cheng Y, Schaub MA, et al. (2012) Annotation of functional variation in personal genomes using RegulomeDB. Genome Res 22: 1790–1797.
- 36. Pollard KS, Hubisz MJ, Rosenbloom KR, Siepel A (2010) Detection of nonneutral substitution rates on mammalian phylogenies. Genome Res 20: 110–121.
- 37. Pollard K, Salama S, King B, Kern A, Dreszer T, et al. (2006) Forces shaping the fastest evolving regions in the human genome. PLoS Genet 2: e168.
- 38. Katzman S, Kern AD, Pollard KS, Salama SR, Haussler D (2010) GC-biased evolution near human accelerated regions. PLoS Genet 6: e1000960.
- 39. Lindblad-Toh K, Garber M, Zuk O, Lin MF, Parker BJ, et al. (2011) A high-resolution map of human evolutionary constraint using 29 mammals. Nature 478: 476–482.
- 40. Kosiol C, Vinar T, da Fonseca R, Hubisz M, Bustamante C, et al. (2008) Patterns of positive selection in six mammalian genomes. PLoS Genet 4: e1000144.
- 41. George RD, McVicker G, Diederich R, Ng SB, MacKenzie AP, et al. (2011) Trans genomic capture and sequencing of primate exomes reveals new targets of positive selection. Genome Research 21: 1686-1694.
- 42. Myers S, Freeman C, Auton A, Donnelly P, McVean G (2008) A common sequence motif associated with recombination hot spots and genome instability in humans. Nat Genet 40: 1124–1129.
- 43. Spencer CC, Deloukas P, Hunt S, Mullikin J, Myers S, et al. (2006) The influence of recombination on human genetic diversity. PLoS Genet 2: e148.
- 44. Siepel A, Pollard K, Haussler D (2006) New methods for detecting lineage-specific selection. In: Proc. 10th Int’l Conf. on Research in Computational Molecular Biology. Berlin: Springer-Verlag, pp. 190-205.
- 45. Hasegawa M, Kishino H, Yano T (1985) Dating the human-ape splitting by a molecular clock of mitochondrial DNA. J Mol Evol 22: 160-174.
- 46. Meyer LR, Zweig AS, Hinrichs AS, Karolchik D, Kuhn RM, et al. (2013) The UCSC Genome Browser database: extensions and updates 2013. Nucleic Acids Res 41: D64–69.
- 47. Blanchette M, Kent WJ, Riemer C, Elnitski L, Smit AFA, et al. (2004) Aligning multiple genomic sequences with the threaded blockset aligner. Genome Res 14: 708–715.
- 48. Flicek P, Amode MR, Barrell D, Beal K, Brent S, et al. (2011) Ensembl 2011. Nucleic Acids Research 39: D800-D806.
- 49. Harrow J, Frankish A, Gonzalez JM, Tapanari E, Diekhans M, et al. (2012) Gencode: The reference human genome annotation for the encode project. Genome Research 22: 1760-1774.
- 50. Karolchik D, Hinrichs AS, Furey TS, Roskin KM, Sugnet CW, et al. (2004) The UCSC table browser data retrieval tool. Nucleic Acids Research 32: D493-D496.
- 51. Dunham I, Kundaje A, Aldred SF, Collins PJ, Davis CA, et al. (2012) An integrated encyclopedia of DNA elements in the human genome. Nature 489: 57–74.
Tables
| Parameter | Group111neut = parameters for neutral phylogenetic model, cons = parameters for conserved elements (inherited from phastCons), gBGC = parameters for gBGC tracts. | Description | Value |
|---|---|---|---|
| neut | Scale factor for neutral branch lengths | estimated per 10 Mb block | |
| 222Multivariate parameter (three degrees of freedom). | neut | Equilibrium nucleotide frequencies | estimated per 10 Mb block |
| neut | Transition/transversion ratio | estimated per 10 Mb block | |
| cons | Branch length scale factor in conserved state | 0.3333Values used for the Conservation tracks in the UCSC Genome Browser (see [26]). | |
| cons | Transition prob. conservedneutral | 0.022 | |
| cons | Transition prob. neutralconserved | 0.0095 | |
| gBGC | GC-disparity (strength of gBGC) | 2, 3444Value used for primary analyses., 4, 5, 10 | |
| gBGC | Transition prob. gBGCnon-gBGC | 0.001555Corresponds to prior expected length of 1 kb. | |
| gBGC | Transition prob. non-gBGCgBGC | optimized by EM |
| Species | B | Number | Coverage | Mean length | Median length |
| Human | 2 | 12362 | 1.103% | 2567 | 1008 |
| Human | 3 | 9439 | 0.334% | 1018 | 788 |
| Human | 4 | 7712 | 0.217% | 810 | 628 |
| Human | 5 | 6750 | 0.157% | 670 | 514 |
| Human | 10 | 5210 | 0.073% | 400 | 276 |
| Chimpanzee | 3 | 8677 | 0.252% | 841 | 663 |
| Chimpanzee | 10 | 7062 | 0.068% | 278 | 198 |
| Recombination | Human gBGC tract | Chimpanzee gBGC tract | GC-matched Control |
|---|---|---|---|
| Map | Rate (cM /Mb) | Rate (cM /Mb) | Rate (cM /Mb) |
| Human | 3.85 | 1.81666Obtained by mapping chimpanzee tracts to orthologous positions in the human genome. | 1.61 |
| Chimpanzee | 1.33777Obtained by mapping human tracts to orthologous positions in the chimpanzee genome. | 1.71 | 0.78 |
| Disease-associated | gBGC Tract | Avg. Control | |
|---|---|---|---|
| Region Set | Overlap | Overlap | p-value |
| dbSNP Pathogenic | 113 | 46.3 | 0.005 |
| HGMD | 346 | 178.2 | 0.031 |
| RegulomeDB (classes 1–5) | 26474 | 20768.4 | 0.001 |
| GAD | 485 | 419.7 | 0.001 |
Figures
Supplementary Methods
Clustering, recombination rate, and distance to telomeres
To investigate the degree to which the predicted gBGC tracts are clustered, we calculated for each gBGC tract the distance to the nearest other gBGC tract (distance-to-nearest). One potential caveat with this type of analysis is that gBGC tracts were annotated by thresholding posterior probabilities in our HMM (see Methods), which might cause predictions to occur very close together simply because of fluctuations in posterior probability along the genome. Therefore, for these analyses, we merged gBGC tracts with their neighbors if the distance between them was less than 1 kb (the expected gBGC tract length).
gBGC tracts are close in human and chimp. To assess the closeness of gBGC-tracts in human and chimp we repeated the distance-to-nearest calculation for 1,000 random GC-matched control sets (in human and chimp separately), and then contrasted the distribution we observed in these controls with the distribution in the gBGC-tracts. Supplementary Figure S4 (panels A and C) summarizes the results in terms of quantile-quantile plots between the two distributions. This illustrates that gBGC-tracts are significantly closer together than regions in control sets. For human, the median distance-to-nearest is 24,305 bp, while the average of median nearest distances across control sets is 86,064.26 bp (with a standard deviation of 1,571.1). For chimp, the median distance-to-nearest in the gBGC tracts is 26,286 bp, and the average median distance across control sets is 94,882.92 bp (sd = 1,888.2). In both species, we never observe a median distance-to-nearest in the control sets as low as in the gBGC tracts (-score based ).
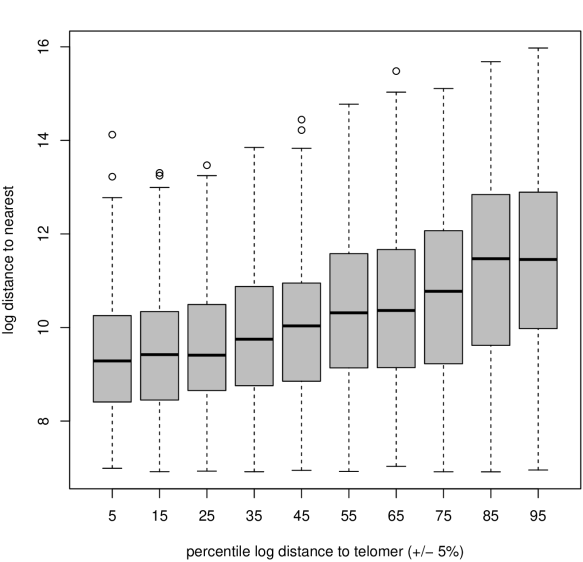
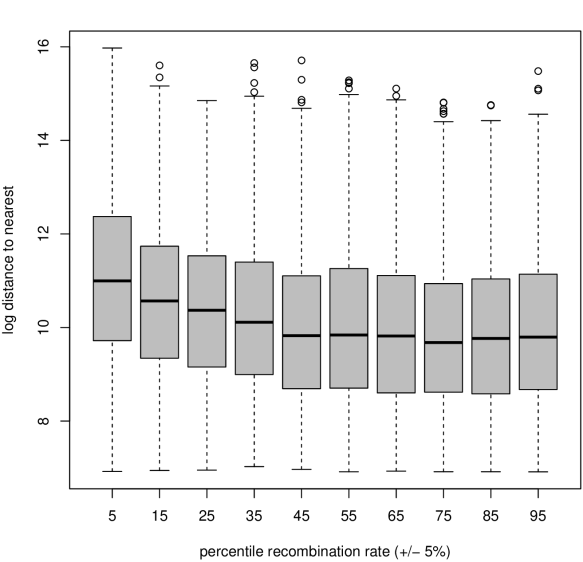
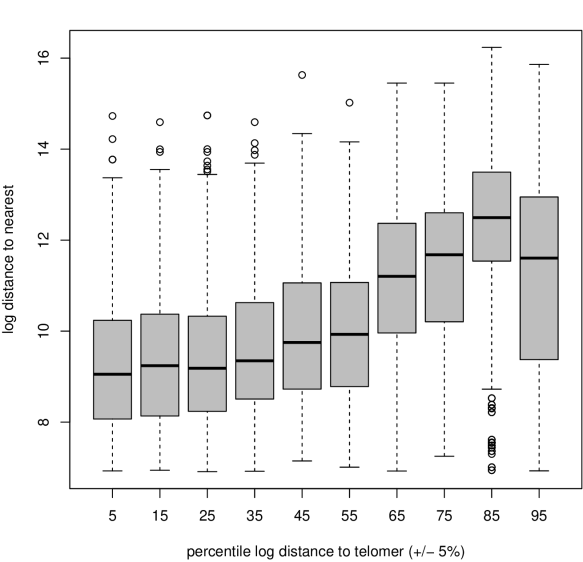
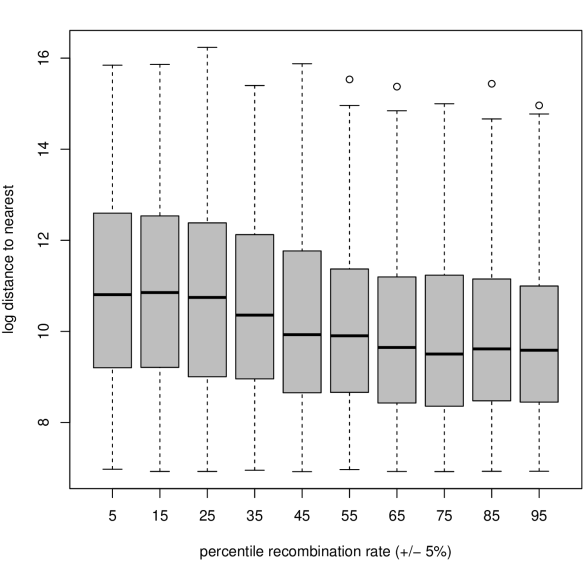
gBGC tracts are close to telomeres in human and chimp. To assess distance to telomeres we performed the same analysis, but used distance to the nearest telomere in place of distance to the nearest neighboring tract (Supplementary Figure S4, panels B and D). The median distance-to-telomere in human and chimpanzee are 9,568,725 bp and 8,002,971 bp, while the averages across control sets are 30,393,137 bp (sd = 329,252.1) and 31,209,994 bp (sd = 370,981.5), respectively. In neither species do we observe a median distance in the control sets that is as low as in the gBGC tracts ().
Distance-to-telomere and recombination rate partially, but not entirely, account for the closeness of gBGC tracts. Next we asked to what extent distance-to-telomere and recombination rate could be driving the observed proximity of gBGC tracts to one another. To address this question we fit the following linear model to the data for each species:
Here, denotes the logarithm of the distance to the nearest neighboring gBGC tract, is the log distance-to-telomere, and is the mean recombination rate of a tract. We find that, in both species, both and are significantly different from zero (see Supplementary Table S2) and the model predicts gBGC tracts to be close together near the telomeres and far apart in areas of low recombination rate (also see Supplementary Figure S12). This is also reflected in Spearman correlation coefficients between distance-to-nearest and distance-to-telomere (0.36 in human, 0.49 in chimp) and recombination rate (0.18 in human, 0.20 in chimp). Despite these significant associations the multiple coefficient of determination () of the linear model is only about 13% in human and 22% in chimpanzee. That is, the majority of the variance in the distance-to-nearest observations remains unexplained when taking distance-to-telomere and recombination rate into account.
Estimation of Fraction of Number of Deleterious Substitutions Due to gBGC
We attempted to estimate the number of deleterious substitutions driven by gBGC by two methods. First, we compared the bulk distributions of evolutionary conservation scores in regions in eutherian mammals orthologous to the human tracts and control regions (Supplementary Figure S8). As described in the Methods section, we used scores computed without the human and chimpanzee sequences to avoid biases from human-specific substitutions. Using various methods, we attempted to decompose the bulk distribution of phyloP scores into a component that could be explained by the distribution observed for control regions and an excess of evolutionary conservation not explainable based on the control regions (see [36] for a description of similar methods). Second, we devised a method for estimating the expected excess number of human WS substitutions in the tracts, relative to the controls. Briefly, this method involved estimating scale factors for neutral phylogenetic models in the non-human species at positions of human WS substitutions in the tracts and controls, and then examining the normalized difference between these factors. However, we found that both of these methods were highly sensitive to the choice of control regions, as well as to technical issues such as the choice of threshold for trimming the left-most tail of the CDF in the mixture decomposition. In the end, we concluded that the patterns of evolutionary conservation were simply too similar in the tracts and control regions, and too dependent on a complex combination of covariates (GC-content, recombination rate, exon overlap, etc.), to lead to meaningful estimates of the number of deleterious substitutions driven by gBGC.
Supplementary Figures


A
B
C
D
A
B
C
D
Supplementary Tables
| B=2 | B=3 | B=4 | B=5 | B=10 | |
|---|---|---|---|---|---|
| B=2 | 1 | 0.97 | 0.95 | 0.93 | 0.88 |
| B=3 | 0.29 | 1 | 0.98 | 0.97 | 0.92 |
| B=4 | 0.19 | 0.64 | 1 | 0.99 | 0.94 |
| B=5 | 0.13 | 0.46 | 0.72 | 1 | 0.95 |
| B=10 | 0.06 | 0.20 | 0.31 | 0.44 | 1 |
| species | coefficient | value | std. error | -value |
|---|---|---|---|---|
| human | 0.431 | 0.190 | ||
| human | -0.006 | 0.002 | 0.006 | |
| chimp | 0.613 | 0.141 | ||
| chimp | -0.022 | 0.007 | 9.8 |