CONNECTION BETWEEN MID-INFRARED EMISSION PROPERTIES AND NARROW LINE REGION OUTFLOWS IN TYPE 1 ACTIVE GALACTIC NUCLEI
Abstract
The location of warm dust producing the Mid-infrared (MIR) emission in Type 1 Active Galactic Nuclei (AGNs) is complex and not yet fully known. We explore this problem by studying how the MIR covering factor ( = ) correlates with the fundamental parameters of AGN accretion process (such as , black hole mass , and Eddington ratio ) and the properties of narrow emission lines (as represented by [O III] ), using large data sets derived from the Sloan Digital Sky Spectroscopic Survey (SDSS) and the Wide Infrared Sky Survey (WISE). Firstly we find that the luminosity of the [O III] wing component () correlates more tightly with the continuum luminosity () than the luminosity of the line core component () does, which is in line with our previous conclusion that the wing component, generally blueshifted, originates from the polar outflows in the inner narrow-line region (NLR). We then find that the MIR shows the strongest correlation with rather than with or the above fundamental AGN parameters, and the correlation becomes stronger as the infrared wavelength increases. We also confirm the anti-correlations of with and , and the lack of dependence of on the Eddington ratio. These results suggest that a large fraction of the warm dust producing MIR emission in AGNs is likely embedded in polar outflows in the NLR instead of in the torus.
Subject headings:
galaxies: Seyfert— galaxies: kinematics and dynamics— infrared: galaxies— quasars: emission lines1. Introduction
The mid-infrared (MIR) emission of radio quiet active galactic nuclei (AGNs) may come from the dusty torus and/or narrow line region (NLR), as well as star formation regions in the host galaxies. High-resolution imaging in the near-infrared (NIR) provides direct evidence for the torus emission in a few nearby AGNs (Bock et al. 2000; Radomski et al. 2003). At longer wavelengths, observations showed extended MIR emission regions, coincident with the inner NLR, in addition to the unresolved core, presumably the optically thick torus (Tresch-Fienberg et al. 1987; Braatz et al. 1993; Cameron et al. 1993; Packham et al. 2005; Hönig et al. 2010). Besides, MIR spectroscopic analysis revealed an emission component, dominated by PAH emission, from star formation regions, and its contribution increases with increasing wavelength and decreasing AGN luminosity (e.g. Deo et al. 2009).
Recent high-resolution observations with the instrument on demonstrated that in NGC1068, NGC 424, the Circinus galaxy and probably also in NGC 3783, most of the MIR emission lies along the polar direction, orthogonal to the major-axis of the NIR emission region (Raban et al. 2009; Hönig et al. 2010, 2012; Tristram et al. 2012). Hönig et al. (2012) proposed that the polar dust is entrained in radiatively driven dusty winds, originated from the outerpart of the accretion disk (e.g. Königl & Kartje 1994; Keating et al. 2012), or evaporated from the dusty torus (Dorodnitsyn et al. 2008). Thus the strength of MIR emission may be closely connected to the properties of the gas outflow. The outflow in the NLR is manifested by the blue-shifted and relatively broad component in the high-ionization narrow emission lines (e.g. Zhang et al. 2011). The NLR in nearby galaxies has been successfully modeled by biconical outflows on scales of a few to tens of parsecs from the nuclei in nearby Seyfert galaxies (Heckman et al. 1981; Das et al. 2005; Crenshaw et al. 1999, 2010). It is well known that the NLR contains dust. It would be interesting to explore if the MIR properties are linked to those of narrow emission lines.
The Wide-field Infrared Survey Explorer (WISE; Wright et al. 2010) surveyed the whole sky at 3.4, 4.6, 12 and 22 m at sensitivities about 100-1000 better than previous all sky surveys. Taking the advantage of the WISE and the Sloan Digital Sky Survey (SDSS) data releases, it is possible to construct a large sample of AGNs with both measurements in MIR and optical to explore the connection between the MIR properties and the AGN fundamental parameters or NLR properties. In what follows, we adopt a CDM cosmology with = 70 km s-1 Mpc-1, = 0.3, and = 0.7.
2. The Sample and the Measurement
2.1. The Sample and Spectral Fit
From the spectroscopic data set of the SDSS Data Release 4 (Adelman-McCarthy et al. 2006), we select 4178 Seyfert 1 galaxies and quasars (namely type 1 AGNs) that have reliable measurements of emission line fluxes and the continuum suffers little host galaxy contamination. The sample is described in detail in Dong et al. (2011). As described in Dong et al. (2008), we fit simultaneously the continuum and emission lines in the spectral regimes near H+[O III] and H+[S II] with a model consisting of several components: a power-law representing the featureless AGN continuum, the Fe II templates, and a number of gaussians for emission lines. Each of the narrow emission lines is fitted with a single Gaussian, except for the [O III] 4959, 5007 doublet lines, which are modeled with two Gaussians. One accounts for the line core and the other for a possible blue wing. The details of the fitting algorithm and spectral parameters can be found in Dong et al. (2011) and Zhang et al. (2011).
2.2. Mid-Infared Data
We cross-correlate our SDSS Type 1 AGN catalog with the WISE All Sky Data Release (Wright et al. 2010) catalog using a match radius of 3 arcseconds to construct the mid-infrared detected type 1 AGN sample. Nearly all sources in our sample are detected by WISE (4174 out of 4178). We refer to the WISE Vega magnitude as , , and for the 3.4, 4.6, 12, and 22m bands, respectively. We reject the sources that have signal to noise ratio less than 3 (SN) in any WISE band. Radio loud AGNs are rejected according to the catalog by Lu et al. (2010) to avoid contamination to [O III] flux and continuum flux. The final sample has 3336 sources, and we call it ’extended sample’ hereafter. We further make a redshift cut of z0.3 to minimize potential cosmological evolution and uncertainty in the -correction that might complicate the correlation analysis. This ’base sample’ consists of 608 sources. The magnitude in each band is converted to according to the published WISE zero points, and the -correction is made by interpolating the Spectral Energy Distribution (SED) at rest-frame wavelengths of 3.4, 4.6, 12, and 17m. The -corrected luminosities in each band are marked as , , and . For every source we connect the adjacent bands on the versus diagram to approximate the MIR SED, and integrate the SED from 3.4 to 17m to obtain the total MIR luminosity, denoted as .
3. Distinction between the [O III] Core and Wing Component
Zhang et al. (2011) found that the equivalent width (EW) of the core component of [O III] correlates negatively with (Baldwin effect) while the wing component displays no or a weak anti-Baldwin effect. The different behaviors suggest that the two components come from distinct gas components regulated by different physical processes. The gaseous kinematics of the [O III] core traces the motion of stars in the gravitational potential well of bulges (e.g. Nelson et al. 2000; Wang & Lu 2001; Komossa et al. 2008), indicating that the [O III] core is emitted by the photo-ionized ISM in the galaxy bulge. This is supported by imaging spectroscopic observations of nearby Seyfert galaxies, which show that the gaseous and stellar kinematics are coupled (e.g. Dumas et al. 2008). On the other hand, the wing is much broader than the core but narrower than broad lines, indicating that its emitting region is much closer to the nuclei than the core component. Furthermore, the wings are usually blueshifted up to 1000 km s-1, suggesting they are from an outflow component. High spatial resolution spectroscopic observations of nearby Seyfert galaxies revealed individual high velocity knots up to a velocity of 3000 km s-1 on scales from parsecs to up a hundred parsecs (e.g. Crenshaw et al 2010). All these observations suggest that the wing component is formed in the outflow at a few to a few hundred parsecs from the nuclei.
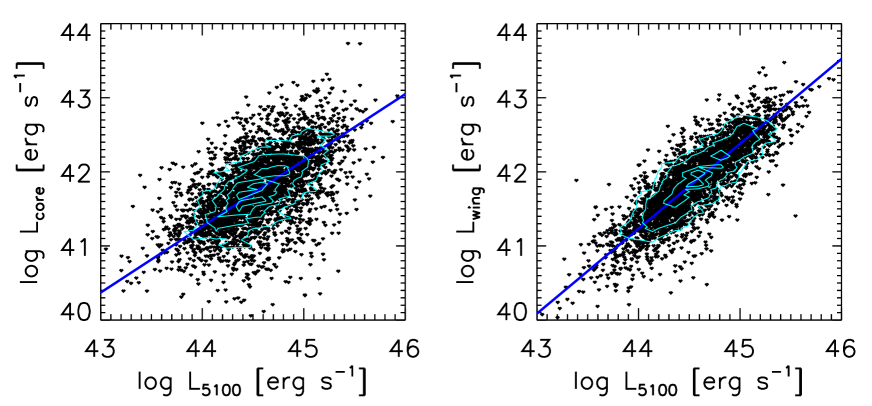
To examine the difference between the core and the wing in detail, we plot the luminosities of the [O III] core and wing against in Figure 1 using the extended sample. Obviously, both the core and the wing luminosities correlate with . The best fit of a log-linear model yields a slope of 0.860.01 for the core component, and 1.140.01 for the wing component. These slopes are consistent with the analysis of Zhang et al (2011) on the Baldwin effect. However, the plot reveals an interesting feature that the correlation is much tighter for the wing than for the core. Qualitatively, the scatters to the best fit of the log-linear model are 0.29 dex for the wing, and 0.42 dex for the core. The difference is significant according to test with a chance probability . The correlates more tightly with the the broad H luminosity, which used for bolometric luminosity estimation in next section, than the does for the basic sample. Note that the decomposition into the wing and the core, and other measurements introduce an uncertainty of about 0.15 dex in the EWs of the wing and the core.111For every source, we use best-fit 2-Gaussian model of the [O III] line plus the measurement errors of the SDSS spectrum to generate a new mock spectrum, then fit the mock [O III] line with two Gaussians. Statistically in the extended sample, the standard deviations of the difference between the output and input fluxes are 0.12 and 0.15 dex for the core and wing components, respectively.
The tighter correlation between the wing and the continuum luminosity indicates that outflows do not change dramatically from object to object, while the larger scatter in the core component suggests that the variations of ISM states like density, density profile, ionization state etc., are pronounced. Physically, the ISM gas in the bulge is regulated by several physical processes, such as gas accretion, star-formation, stellar wind and AGN feedback. The competition between different processes may lead to very diverse physical conditions of the gas among AGNs, which introduces a scatter in the correlation. Interestingly, Zhang et al. (2011) found that the EW of the [O III] core correlates strongest with the outflow velocity of the whole [O III] profile (the outflow velocities being negative due to the outflow, hence the correlation), suggesting the interplay of the outflow and ISM of the galaxy bulge. This can be interpreted most directly in terms of AGN feedback: high velocity outflows blow away the ISM in the host bulge. Also, continuum variations may introduce a larger scatter in the core component than in the wing component because the strength of the core component depends on the long-term variability while the strength of the wing component follows more closely the continuum variations (Zhang et al. 2013). The effect of the variability depends on the light curves over time scales of years.
4. Correlation between and AGN properties
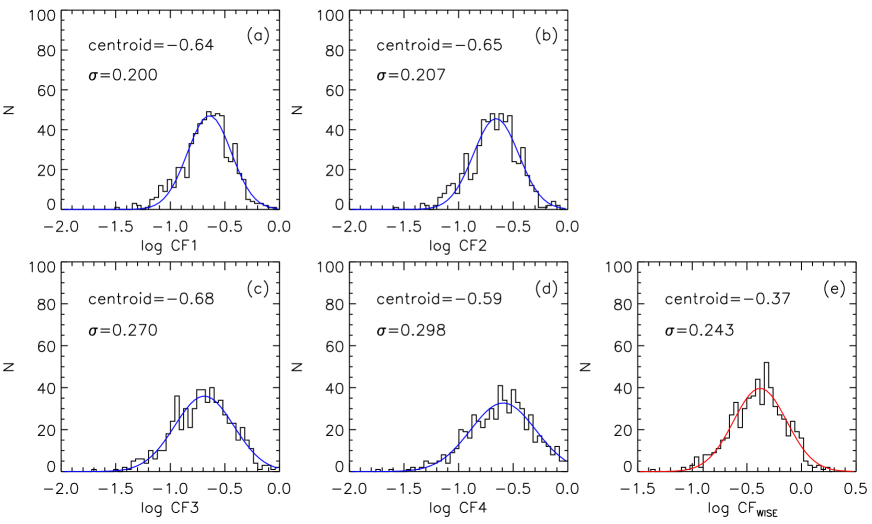
We use the ratios of mid-infrared to bolometric luminosities to quantify the MIR , i.e. the relative contribution of MIR to bolometric luminosity. The bolometric luminosity is estimated from the broad line H luminosity using a bolometric correction factor of 170, which is combining =12.17 in Richards et al. (2006) and =14 in Stern & Laor (2012).222The bolometric correction may depend on the accretion rate and luminosity (e.g. Vasudevan & Fabian 2007; Lusso et al. 2012). This is similar to the adopted in Stern & Laor (2012). We do not use directly as an estimate for the bolometric luminosity, because it may be subject to host contamination and the optical-UV slope gets bluer in higher luminosity AGN (See Section 4.1 in Zhang et al. (2013) for details). The median bolometric luminosity of our sample is erg s-1. In Figure 2 we plot the histograms of mid-infrared luminosity to bolometric luminosity for the individual wavelengths (Panels a to d) and for the total MIR luminosity (Panel e). All histograms show a log-normal distribution. For , the distribution is centered at log = -0.37 (43%) and has a dispersion of 0.243 dex. To first order, this means a covering factor of 43%, and is consistent with the type 2 fraction of 50% at this luminosity in literature (e.g. Hao et al. 2005; Lawrence & Elvis 2010). However, one needs to caution that the type 2 fraction may not be equal to the covering factor of warm dust. Anisotropy in primary continuum and IR emission, presence of large scale obscuring material and hot dust that emits at wavelength shorter than 3.4m lead to deviation of one from another (Calderone et al. 2012; Roseboom et al. 2013; Ma & Wang 2013).
The spreads over a dynamic range (the range it spans) of more than 1.8 dex at the 17m band and the dynamic range increases with increasing wavelength. This trend is clearly seen in Figure 2 in panel (a) to (d) respectively. The ’s of increase from 0.200 dex at 3.4m to 0.298 dex at 17m. One possible reason of increasing dispersion with wavelength is that star-formation contributes a large fraction of emission at longer wavelengths. As discussed at the beginning of Section 5, star-formation would contribute less than 10% at 17m, thus introducing a dispersion less than 0.04 dex. This alone is not enough to account for the 0.22 dex difference between dispersions of and . The intrinsic variance after subtracting the measurement errors in IR luminosity still show a difference of 0.20 dex. There are two possibilities for this difference: 1) The 17m emission is from the dust torus but the fraction of warm dust in the torus varies drastically from object to object due to either different degree of clumpiness or different optical depth of the torus. 2) There is an additional warm dust component, and the contribution from the additional component varies. As discussed in Section 5.1, the torus explanation is inconsistent with our findings, and we argue below that the latter is plausible.
4.1. Correlations between and fundamental AGN properties
First, we analyze how correlate with redshift and the AGN fundamental
parameters, such as , and using
the basic sample. The results are summarized in column 1, 2, 3, 4 of Table 1.
We calculate the black hole masses based on the FWHM of broad H and using
the formalism presented in Wang et al. (2009, their Eqn. 11).
The Eddington ratio () is the ratios between the bolometric and Eddington luminosities:
, (/) erg s-1.
We use Spearman correlation coefficient () as a
non-parametric measure of the statistical dependence between two quantities.
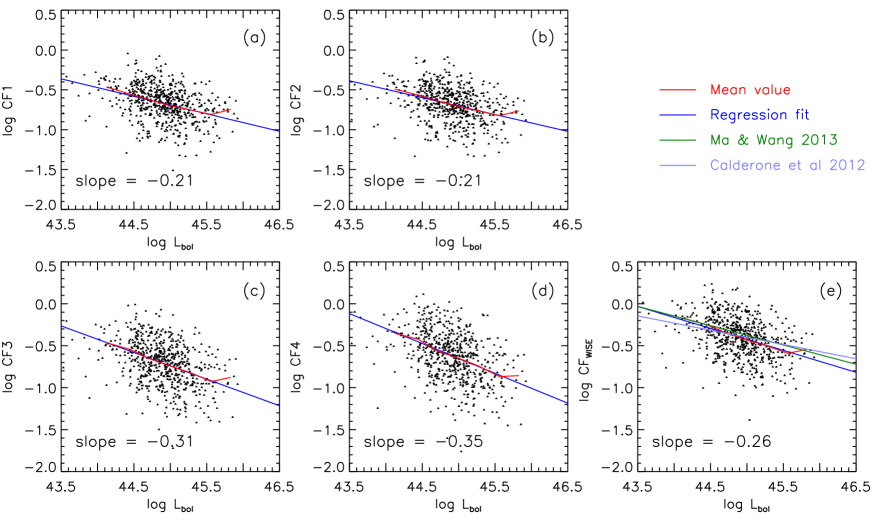
We find that the correlate negatively with and , but very weakly with . We get , , , , and respectively as shown in Figure 3. The typical error of the slopes is 0.03. These results are fully consistent with previous works (Maiolino et al. 2007; Treister et al. 2008; Calderone et al. 2012; Ma & Wang 2013; Roseboom et al. 2013). We plot the best regression fits in Calderone et al. (2012) and Ma & Wang (2013) on Panel (e) to illustrate the consistency. Calderone et al. (2012) integrated the MIR luminosity at 2.1-13.7m, and Ma & Wang (2013) used 3-10m luminosity. To make a fair comparison, we add 0.184 dex to the in Ma & Wang (2013) to account for the shorter wavelength range. The 0.184 dex is the mean ratio of 3.4-17m luminosity to 3.4-11.6m luminosity in our sample. We do not make any correction to the regression fit in Calderone et al. (2012) because the gain in 2-3.4m approximately equals to the loss in 13.7-17m according to the mean SED of all quasars in Richards et al. (2006). We can see that the fitting lines from literatures and our best regression fit are consistent with each other at this luminosity range. This further supports the bolometric correction we adopt is reasonable.
The slopes of versus relations are -0.22, -0.23, -0.35, -0.42, -0.30 for L1, L2, L3, L4, and respectively, consistent with previous works (e.g. Mor et al. 2011; Ma & Wang 2013). The lack of dependence of on is reported by many authors (Cao et al. 2005; Mor et al. 2011; Ma & Wang 2013). Considering the limited range of (1.5 dex) for our sample, we refrain from over-interpreting this result.
4.2. Correlations between and narrow emission line properties
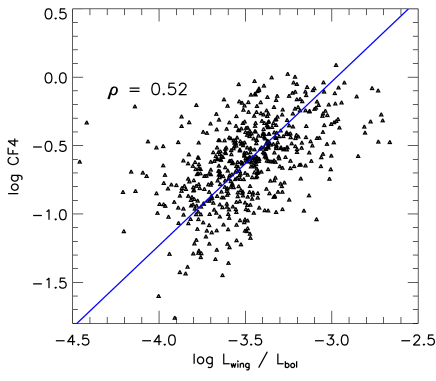
Next, we explore whether the MIR emission is linked to the properties of optical narrow emission lines as represented by [O III] . We present the results of correlation analysis between and the [O III] total, core, wing luminosity to ratios using the basic sample. The results are summarized in column 5, 6, 7 of Table 1. The in all 4 bands correlate significantly with /. Among them, the strongest one is between and / with . The correlation weakens as wavelength decreases: with 0.47, 0.36, 0.32 between / and , and , respectively. This is in parallel with the increasing dynamic range of the with wavelengths. Note that the bolometric correction has scatters of order 0.38 dex. So it is likely that the weakening of the correlations is a combination of decreasing dynamic range and relatively large uncertainty in the bolometric correction. The physical reason of increasing dynamic range with increasing wavelength is discussed in Section 5.3. We plot versus / in Figure 4. A log linear fit yields a slope of 1.190.04 with an scatter of 0.308 dex. This scatter is significantly larger than the combinations of measurement errors: 0.11 dex in L4/ and 0.15 dex in /, indicating that there is a considerable intrinsic scatter in this relation. No correlation is found between outflow velocity and any IR properties in our sample.
5. Discussion
To facilitate discussions on the implication of the correlation between / and L4/, we note that the star-formation contamination is likely small in the MIR band for these luminous type 1 AGNs in our sample. For most of our sources, the infrared luminosity at 17m is in the range of to erg s-1 ( to ). According to Fig 10 of Deo et al. (2009), starburst contribution is likely less than 10% at m and a few percent in the L1 band. This is more likely to be true because we have removed any source with substantial stellar contamination in optical. In the following sections, we will discuss the location of the warm dust and its relation with torus in light of the above results.
5.1. Classical Steady Torus?
Judging from studies of AGN at subarcsecond resolution in the MIR, the majority of MIR emission originates from the central few pc region (Jaffe et al. 2004; Tristram et al. 2007). In NGC 1068, about 75% of the MIR emission is from the central unresolved core (Bock et al. 2000). This was believed to be the torus, and a variety of torus models were constructed to match the NIR–MIR SED (e.g. Fritz et al. 2006; Hönig et al. 2006; Schartmann et al. 2008; Nenkova et al. 2008a, b). If the dust dominates the MIR emission, as the torus acts to confine the ionization cone, there should be an anti-correlation between the torus subtending angle and the covering factor of NLR; we thus should obtain a negative correlation between and /. This is however in contradiction to the observation.
5.2. Dusty NLR clouds?
NLR is theoretically expected to contain dust (Netzer & Laor 1993; Dopita et al. 2002). Observationally, extended polar MIR emission is found around the compact cores of several AGNs (See Section 1). Groves et al. (2006) modeled the narrow line spectrum of NGC 4151 with dusty photo-ionization models, and found that 10–50% of its 25m emission is from the NLR dust. The imaging observations also indicate that 27% of MIR emission emerges from a region coincident with the NLR in NGC 4151 (Radomski et al. 2003). The warm dust extends from the unresolved core to about 100pc. Mor et al. (2009) fitted the MIR spectra of PG QSOs with 3 components: a black body, the clumpy torus emission (Nenkova et al. 2008a,b) and the NLR dust. They derived that above 18m, the NLR dust contributes as much as 40% of the emission. Schweitzer et al. (2008) demonstrated the the NLR dust could produce the silicate emission features observed in AGNs. As the cold gas and the dust are coupled in the NLR, this would naturally explain the correlation between and / and the correlation weakens at shorter infrared wavebands, qualitatively.
However, the NLR dust models do not consider the dust in the outflow component of NLR, so they can not explain why is much more strongly correlated with / than with /. Furthermore, most of the infrared emission from 5 to 18m is attributed to the torus emission, which is not consistent with more recent higher resolution imaging observations in several nearby Seyfert galaxies (see §1). In Mor et al. (2009), the distance of NLR dust is estimated to be pc, where is the bolometric luminosity in unit of erg s-1. In high luminosity sources, we lack observational evidence that the outflow may reach that far from the nuclei. Although detailed model is needed to predict the infrared spectrum, it is clear that any optical thin dust in the outflow region will be hotter than that in the more distant classical NLR, and will contribute significantly to emission below 15 m. Alternatively, the dust clouds in outflows are optically thick to infrared light, radiative transfer effect would result in much colder infrared emission. We therefore do not think that dusty NLR clouds on scales of 100 pc are responsible for our observed correlation of with .
5.3. Dusty Outflows?
It was pointed out by Krolik and Begelman (1988) that a steady doughnut torus suffers the problem that there is not enough vertical motions capable of sustaining the H/R1 geometry. One solution to this problem is assuming that the dust is entrained in the magnetically driven accretion disk wind (Emmering, Blandford & Shlosman 1992; Elitzur & Shlosman 2006), and the outer part of the outflow acts as a clumpy torus. Alternatively, the IR radiation pressure on dust may also offer enough pressure to support a thick torus, even launches an outflow (Krolik 2007; Dorodnitsyn et al. 2011, 2012). In this type of dynamical models, the outflow and the torus are naturally linked. A connection between the outflow and the dust emission is expected. The detection of dominant MIR emission in polar direction led Hönig et al. (2012) to propose that the polar dust is entrained in a radiatively-driven dusty winds. This dust component is an inward extent of NLR dust observed in many nearby AGNs but lies only a few pc away from the nuclei. This is where the outflow originates and accelerated. In this paradigm, the outflow gas and the warm dust share similar covering factor, and would lead to our finding of a positive correlation between and / naturally. The contribution of the polar warm dust to the mid-infrared emission increases with wavelength, so the correlation between and / strengthens with wavelength. By comparison, the static classical NLR traced by the [O III] core component lies further from the nuclei. The dust embedded in the static NLR emit dominantly at wavelength longer than 20m, thus only connects to the warm dust loosely. If the correlation between the warm dust and the outflow strength is really driven by the dust in the polar winds, an implication is that the pc scale MIR elongation in NGC 1068, the Circinus galaxy and NGC 424 may not be special cases, but a common phenomenon for Seyfert galaxies. Most of the warm dust may reside in the outflow instead of in the torus. Besides, the outflow may have a significant effect on the dust re-distribution by transporting the dust from the central region to larger scales.
References
- Adelman-McCarthy et al. (2006) Adelman-McCarthy, J. K., Agüeros, M. A., Allam, S. S., et al. 2006, ApJS, 162, 38
- Bock et al. (2000) Bock, J. J., Neugebauer, G., Matthews, K., et al. 2000, AJ, 120, 2904
- Braatz et al. (1993) Braatz, J. A., Wilson, A. S., Gezari, D. Y., Varosi, F., & Beichman, C. A. 1993, ApJ, 409, L5
- Calderone et al. (2012) Calderone, G., Sbarrato, T., & Ghisellini, G. 2012, MNRAS, 425, L41
- Cao (2005) Cao, X. 2005, ApJ, 619, 86
- Cameron et al. (1993) Cameron, M., Storey, J. W. V., Rotaciuc, V., et al. 1993, ApJ, 419, 136
- Crenshaw et al. (1999) Crenshaw, D. M., Kraemer, S. B., Boggess, A., et al. 1999, ApJ, 516, 750
- Crenshaw et al. (2010) Crenshaw, D. M., Schmitt, H. R., Kraemer, S. B., Mushotzky, R. F., & Dunn, J. P. 2010, ApJ, 708, 419
- Das et al. (2005) Das, V., Crenshaw, D. M., Hutchings, J. B., et al. 2005, AJ, 130, 945
- Deo et al. (2009) Deo, R. P., Richards, G. T., Crenshaw, D. M., & Kraemer, S. B. 2009, ApJ, 705, 14
- Dong et al. (2008) Dong, X., Wang, T., Wang, J., et al. 2008, MNRAS, 383, 581
- Dong et al. (2011) Dong, X.-B., Wang, J.-G., Ho, L. C., et al. 2011, ApJ, 736, 86
- Dopita et al. (2002) Dopita, M. A., Groves, B. A., Sutherland, R. S., Binette, L., & Cecil, G. 2002, ApJ, 572, 753
- Dorodnitsyn et al. (2008) Dorodnitsyn, A., Kallman, T., & Proga, D. 2008, ApJ, 687, 97
- Dorodnitsyn et al. (2011) Dorodnitsyn, A., Bisnovatyi-Kogan, G. S., & Kallman, T. 2011, ApJ, 741, 29
- Dorodnitsyn & Kallman (2012) Dorodnitsyn, A., & Kallman, T. 2012, ApJ, 761, 70
- Dumas et al. (2008) Dumas, G., Mundell, C. G., Emsellem, E., & Nagar, N. 2008, Astronomische Nachrichten, 329, 908
- Elvis et al. (1994) Elvis, M., Wilkes, B. J., McDowell, J. C., et al. 1994, ApJS, 95, 1
- Elitzur & Shlosman (2006) Elitzur, M., & Shlosman, I. 2006, ApJ, 648, L101
- Emmering et al. (1992) Emmering, R. T., Blandford, R. D., & Shlosman, I. 1992, ApJ, 385, 460
- Fritz et al. (2006) Fritz, J., Franceschini, A., & Hatziminaoglou, E. 2006, MNRAS, 366, 767
- Groves et al. (2006) Groves, B., Dopita, M., & Sutherland, R. 2006, A&A, 458, 405
- Hao et al. (2005) Hao, L., Strauss, M. A., Fan, X., et al. 2005, AJ, 129, 1795
- Heckman et al. (1981) Heckman, T. M., Miley, G. K., van Breugel, W. J. M., & Butcher, H. R. 1981, ApJ, 247, 403
- Hönig et al. (2006) Hönig, S. F., Beckert, T., Ohnaka, K., & Weigelt, G. 2006, A&A, 452, 459
- Hönig et al. (2010) Hönig, S. F., Kishimoto, M., Gandhi, P., et al. 2010, A&A, 515, A23
- Hönig et al. (2012) Hönig, S. F., Kishimoto, M., Antonucci, R., et al. 2012, arXiv:1206.4307
- Jaffe et al. (2004) Jaffe, W., Meisenheimer, K., Röttgering, H. J. A., et al. 2004, Nature, 429, 47
- Keating et al. (2012) Keating, S. K., Everett, J. E., Gallagher, S. C., & Deo, R. P. 2012, ApJ, 749, 32
- Komossa et al. (2008) Komossa, S., Xu, D., Zhou, H., Storchi-Bergmann, T., & Binette, L. 2008, ApJ, 680, 926
- Konigl& Kartje (1994) Konigl, A., & Kartje, J. F. 1994, ApJ, 434, 446
- Krolik & Begelman (1988) Krolik, J. H., & Begelman, M. C. 1988, ApJ, 329, 702
- Krolik (2007) Krolik, J. H. 2007, ApJ, 661, 52
- Lawrence & Elvis (2010) Lawrence, A., & Elvis, M. 2010, ApJ, 714, 561
- Lu et al. (2010) Lu, Y., Wang, T.-G., Dong, X.-B., & Zhou, H.-Y. 2010, MNRAS, 404, 1761
- Lusso et al. (2012) Lusso, E., Comastri, A., Simmons, B. D., et al. 2012, MNRAS, 425, 623
- Ma & Wang (2013) Ma, X.-C., & Wang, T.-G. 2012, arXiv:1212.4245
- Maiolino et al. (2007) Maiolino, R., Shemmer, O., Imanishi, M., et al. 2007, A&A, 468, 979
- Mor et al. (2009) Mor, R., Netzer, H., & Elitzur, M. 2009, ApJ, 705, 298
- Mor & Trakhtenbrot (2011) Mor, R., & Trakhtenbrot, B. 2011, ApJ, 737, L36
- Nelson (2000) Nelson, C. H. 2000, ApJ, 544, L91
- Nenkova et al. (2008) Nenkova, M., Sirocky, M. M., Ivezić, Ž., & Elitzur, M. 2008, ApJ, 685, 147
- Nenkova et al. (2008) Nenkova, M., Sirocky, M. M., Nikutta, R., Ivezić, Ž., & Elitzur, M. 2008, ApJ, 685, 160
- Netzer & Laor (1993) Netzer, H., & Laor, A. 1993, ApJ, 404, L51
- Packham et al. (2005) Packham, C., Radomski, J. T., Roche, P. F., et al. 2005, ApJ, 618, L17
- Raban et al. (2009) Raban, D., Jaffe, W., Röttgering, H., Meisenheimer, K., & Tristram, K. R. W. 2009, MNRAS, 394, 1325
- Radomski et al. (2003) Radomski, J. T., Piña, R. K., Packham, C., et al. 2003, ApJ, 587, 117
- Richards et al. (2006) Richards, G. T., Lacy, M., Storrie-Lombardi, L. J., et al. 2006, ApJS, 166, 470
- Roseboom et al. (2013) Roseboom, I. G., Lawrence, A., Elvis, M., et al. 2013, MNRAS, 429, 1494
- Schartmann et al. (2008) Schartmann, M., Meisenheimer, K., Camenzind, M., et al. 2008, A&A, 482, 67
- Schmitt et al. (2003) Schmitt, H. R., Donley, J. L., Antonucci, R. R. J., Hutchings, J. B., & Kinney, A. L. 2003, ApJS, 148, 327
- Schweitzer et al. (2008) Schweitzer, M., Groves, B., Netzer, H., et al. 2008, ApJ, 679, 101
- Stern & Laor (2012) Stern, J., & Laor, A. 2012, MNRAS, 423, 600
- Treister et al. (2008) Treister, E., Krolik, J. H., & Dullemond, C. 2008, ApJ, 679, 140
- Tresch-Fienberg et al. (1987) Tresch-Fienberg, R., Fazio, G. G., Gezari, D. Y., et al. 1987, ApJ, 312, 542
- Tristram et al. (2007) Tristram, K. R. W., Meisenheimer, K., Jaffe, W., et al. 2007, A&A, 474, 837
- Tristram et al. (2012) Tristram, K. R. W., Schartmann, M., Burtscher, L., et al. 2012, arXiv:1204.2823
- Vasudevan & Fabian (2007) Vasudevan, R. V., & Fabian, A. C. 2007, MNRAS, 381, 1235
- Wang & Lu (2001) Wang, T., & Lu, Y. 2001, A&A, 377, 52
- Wang et al. (2009) Wang, J.-G., Dong, X.-B., Wang, T.-G., et al. 2009, ApJ, 707, 1334
- Wright et al. (2010) Wright, E. L., Eisenhardt, P. R. M., Mainzer, A. K., et al. 2010, AJ, 140, 1868
- Zhang et al. (2011) Zhang, K., Dong, X.-B., Wang, T.-G., & Gaskell, C. M. 2011, ApJ, 737, 71
- Zhang et al. (2013) Zhang, K., Wang, T.-G., Gaskell, C. M., & Dong, X.-B. 2013, ApJ, 762, 51
| z | / | / | / | ||||
|---|---|---|---|---|---|---|---|
| 0.06(1e-01) | -0.40(3e-25) | -0.38(2e-22) | -0.10(7e-03) | 0.28(1e-12) | 0.09(2e-02) | 0.45(1e-32) | |
| 0.08(2e-02) | -0.37(5e-22) | -0.32(8e-17) | -0.12(1e-03) | 0.10(1e-02) | -0.07(6e-02) | 0.32(3e-16) | |
| 0.09(1e-02) | -0.35(4e-20) | -0.33(2e-17) | -0.09(1e-02) | 0.14(5e-04) | -0.04(2e-01) | 0.36(8e-20) | |
| 0.05(1e-01) | -0.40(4e-25) | -0.38(5e-23) | -0.10(1e-02) | 0.31(2e-15) | 0.12(1e-03) | 0.47(4e-35) | |
| 0.02(5e-01) | -0.42(2e-27) | -0.40(3e-25) | -0.10(6e-03) | 0.43(9e-29) | 0.25(9e-11) | 0.52(1e-43) |
a For each entry, we list the Spearman rank correlation
coefficient () and the probability of the null hypothesis that
the correlation is not present () in parenthesis,
for the 608 objects in the basic sample.0.50 are marked in Boldface.