The precision and accuracy of early Epoch of Reionization foreground models: comparing MWA and PAPER 32-antenna source catalogs
Abstract
As observations of the Epoch of Reionization (EoR) in redshifted 21cm emission begin, we asses the accuracy of the early catalog results from the Precision Array for Probing the Epoch of Reionization (PAPER) and the Murchison Widefield Array. The MWA EoR approach derives much of its sensitivity from subtracting foregrounds to % precision while the PAPER approach relies on the stability and symmetry of the primary beam. Both require an accurate flux calibration to set the amplitude of the measured power spectrum. The two instruments are very similar in resolution, sensitivity, sky coverage and spectral range and have produced catalogs from nearly contemporaneous data. We use a Bayesian MCMC fitting method to estimate that the two instruments are on the same flux scale to within 20% and find that the images are mostly in good agreement. We then investigate the source of the errors by comparing two overlapping MWA facets where we find that the differences are primarily related to an inaccurate model of the primary beam but also correlated errors in bright sources due to clean. We conclude with suggestions for mitigating and better characterizing these effects.
Subject headings:
extra-galactic — catalogs — instrumentation: radio1. Introduction
Recent interest in very high redshift () 21 cm HI emission from the Epoch of Reionization (EoR, see reviews in Zaldarriaga et al., 2004; McQuinn et al., 2006; Furlanetto et al., 2006; Morales & Wyithe, 2010) has inspired a renaissance of meter wavelength ( MHz) radio astronomy Several telescopes, including the Giant Metre-Wave Telescope (GMRT; Swarup, 1991)111http://gmrt.ncra.tifr.res.in/, the Low Frequency Array (LOFAR; Rottgering et al., 2006)222http://www.lofar.org, the Murchison Wide-field Array (MWA; Tingay et al., 2012; Bowman et al., 2012)333http://mwatelescope.edu, and the Precision Array for Probing the Epoch of Reionization (PAPER; Parsons et al., 2010)444http://eor.berkeley.edu are beginning to characterize foregrounds and perform their first deep integrations and set upper limits (Paciga et al., 2011, 2013). Both PAPER and the MWA operate in the southern hemisphere, as will the future Square Kilometer Arrays (SKA).
The EoR signal will be a small spatial and spectral variation on top of bright foreground sources (Matteo et al., 2004; Oh & Mack, 2003; Jelić et al., 2008; Bowman et al., 2006). The separation of the EoR from these foregrounds is expected to be the dominant source of uncertainty and has been the focus of much study. Though the spatial RMS of the unresolved background was initially calculated to be larger than the EoR signal (Matteo et al., 2002), later simulations found that the spectral smoothness of the unresolved background enabled accurate subtraction to acceptable levels in the modes of interest (Morales & Hewitt, 2004; Morales et al., 2006; Wang et al., 2006; Jelić et al., 2008; Bowman et al., 2009; Datta et al., 2010; Chapman et al., 2012; Cho et al., 2012) or just by avoiding the contaminating modes entirely (Parsons et al., 2012). Simulations tackling parameter estimation, polarization and foreground subtraction all assume that all unresolved sources will be removed such that the errors are indistinguishable from the unresolved point source background both spatially and spectrally (Liu & Tegmark, 2011; Bowman et al., 2009; Liu et al., 2009; Bowman et al., 2009; Harker et al., 2010; Gleser et al., 2008; Petrovic & Oh, 2011). The level of source residual varies between these simulations. While Bowman et al. (2009) assume that subtraction will achieve a 10 mJy residual, Liu et al. (2009) test a range of scenarios up to 100 mJy residual flux.555The ultimate flux limit to which sources can be identified and removed is set by the resolution of the instrument. Bright extra-galactic point sources increase in number with decreasing brightness (Condon et al., 1998; Lane et al., 2008; Baldwin et al., 1985; Hales et al., 1988; McGilchrist et al., 1990). At some source flux level, the number of sources per synthesized beam becomes greater than one. For PAPER this limit is 100 mJy, while the MWA reaches to tens of mJy. Since even the quietest fields of view contain several 40 Jy sources, these residual levels translate to removal precision requirements of % and % respectively! In contrast, most radio point source catalogs have flux accuracies in the 5 to 20% range. Studies of errors in bright source removal are limited. In one simulation that included bright source subtraction, Datta et al. (2010) found that point-source foregrounds extended further into the spectral dimension than were previously predicted into the so-called “wedge”. This turns out to be equivalent to the statement that longer baselines are contaminated at higher delays which defines the Parsons et al “wall” that defines the modes accessible to PAPER. In both cases the implication is that the flux accuracy requirement extends to the spectral dimension.
The requirement of point source subtraction imposes accuracy requirements in source modeling which have rarely been achieved in practice. According to estimates of catalog flux accuracy by Vollmer et al. (2005, reproduced in Table 1), most catalog fluxes at high frequencies agree to within . The study included only one catalog in the EoR band (4C), which had by far the largest flux error (15%). Accordingly, attention has begun to focus on approaches which largely avoid the need to model and subtract sources to high accuracy (for example, Parsons et al., 2012). Even in the absence of a need for a highly accurate sky model for EoR experiments, uncertainty in calibrator flux translates directly into the overall amplitude of the power spectrum measurement which limits the constraining power of the observation. Reliable calibrators are also necessary for modeling the instrument primary beam (which enters into the -space window function and noise estimates) and for generating reliable and repeatable instrument calibrations. For example, attempts to model the primary beam are currently limited by the accuracy to which source fluxes are known over a wide enough area of sky to fully sample the beam (Pober et al., 2012).
| Survey | Source | Ref | Error | |||
|---|---|---|---|---|---|---|
| Name | (MHz) | (′) | (mJy) | count | (%) | |
| PMN | 4850 | 3.5 | 20 | 50814 | 1 | 5 |
| PKS | 2700 | 8.0 | 50 | 8264 | 2 | |
| FIRST | 1400 | 0.083 | 1 | 811117 | 3 | 5 |
| NVSS | 1400 | 0.75 | 2 | 1773484 | 4 | — |
| SUMSS | 843 | 0.75 | 8 | 134870 | 5 | 3 |
| MRC | 408 | 3.0 | 700 | 12141 | 6 | 7 |
| TXS | 365 | 0.1 | 250 | 66841 | 7 | 5 |
| WISH | 325 | 0.9 | 10 | 90357 | 8 | 10 |
| WENSS | 325 | 0.9 | 18 | 229420 | 9 | 6 |
| MIYUN | 232 | 3.8 | 100 | 34426 | 10 | 5 |
| 4C | 178 | 11.5 | 2000 | 4844 | 11 | 15 |
| MWA32 | 150 | 15 | .5 to 10 Jy | 1553 | 12 | 20 |
| PAPER32 | 150 | 15 | 10 Jy | 486 | 13 | 20 |
Note. — References. (1) Wright & Otrupcek (1990); Griffith et al. (1994); (2) Otrupcek & Wright (1991); (3) White et al. (1997); (4) Condon et al. (1998); (5) Mauch et al. (2003); (6) Large et al. (1981, 1991); (7) Douglas et al. (1996); (8) Breuck et al. (2002); (9) Rengelink et al. (1997); (10) Zhang et al. (1997); (11) Pilkington & Scott (1965); Gower et al. (1967); (12) Williams et al. (2012); (13) Jacobs et al. (2011)
The construction of a catalog necessarily involves the compression and omission of information, but in the context of the above goals, we can ask three basic questions when comparing catalogs:
-
1.
How were the flux scales established for each catalog, and are they consistent with each other? This is a question about the average properties of the catalog fluxes, and does not imply that any particular source has an accurate flux.
-
2.
Are the random errors in the source fluxes, relative to the fundamental flux scale, correctly described by the error bars presented?
-
3.
Are there systematic effects, known or suspected, which are not reasonably described by the error bars given?
Answering the first question requires establishing a certain source or sources to use as references, and a method for comparing to them. Ideally, a detailed model exists for the calibration sources, including their spatial and spectral structure at the frequencies of interest, as well as a model for their variability, if any. A key reference catalog for southern hemisphere low frequency radio sources is the fan-beam survey with the Culgoora Circular Array666Normally referred to as the Culgoora Radio Heliograph (CRH), at nightfall the telescope became the Culgoora Circular Array (CCA) (CCA; Slee, 1995; Slee & Higgins, 1975). The CCA produced the so-called “Culgoora” catalog of fluxes at 80 and 160 MHz. At 160 MHz, the CCA had 1.6′ resolution and a narrow (1 MHz) bandwidth (Sheridan et al., 1973). The CCA catalog’s flux scale is derived from the CKL scale (Conway et al., 1963), as revised in Slee (1995), which is ultimately tied to the flux of Cassiopeia A. The Culgoora catalog was compiled from observations over the years 1970 - 1984. Its status as the only low-frequency radio catalog in the southern hemisphere has placed it a the center of the calibration schemes for both PAPER and MWA, but it is well to keep in mind that is was very different instrument than current EoR telescopes in terms of bandwidth and resolution, and the Culgoora catalog lacks information on the extent and spectral index of sources.
As for the second and third questions, we expect that the various kinds of errors which can occur in reported fluxes to behave differently according to their origin. Errors resulting from random noise are the simplest, and are at a value fixed by the local noise level. In a fractional sense, these errors are worst for the lowest signal-to-noise sources, and indeed, for , reported fluxes from blind catalogs tend to be systematically biased high due to so-called Eddington bias (Eddington, 3) (unless precautions are taken.) Most surveys at low frequencies are not dominated by their random errors. For example, the ongoing GMRT 150 MHz survey777http://tgss.ncra.tifr.res.in/ reaches an RMS noise mJy beam-1, but the flux scale accuracy is limited by systematic errors to about 25%. Errors due to source fitting, photometry, or cleaning of a given source can all be expected to scale in proportion to the source flux, since these methods tend to over- or under-estimate by some fraction of the flux, which means these produce a fixed fractional error. Sources which are affected by the improperly convolved sidelobes of another source can expect to have discrepancies in their recovered flux which are uncorrelated with their flux level. In addition to errors introduced by the data reduction, other kinds of systematic discrepancies between measurements may be introduced either by the instrument or by natural processes. On the instrument side, these effects include an incorrect primary beam model, the presence of radio frequency interference, or improper bandpass and source spectrum calibration. Physical processes include ionospheric variability, interstellar medium scintillation, and intrinsic source variability. Though most catalogs have only a limited model of these kinds of errors folded into the listed error bars, systematic effects are often discernible.
In this paper, we compare the recently published PAPER (Jacobs et al., 2011) and MWA (Williams et al., 2012) catalogs. Because the observations were made by these instruments within months of each other, in overlapping portions of the sky, using very similar configurations and bandwidths, we expect that disagreements between sources due to time variation, spectral slope and confusion are minimized. Nevertheless, specific instrument differences including modeling of the primary beam and cleaning remain between the two catalogs, as well as differing fields-of-view, noise depth, and catalog construction method. Our goal is to further understand the origins of errors in published source fluxes of catalogs from EoR surveys. By limiting the data scope to only published data, we will characterize the degree to which published catalogs provide all the information necessary to reconstruct the sky model. This will further the overarching goal of refining our ability to reliably describe and exchange sky models for the purposes of calibration and consistency checks.
The outline of the paper is as follows. The PAPER and MWA observations are described in Section 2. Section 3 compares the PSA32 and MWA32 catalogs in their region of overlap and introduces a robust statistical comparison method that uses a Markov Chain Monte Carlo (MCMC) algorithm to compute the relative flux scale and its error. Section 4 looks for systematic effects in both data sets by internal comparison of the MWA data and comparison of the PAPER data against the Culgoora catalog. Section 5 summarizes the various errors identified, and concludes with recommendations for future EoR foreground cataloging and results comparison efforts.
2. The MWA32 and PSA32 Data Sets
The MWA in Western Australia and PAPER in South Africa are both actively observing as their commissioning progresses. As part of the EoR effort the observers are generating “global sky models”, a key component of which is a point source catalog. First-look catalogs using data taken during 2010 are now available from both instruments. Relevant data about the two catalogs are listed in Table 2. Both instruments operated 32-antenna arrays centered at an observing frequency near 150 MHz with similar antenna layouts and bandwidth that result in an apparent resolution of 15′.888Sources having more power at lower frequencies can have an effective synthesized beam 35′ wide compared with brighter at the higher end of the bend which would have an effective width of only 15′.
| Telescope | PAPER | MWA |
|---|---|---|
| Resolution [arcmin] | 15 | 15 |
| Bandwidth [MHz] | 60 | 92.16 |
| Center Frequency [MHz] | 145 | 154 |
| Integration Time [minutes] | 30 | 40-200aaIntegration time varies between two the two facets, each of which is a drift scan which effectively spreads the integration time across the image. |
| Image plane RMS [Jy] | 2 | 0.2 |
| Lower flux limit [Jy] | 10 | 0.5 |
| Catalog method | Targets | Blind |
| Area covered [sq deg] | 36000 | 2600 |
| Observation dates | May & Sept 2010 | March 2010 |
The PAPER data set (Jacobs et al., 2011, hereafter PSA32) consisted of observations on two nights separated by 3 months, using 32 single-polarization dipoles with 60 MHz of bandwidth centered at 145 MHz. Both nights were used to make a mosaic covering the entire sky with . The brightest two sources were used for phase calibration and then filtered in delay-delay rate space (Parsons & Backer, 2009). The visibilities were imaged in ten minute transit “snapshots” and then mosaiced into a single HEALPix (Górski et al., 2005) image. An image-based clean(Högbom, 1974) was performed on the brightest sources, but most of the image was left un-cleaned. For this reason the depth of the catalog was kept to the brightest few sources in the sky. The fluxes given in the PSA32 catalog are the peak flux within 30′ of locations of catalog sources chosen from the Molonglo Reference Catalog (MRC; Large et al., 1981, 1991). In a selection designed to be complete at the minimum flux, it includes all sources above 10 Jy as extrapolated to 150 MHz using the catalog spectral index. The PSA32 fluxes compared to MRC and Culgoora showed a similar range of variance about unity flux scale as the MRC and Culgoora showed between themselves.
The MWA32 images were made from several nights of data in March 2010 from scans of two fields centered on RA 9h18m6s, Dec -12d05m45s (Hydra A) and RA 10h20m0s, Dec -10d0m0s (EOR2). Imaging was performed in three 30 MHz bands which were averaged into one 90 MHz wideband image on each field. In this average the three maps were weighted by a positive spectral index of 0.8 to compensate for the average spectral index of -0.8. For sources with a spectral index of -0.8, this will increase the perceived flux by 2.5% as well as slightly shrink the effective PSF by emphasizing higher frequency data. The images include both more integration time and more snapshots, than the PSA32 observations, and were cleaned to a much deeper level. The MWA catalog sources were found blindly in this wide-band image, without any catalog prior. Peaks having , where the noise level is the average nearby image RMS, were fit with two dimensional Gaussians. The sources range in RMS from 167 mJy to 3 Jy, and 0.5 to 10 Jy in amplitude as the noise varies across the map. The catalog lists the Gaussian amplitude of all fits that converged, but not the sizes and orientations of the Gaussians. The derived fluxes were found to be within 30% agreement of the MRC predicted flux, which was then given as the data point uncertainty.
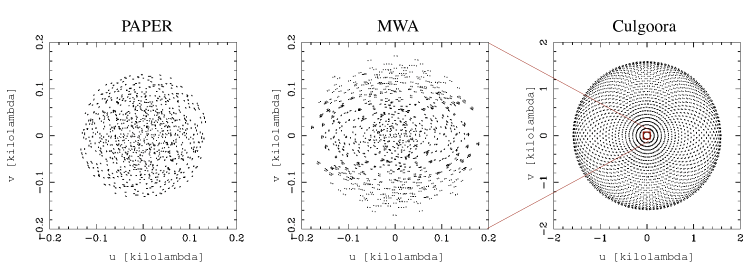
The PAPER flux scale was derived by calibrating each epoch to a single Culgoora source, using 1422-297 for the May and 0521-365 for the September data. The calibration was effectively applied to the entire image by the use of a primary beam model. The MWA flux scale was derived from an ensemble of sources with fluxes at 80 and 160 MHz from the CCA, and 408 MHz from MRC, so the fluxes used by Williams et al. (2012) were not precisely those of the CCA 160 MHz catalog, though they are of course closely tied to them. The use of Culgoora by both instruments to set a flux scale does not of course allow us to address the absolute accuracy of the measurements, which ultimately depends on the CKL flux scale. The applicability of the Culgoora fluxes is more generally subject to some concern. The narrow bandwidth of Culgoora and the lack of precise spectral index information means that, integrated over 100 MHz of bandwidth, a source with a spectral index will appear 5% brighter than a narrow spectrum measurement. Large scale structure invisible to the CCA could substantially boost the flux for resolved sources observed dense aperture arrays like the MWA or PAPER. As shown in Figure 1 the MWA and PAPER 32 antenna arrays are much more compact and have little overlap with the long baselines of the CCA. The images shows the narrow-band coverage; in fact, PAPER and MWA cover nearly 100 times as much space in a multi-frequency synthesis image.
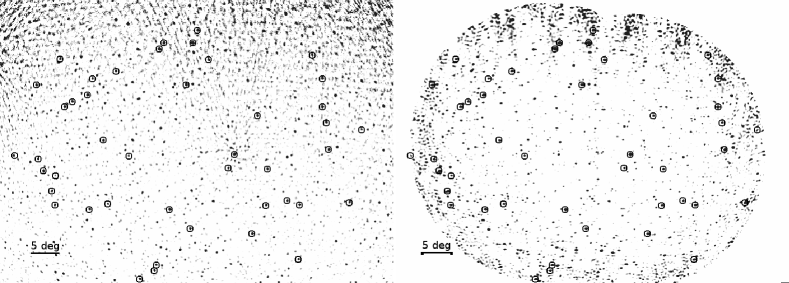
Despite the high level of similarity between the two data sets, there are still important differences which should be carefully noted. Probably most importantly, are the differences in image depth and area. The PSA32 images incorporate data from many different pointings to smoothly map the sky; signal-to-noise is relatively constant across the image, but due to limited deconvolution the dynamic range is lower. The MWA images are more deeply deconvolved but limited in extent. The difference in SNR between the middle and edges is pronounced and comparable to the areas of the PSA32 map dominated by side-lobes. Figure 2 directly compares the images of the overlap region from both instruments.
In addition, spectral slope across the wide 80 MHz bandwidths used by PAPER and MWA could also be a source of intrinsic measurement difference. The images used to build both catalogs incorporated data across the band in a multi-frequency synthesis and thus are unable to directly measure spectral index. The bandwidths are different by 30% which, for sources with large spectral slope999Most radio sources in this band have power law spectra . The average spectral index for radio sources in this band is . will result in slightly different spectral averages. Furthermore, the MWA32 sub bands were weighted by the typical spectral index of , while the PAPER spectrum was not. This will cause most sources to be on average 5% brighter for MWA than for PAPER, additional spectral variations between sources will introduce another 1% variation around this number.
3. Flux Scale Comparison Between Instruments
Each catalog provides a list of sources, each with a flux and flux uncertainty. The PSA32 catalog lists peak flux and surrounding rms, while the MWA32 catalog lists fitted flux and fractional error, assumed to be constant at 30%. For the purposes of the following analysis, we assume these errors correctly describe the instrumental uncertainties. This question is explored further in Section 4.
In the region of overlap between the two surveys, there are 60 MWA entries within 30′ of 41 PSA32 sources. Of these 41 PSA32 sources, 13 have multiple MWA components while the rest are 1:1 matches. In the case of multiple component matches, we pair sources with the highest flux. Images of the regions under comparison along with markers for the 41 overlapping sources are shown in Figure 2.
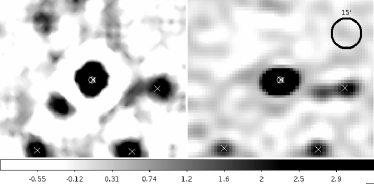
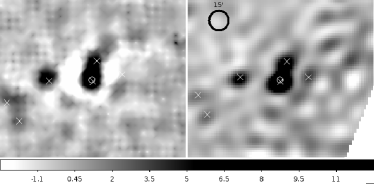
Two of these sources provide instructive examples. Figure 3 shows the PAPER and MWA images for two of the brightest sources which are listed in both catalogs and have multiple MWA components within 30′of a single PAPER source. The first, J0859-257, demonstrates the importance of both cleanand cataloging method. The MWA32 catalog lists two sources in virtually the same location. (They are separated by 1.4’ or 1/10 of a synthesized beam and were given the same truncated J2000 name.). Meanwhile, the PAPER image which was not cleaned to this level has deep side-lobes and excess flux not visible in the MWA. Together these effects contribute to a 180% flux difference between the two (28 Jy for PAPER, (43+6) Jy for MWA). The second source shown, J0745-191, is a classic example of resolution confusion, two sources whose point spread functions significantly overlap. Despite this, the two instruments agree on the brighter flux to 17%.
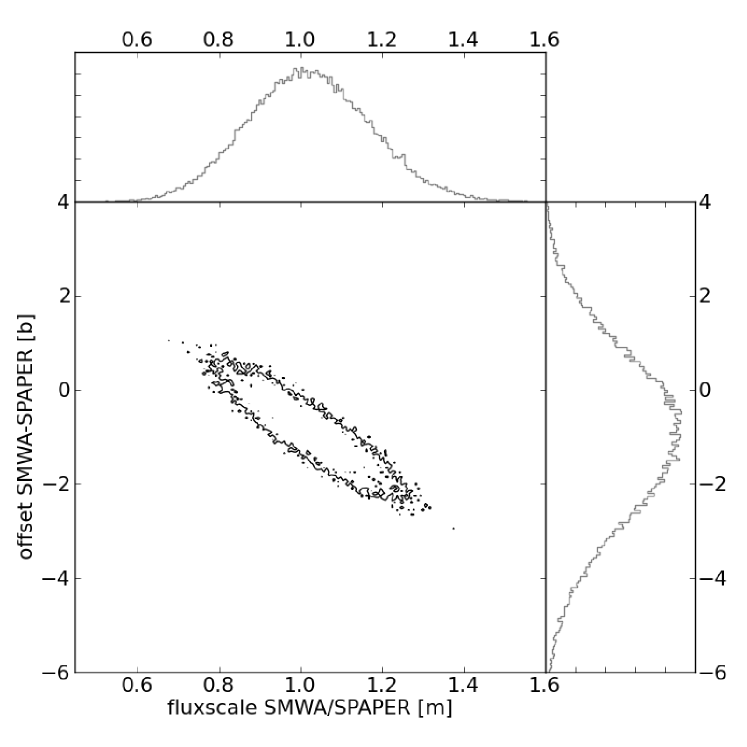
Having obtained a list of corresponding sources, we wish to ask whether the two instruments produce measurements that are consistent with being on the same flux scale, given their reported errors. We thus compute the likelihood that the PSA32 fluxes are related to the MWA fluxes by a simple linear fit, with deviations from this relation due solely to random errors as described by both instruments’ error bars. The likelihood function is given by Hogg et al. (2010) in their §7. We implement a Markov Chain Monte Carlo sampler to sample the posterior probability. At each step of the Markov chain we compute the error and distance of each point as projected orthogonally to the current direction of the line. These differences and errors are then used to form a Gaussian likelihood. The free parameters are the slope and the offset of the flux-flux line.
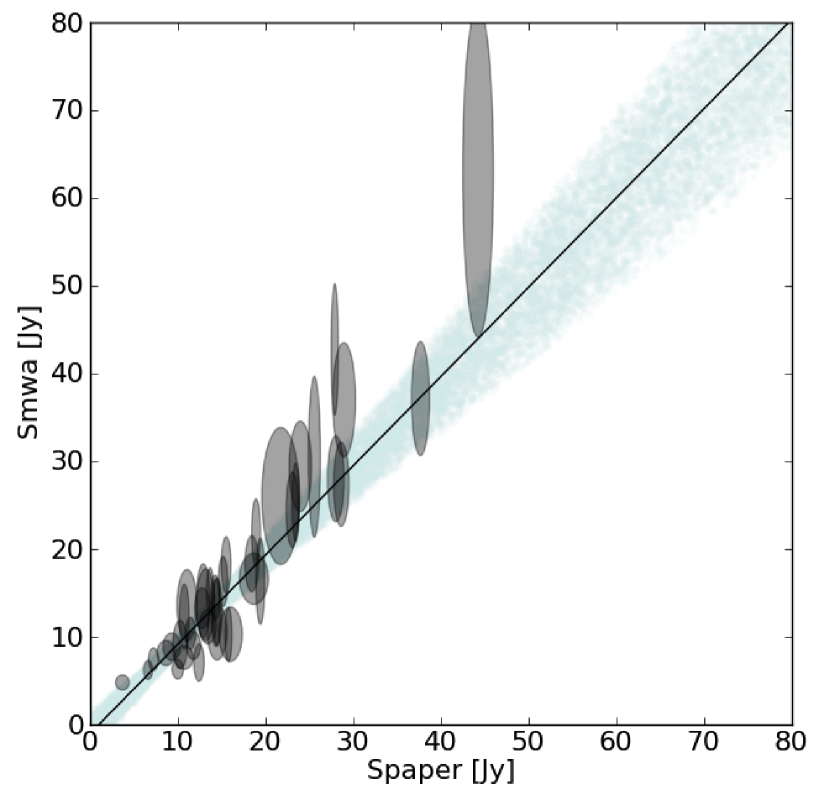
The posterior probability distribution is shown in Figure 5. The most likely flux relationship occurs at the peak of the posterior (shown in Figure 4), and the confidence interval is defined as the contours of the posterior sampling. Marginalizing over the flux offset, we find a distribution of flux scales which peaks at 1.05 and has a 73% confidence limit of 0.8 to 1.19, or 20% at . The peak position is consistent with the offset due to the small spectral index correction in the construction of the MWA32 wideband images and is consistent with MWA32 and PSA32 sharing the same flux scale. It should be emphasized that this is a more robust and correct determination of relative agreement between catalogs than either the flux-ratio histogram method implemented by Jacobs et al. (2011) or the average flux ratio of Williams et al. (2012).
4. Systematic Effects in the Catalogs
Both the PSA32 and MWA32 source catalog errors are almost certainly not dominated by thermal noise. To assess the origin of errors, it is necessary now to turn to possible sources of systematic errors, and, for this purpose, it is desirable to have a reference to compare against. Since the MWA32 catalog is derived from sources found in two facets, it is possible to use intercomparison between the two facets as a diagnostic of systematic errors. While in principle a similar approach could be used for the PAPER images, the individual PAPER snapshots were of a limited signal-to-noise, and thus intercomparison is not very meaningful. For this reason the individual facets were neither published nor included in this study. Thus for PAPER, we look for systematic errors by comparing against the CCA catalog.
To simplify the analysis we will compare the peak fluxes, rather than the Gaussian fits used in Williams et al. (2012). This also simplifies the comparison to the PSA32 catalog (Section 3), which also used peak fluxes. To test the actual amount of flux error when using the two methods we compare the MWA32 peak fluxes with the fit fluxes listed in the catalog. The amount of disagreement ranges from a median of in the Hydra A field to 8% in the EOR2 field. As we will see, this error is much smaller than other effects we will identify.
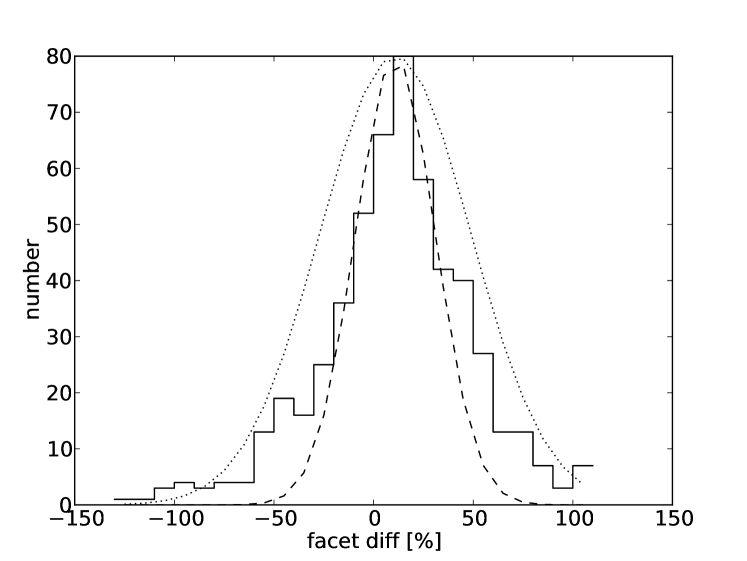
Occasionally, several MWA sources were closer together than 30′ causing the peak finder to sometimes find duplicate flux measurements. After eliminating 10 sources within 30′ of each other, we compute the median and rms facet to facet fractional difference.
In this large sample of 539 sources, the distribution of the fractional errors is peaked around 16% but extends beyond 100%, a state reflected in its RMS of 39.9% and median value of 13%. The distribution of the errors is shown in Figure 6. The best fit histogram has a width of 37% though a width of 20% seems to better reflect the center of the distribution, which, as we will see below suggests that the errors are non-gaussian and most likely systematic.
Though many sources are visible in both facets only the subset found in the primary field of view101010The actual effective beam will be complicated by the inclusion of several pointings and bands, all of which have measurably different patterns. This sample, which includes only the published maps and the known primary beam size probably best describes the uncertainty in the MWA32 catalog. (26°FWHM @ 190MHz) have comparable instrumental error. Indeed, the median uncertainty of these 63 sources very similar to the larger sample at 16%, but the RMS is much smaller at only 29%.
4.1. Errors Due to Primary Beam
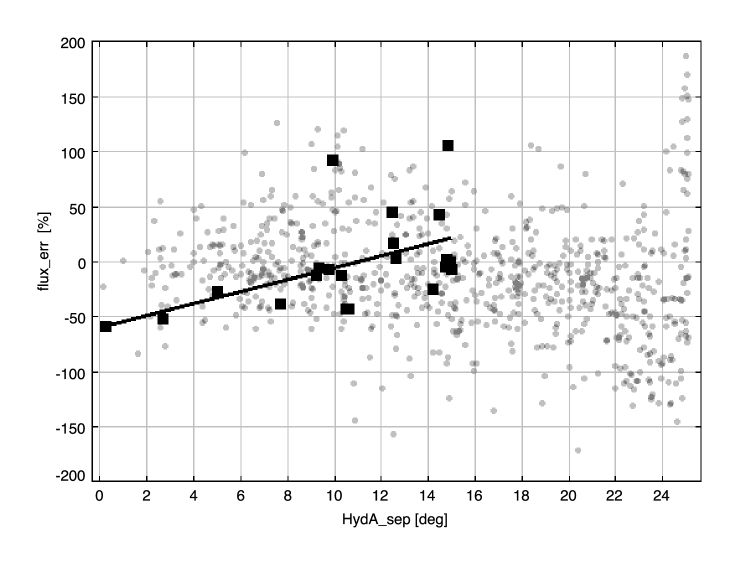
Meanwhile, the opposite is true of flux difference versus Right Ascension, as is shown in Figure 7. Sources above 1 Jy show a clear linear trend in flux difference with Right Ascension, changing by as much as 200% over 25 degrees of longitude. No trend is observed in the Declination direction.
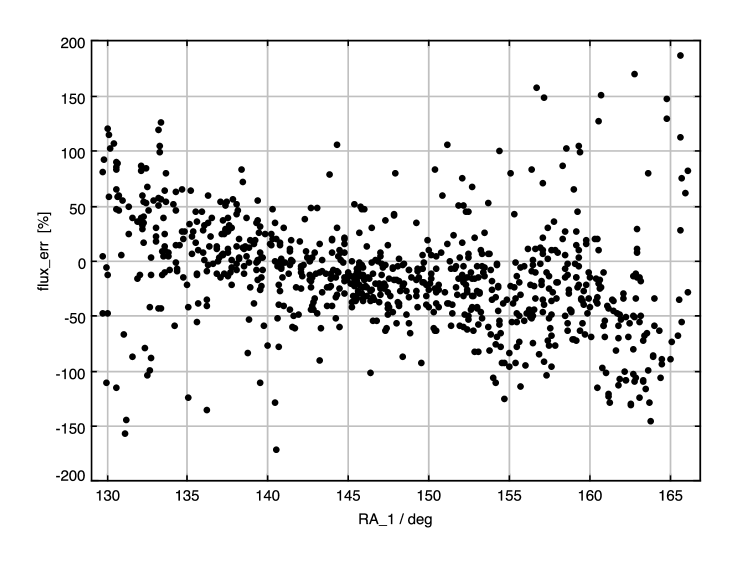

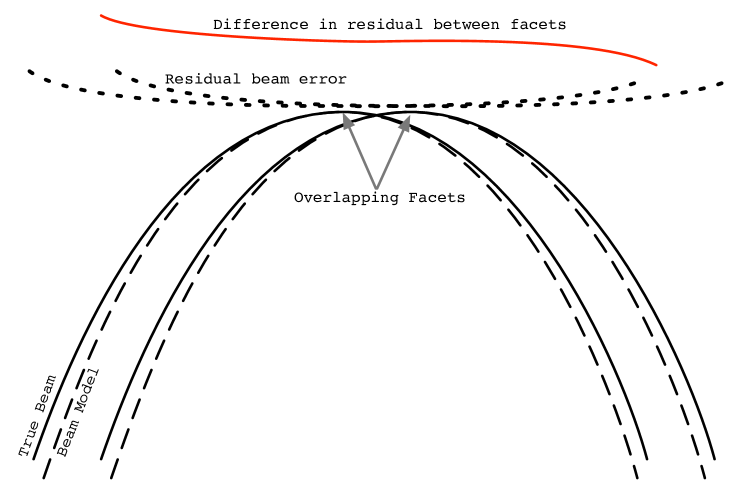
A second systematic affect was apparent in the faint, uncleaned sources Jy of the MWA32 facets: a distinct systematic, monotonic trend in facet disagreement (Figure 7). The RA dependence of the disagreement is consistent with the expected difference between two facets with similar scale beam errors as illustrated in Figure 9. The true flux of each facet image is estimated by dividing the perceived flux by a model of the primary beam. The models used for both MWA and PAPER are based on simulations. When the model does not match reality the flux scale will incorrectly be seen to increase or decrease uniformly towards the beam edges. When two pointings are differenced, the errors on the opposing edges will have opposite signs. The scale of the error, % at field of view edges, is consistent with the tests of MWA antenna tiles in an anechoic chamber at Lincoln Labs, where the MWA tile responses were found to differ from the model by 1.34 dB (36%) at 15° from zenith (Williams, 2012).
MWA primary beams will be holographically mapped and calibrated during commissioning of the final array configuration. This data was not yet available for the MWA32 catalog. Because the MWA images from this study used several tile aperture pointings and the more limited theoretical holographic model, the uncertainty in the beam model was large. Other experiments by Bernardi et al. (2012) observing in drift scan mode using only a single, well characterized, pointing, were able to find closer flux/catalog agreement. Methods that utilize the holographic beam in the deconvolution process are now being tested that will significantly reduce this systematic (Morales & Matejek, 2009; Sullivan et al., 2012; Tasse et al., 2012).
4.2. Errors Due to clean Algorithm
As we saw when comparing images in Fig 3, different levels of deconvolution affect the degree to which the PAPER and MWA images agree. This affect is also noticeable when comparing the two MWA facets which were cleaned independently.
In this limited selection, systematic differences errors are less obvious. One that is most suggestive is a possible linear increase in error with proximity to Hydra A shown in Figure 10. Hydra A is 7 times brighter than the next brightest source. During the first clean iterations the model will only contain Hydra A. When clean begins to model flux at the level corresponding to the next brightest sources it must decide how to divide up fluxes of nearby sources whose side-lobes significantly overlap. If it divides incorrectly (putting the flux of one source into another) clean enters a false minimum from which it cannot escape. The result will be that models of sources near very bright sources will be more corrupted. The images were cleaned to 1% of the peak flux, or about 4 Jy for EoR2 and 6 Jy for the Hydra A field . The fact that the error does not affect sources below 5 Jy suggests that the error is related to a clean converging on a false minimum.
Deconvolution and primary beam errors illustrated by the MWA32 data are present in varying degrees in the PSA32 data as well. The PAPER images are not cleaned as deeply as the MWA32 images. However, as we see in Figure 8 which shows the ratio of PAPER to catalog values, when compared to other catalogs, the largest errors were found to cluster near bright sources beyond the imaged region at low elevation in the primary beam (Jacobs, 2011). The errors did not increase with distance and appear to be due to side-lobes from the sources indicated in the figure. Recent analysis of measured source tracks has found the PAPER beam to be accurate to between 10% and 15%, though sources can have individual errors of 20% or occasionally more (Pober et al., 2012).
5. Conclusions and Recommendations
We summarize our conclusions as follows:
-
1.
The PSA-32 and MWA-32T catalogs are on the same flux scale, consistent with their stated errors (flux agreement of 20% at a probability of 0.76).
-
2.
Both PSA-32 and MWA-32T catalogs show evidence for systematic errors in the fluxes of sources near bright sources, the likely explanation for which is errors in cleaning the bright sources.
-
3.
The MWA-32T catalog shows evidence for a systematic flux error of sources as a function of RA likely due to an error in the primary beam model combined with the mosaicking of facets along the RA direction. Due to its construction from a number of overlapping facets along RA, the PSA-32 catalog does not show a similar artifact.
We summarize the sources of error in the three sets of flux measurements (two MWA32 facets, 1 PAPER mosaic) into several categories, outlined in Table 3. Types of errors as deduced from the MWA facet analysis are given in the upper part of the table, whereas intercomparisons between the two catalogs are given below the dividing line.
| Source of Error | Fractional Error | Refer to |
| Flux measurement (peak vs fit) | 4.5% | §3 |
| Primary beam | 25% | Figure 7 |
| Edge of beam | 100% | Figure 7 |
| clean of bright sources | 50% | Figure 10 |
| Theoretical bandwidth mismatch | 5% | §2 |
| Actual difference between telescopes | 20% | Figure 5 |
All EoR telescopes must demonstrate the ability to make reliable and repeatable measurements. Employing the lessons learned in this early stage we can summarize the implications of Table 3 for improvements necessary for EoR experiments are as follows:
-
1.
Flux scale is currently not accurate to better than 20%. This implies a uncertainty in the power spectrum. This is most likely due to to primary beam uncertainties in transferring fluxes between calibrators, and also due to clean uncertainties.
-
2.
The precision of the sky model is sufficient to accurately subtract of bright foreground sources, which is a significant distance from the 0.25% requirement to be able to subtract sources and work within the EoR “wedge”. Future work should be able to improve on this dramatically, though it is not obvious that this two order of magnitude requirement can be reached.
-
3.
The clean algorithm introduces correlated errors between sources. Catalogs should include information about the degree of correlation. This information would then inform the comparison likelihood model.
-
4.
Work towards improving primary beam accuracy is of utmost importance for both experiments and for EoR measurements generally, as for polarization (Moore et al., 2013), image reconstruction and fully holographic imaging (Sullivan et al., 2012) and is also currently the limiting factor in the accuracy of the catalogs.
To address implication 1, we recommend establishment of system of reference sources with detailed and repeated measurements by both instruments. We should note that the only reason the flux relationship fit converges on a single stationary gaussian-like probability distribution is the 30% fractional error bar listed in the MWA32. This large fractional error was designed to match the approximate scale of deviation from Culgoora values and appears consistent with the facet comparison analysis above (Figure 6). The significance of this comparison is in the successful application of a new method for comparing catalogs. The MCMC likelihood algorithm allows the addition of more detailed error models that take into position and flux dependent errors like those described above. For the reasons noted in Section 3, inter-catalog comparisons should take into account both the quoted errors, and quote the resulting range of model parameters which could relate the two. It should be noted that the probabilistic method used to relate PSA32 to MWA32 could be extended to take into account a more detailed, non-gaussian, error model, and in principle, can also be used to assess the correctness of the individual object error bars from either catalog, with the addition of a likelihood for the errors. Extra catalog meta data, such as the correlation between measurements, as suggested in number 3, could also be folded into the likelihood model. This is a subject for future work.
Regarding point 3, clean incorporates little prior knowledge into its result. This is a good choice for narrow field of view instruments observing an unknown sky. But wide field of view deconvolution always encompasses many oft-measured sources. Future deconvolution efforts should incorporate known fluxes as prior data. One example of a method which could incorporates priors in this way is the Fast Holographic Deconvolution algorithm (Sullivan et al., 2012) which provides a faster forward model suitable for building a likelihood-based approach.
Of all the observed systematics, the beam model error is the largest, making it clear that more effort must be devoted to measuring the primary beam. We note that in the case of the MWA, the beam error was discernible because two deep, independently imaged facets happened to overlap each other, allowing comparison of many dim sources. This suggests 1) that the images used to generate a catalog should be published along with the list of source fluxes (both PAPER and MWA images available only “on request”) and 2) that surveys should be arranged so that each source measurement is repeated at differing hour angles, observing it at different points in the primary antenna beam.
6. Acknowledgements
This work makes use of the Topcat catalog program111111Taylor (2005) http://www.starlink.ac.uk/topcat/ and the “MCMC Hammer” emcee python library121212Foreman-Mackey et al. (2012) http://danfm.ca/emcee/ .
References
- Baldwin et al. (1985) Baldwin, J. E., Boysen, R. C., Hales, S. E. G., Jennings, J. E., Waggett, P. C., Warner, P. J., & Wilson, D. M. A. 1985, Royal Astronomical Society, 217, 717
- Bernardi et al. (2012) Bernardi, G. et al. 2012, ApJ submitted
- Bowman et al. (2006) Bowman, J., Morales, M., & Hewitt, J. 2006, The Astrophysical Journal, 638, 20
- Bowman et al. (2009) —. 2009, The Astrophysical Journal, 695, 183
- Bowman et al. (2012) Bowman, J. D. et al. 2012, eprint arXiv, 1212, 5151
- Breuck et al. (2002) Breuck, C. D., Tang, Y., de Bruyn, A. G., Rottgering, H., & van Breugel, W. 2002, VizieR On-line Data Catalog, 8069, 0
- Chapman et al. (2012) Chapman, E. et al. 2012, eprint arXiv:1201.2190
- Cho et al. (2012) Cho, J., Lazarian, A., & Timbie, P. T. 2012, The Astrophysical Journal, 749, 164
- Condon et al. (1998) Condon, J. J., Cotton, W. D., Greisen, E. W., Yin, Q. F., Perley, R. A., Taylor, G. B., & Broderick, J. J. 1998, The Astronomical Journal, 115, 1693
- Conway et al. (1963) Conway, R. G., Kellermann, K. I., & Long, R. J. 1963, Monthly Notices of the Royal Astronomical Society, 125, 261
- Datta et al. (2010) Datta, A., Bowman, J. D., & Carilli, C. L. 2010, The Astrophysical Journal, 724, 526
- Douglas et al. (1996) Douglas, J. N., Bash, F. N., Bozyan, F. A., Torrence, G. W., & Wolfe, C. 1996, Astronomical Journal v.111, 111, 1945
- Eddington (3) Eddington, A. 3, Monthly Notices of the Royal Astronomical Society, 73, 359
- Foreman-Mackey et al. (2012) Foreman-Mackey, D., Hogg, D., Lang, D., & Goodman, J. 2012, eprint arXiv:1202.3665
- Furlanetto et al. (2006) Furlanetto, S. R., Oh, S. P., & Briggs, F. H. 2006, Physics Reports, 433, 181, elsevier B.V.
- Gleser et al. (2008) Gleser, L., Nusser, A., & Benson, A. J. 2008, Monthly Notices of the Royal Astronomical Society, 391, 383
- Górski et al. (2005) Górski, K., Hivon, E., Banday, A., Wandelt, B., Hansen, F., Reinecke, M., & Bartelmann, M. 2005, The Astrophysical Journal, 622, 759
- Gower et al. (1967) Gower, J. F. R., Scott, P. F., & Wills, D. 1967, Memoirs of the Royal Astronomical Society, 71, 49
- Griffith et al. (1994) Griffith, M., Wright, A., Burke, B., & Ekers, R. 1994, The Astrophysical Journal Supplement Series, 90, 179
- Hales et al. (1988) Hales, S. E. G., Baldwin, J. E., & Warner, P. J. 1988, Monthly Notices of the Royal Astronomical Society (ISSN 0035-8711), 234, 919
- Harker et al. (2010) Harker, G. et al. 2010, Monthly Notices of the Royal Astronomical Society, 405, 2492, (c) Journal compilation © 2010 RAS
- Högbom (1974) Högbom, J. A. 1974, Astronomy and Astrophysics Supplement, 15, 417, a&AA ID. AAA011.033.031
- Hogg et al. (2010) Hogg, D. W., Bovy, J., & Lang, D. 2010, eprint arXiv, 1008, 4686, a chapter from a non-existent book
- Jacobs (2011) Jacobs, D. 2011, University of Pennsylvania Dissertations.
- Jacobs et al. (2011) Jacobs, D. et al. 2011, The Astrophysical Journal, 734, L34
- Jelić et al. (2008) Jelić, V. et al. 2008, Monthly Notices of the Royal Astronomical Society, 389, 1319, (c) Journal compilation © 2008 RAS
- Lane et al. (2008) Lane, W. M., Cohen, A. S., Cotton, W. D., Perley, R. A., Condon, J. J., Lazio, T. J. W., Kassim, N. E., & Erickson, W. C. 2008, Frontiers of Astrophysics: A Celebration of NRAO’s 50th Anniversary ASP Conference Series, 395, 370
- Large et al. (1991) Large, M., Cram, L., & Burgess, A. 1991, The Observatory, 111, 72
- Large et al. (1981) Large, M. I., Mills, B. Y., Little, A. G., Crawford, D. F., & Sutton, J. M. 1981, ROYAL ASTRON. SOC. MONTHLY NOTICES V.194, 194, 693, a&AA ID. AAA029.002.002
- Liu & Tegmark (2011) Liu, A. & Tegmark, M. 2011, Physical Review D, 83, 103006
- Liu et al. (2009) Liu, A., Tegmark, M., & Zaldarriaga, M. 2009, Monthly Notices of the Royal Astronomical Society, 394, 1575, (c) Journal compilation © 2009 RAS
- Matteo et al. (2004) Matteo, T. D., Ciardi, B., & Miniati, F. 2004, Monthly Notices of the Royal Astronomical Society, 355, 1053, (c) 2004 RAS
- Matteo et al. (2002) Matteo, T. D., Perna, R., Abel, T., & Rees, M. J. 2002, The Astrophysical Journal, 564, 576, (c) 2002: The American Astronomical Society
- Mauch et al. (2003) Mauch, T., Murphy, T., Buttery, H. J., Curran, J., Hunstead, R. W., Piestrzynski, B., Robertson, J. G., & Sadler, E. M. 2003, Monthly Notice of the Royal Astronomical Society, 342, 1117
- McGilchrist et al. (1990) McGilchrist, M. M., Baldwin, J. E., Riley, J. M., Titterington, D. J., Waldram, E. M., & Warner, P. J. 1990, Monthly Notices of the Royal Astronomical Society, 246, 110
- McQuinn et al. (2006) McQuinn, M., Zahn, O., Zaldarriaga, M., Hernquist, L., & Furlanetto, S. R. 2006, The Astrophysical Journal, 653, 815, (c) 2006: The American Astronomical Society
- Moore et al. (2013) Moore, D. F., Aguirre, J. E., Parsons, A. R., Jacobs, D. C., & Pober, J. C. 2013, eprint arXiv, 1302, 876, 29 pages, 12 figures
- Morales et al. (2006) Morales, M., Bowman, J., & Hewitt, J. 2006, The Astrophysical Journal
- Morales & Hewitt (2004) Morales, M. F. & Hewitt, J. 2004, The Astrophysical Journal, 615, 7, (c) 2004: The American Astronomical Society
- Morales & Matejek (2009) Morales, M. F. & Matejek, M. 2009, Monthly Notices of the Royal Astronomical Society, 400, 1814
- Morales & Wyithe (2010) Morales, M. F. & Wyithe, J. S. B. 2010, Annual review of astronomy and astrophysics, 48, 127
- Oh & Mack (2003) Oh, S. P. & Mack, K. J. 2003, Monthly Notices of the Royal Astronomical Society, 346, 871
- Otrupcek & Wright (1991) Otrupcek, R. & Wright, A. 1991, Proceedings of the Astronomical Society of Australia, 9, 170
- Paciga et al. (2013) Paciga, G. et al. 2013, eprint arXiv:1301.5906
- Paciga et al. (2011) —. 2011, Monthly Notices of the Royal Astronomical Society, 413, 1174
- Parsons et al. (2010) Parsons, A. et al. 2010, The Astronomical Journal, 139, 1468
- Parsons & Backer (2009) Parsons, A. R. & Backer, D. C. 2009, The Astronomical Journal, 138, 219
- Parsons et al. (2012) Parsons, A. R., Pober, J. C., Aguirre, J. E., Carilli, C. L., Jacobs, D. C., & Moore, D. F. 2012, The Astrophysical Journal, 756, 165
- Petrovic & Oh (2011) Petrovic, N. & Oh, S. P. 2011, Monthly Notices of the Royal Astronomical Society, 413, 2103
- Pilkington & Scott (1965) Pilkington, J. D. H. & Scott, P. F. 1965, Memoirs of the Royal Astronomical Society, 69, 183
- Pober et al. (2012) Pober, J. C. et al. 2012, The Astronomical Journal, 143, 53
- Rengelink et al. (1997) Rengelink, R. B., Tang, Y., de Bruyn, A. G., Miley, G. K., Bremer, M. N., Roettgering, H. J. A., & Bremer, M. A. R. 1997, A & A Supplement series, 124, 259
- Rottgering et al. (2006) Rottgering, H. J. A. et al. 2006, eprint arXiv, 10596
- Sheridan et al. (1973) Sheridan, K., Labrum, N., & Payten, W. 1973, Proceedings of the IEEE, 61, 1312
- Slee (1995) Slee, O. 1995, Australian Journal of Physics, 48, 143, d
- Slee & Higgins (1975) Slee, O. B. & Higgins, C. S. 1975, [Melbourne : Commonwealth Scientific and Industrial Research Organization], 9n
- Sullivan et al. (2012) Sullivan, I. S. et al. 2012, The Astrophysical Journal, 759, 17
- Swarup (1991) Swarup, G. 1991, IAU Colloq. 131: Radio Interferometry. Theory, Techniques, and Applications, 19, 376
- Tasse et al. (2012) Tasse, C., van der Tol, B., van Zwieten, J., van Diepen, G., & Bhatnagar, S. 2012, eprint arXiv, 1212, 6178
- Taylor (2005) Taylor, M. 2005, Astronomical Data Analysis Software and Systems XIV, 347, 29
- Tingay et al. (2012) Tingay, S. et al. 2012, eprint arXiv:1206.6945
- Vollmer et al. (2005) Vollmer, B., Davoust, E., Dubois, P., Genova, F., Ochsenbein, F., & van Driel, W. 2005, Astronomy and Astrophysics, 436, 757
- Wang et al. (2006) Wang, X., Tegmark, M., Santos, M. G., & Knox, L. 2006, The Astrophysical Journal, 650, 529, (c) 2006: The American Astronomical Society
- White et al. (1997) White, R., Becker, R., Helfand, D., & Gregg, M. 1997, The Astrophysical Journal, 475, 479
- Williams (2012) Williams, C. 2012, MIT Thesis
- Williams et al. (2012) Williams, C. L. et al. 2012, The Astrophysical Journal, 755, 47
- Wright & Otrupcek (1990) Wright & Otrupcek. 1990, Australia Telescope National Facility
- Zaldarriaga et al. (2004) Zaldarriaga, M., Furlanetto, S. R., & Hernquist, L. 2004, The Astrophysical Journal, 608, 622, (c) 2004: The American Astronomical Society
- Zhang et al. (1997) Zhang, X., Zheng, Y., Chen, H., Wang, S., Cao, A., Peng, B., & Nan, R. 1997, A & A Supplement series, 121, 59