2 Centre de Physique Théorique, École Polytechnique, CNRS, 91 128 Palaiseau, France
3 Institut für Theoretische Physik und Astrophysik, Universität W ürzburg, Am Hubland, D-97074 Würzburg, Germany
4 S.N. Bose National Centre for Basic Sciences, Kolkata 700098, India
5 CNR-IOM and Dipartimento di Fisica, Università di Roma ”La Sapienza”, Piazzale A. Moro 2, I-00185 Roma, Italy
6 Laboratoire de Physique des Solides, CNRS-UMR 8502, Université Paris-Sud, F-91405 Orsay, France
by the publisher \publishedXXXX
Mott-Hubbard transition in V2O3 revisited
Abstract
The isostructural metal-insulator transition in Cr-doped V2O3 is the textbook example of a Mott-Hubbard transition between a paramagnetic metal and a paramagnetic insulator. We review recent theoretical calculations as well as experimental findings which shed new light on this famous transition. In particular, the old paradigm of a doping-pressure equivalence does not hold, and there is a microscale phase separation for Cr-doped V2O3.
keywords:
Strongly correlated electron systems, Mott-Hubbard transition, vanadium sesquioxide, dynamical mean field theory.1 The story so far
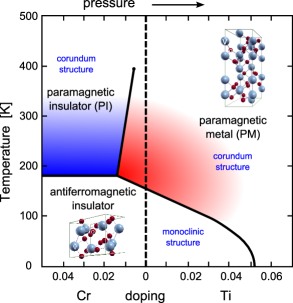
At first, let us summarize the basic facts and review some of the former theoretical work that has been put forward, thereby also defining the necessary terms. In Fig. 1 we show the phase diagram of V2O3 [2] spanned in the temperature–doping space displaying three phases: At ambient conditions V2O3 is a paramagnetic metal (PM) and crystallizes in the corundum structure with four vanadium atoms in the primitive unit cell, see inset of Fig. 1. It can be seen that respectively two vanadium atoms form “pairs” which are oriented along the crystallographic c–axis. Upon cooling below 150K, a peculiar antiferromagnetic order (AF) sets in and the system becomes insulating, accompanied by a monoclinic structural distortion. On the other hand, the system can be tuned by doping with chromium or titanium or the application of external pressure. In this respect, the “common wisdom” has been established [2] that doping and pressure can be seen as equivalent routes through the phase diagram. As we will see later, however, the pressure/doping equivalence scheme is inconsistent with recent experimental measurements of the optical conductivity and x–ray absorption. Above the Néel, temperature, the corundum crystal structure remains unchanged as a function of pressure or doping. Nontheless, upon Cr doping a first order isostructural metal–to–insulator (MIT) transition takes place (see Fig. 1) which evoked several theoretical attempts to describe this MIT as a genuine Mott–Hubbard transition. While the MIT is associated to changes in the lattice structure and the atomic positions [3, 4], it is important to notice that x–ray diffraction showed that for a given temperature the structure within one phase does not change upon doping [4]. It was later also observed by Park et al. [5] with vanadium –edge x–ray absorption spectroscopy that this holds also the electronic configuration of the system in terms of the orbital occupation (see Table 1 of [5]). Therefore we shall adopt the nomenclature of Robinson [4] and refer to the lattice structure of the paramagnetic metallic (PM) and insulating (PI) phase at ambient pressure as – and –phase respectively.
The electronic configuration of atomic vanadium is [Ar]3d34s2,
which means, that in the three–valent oxidation state we find a
3d2 configuration realized. In the corundum type structure the
vanadium atoms are coordinated by oxygen ligands in a trigonally
distorted octahedral fashion (inset of Fig. 1). Hence,
the cubic part of the crystal field splits the d–states into the
lower lying and the higher lying states. The trigonal
distortion111Let us, already in this introduction, remark that
the actual crystal field breaks one significant point symmetry on the
vanadium sites, namely inversion in the c–direction. This is
related to the different distances of the neighboring vanadium atoms
along the c–axis, see Fig. 1. While this effect is
negligible for most of the discussion, it will be
of great importance for the selection rules of the polarization
dependent XAS results later on. acts like a compression along one
of the three–fold axes of the octahedron (i.e. squeezing two opposite
sides together). As a result the degeneracy of the lower lying
states is lifted and they are split into a single
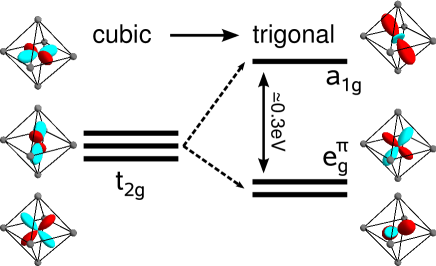
and the twofold degenerate states. This level splitting,
together with a plot of the respective angular part of the (atomic) wave
function, is sketched in Fig. 2. To indicate the difference to the
states, the higher lying cubic states (which are not split by
the trigonal distortion) get an additional index in order
to distinguish them from the . The
accounts for their orientation towards the ligands, with which
they form bonds.
Since the are pushed up in energy by the crystal field, the two
vanadium d–electrons populate the three levels. One of the crucial aspects concerning the
understanding of the MIT is the specific occupation of these
states. In an early work, Castellani et al. [8, 9, 10] assumed a
strong hybridization of the V–V pairs oriented parallel to the
rombohedral c–axis, resulting in a strong bonding and antibonding
splitting of the states. In this case, with the bonding
states filled there would be one electron remaining in the twofold
degenerate states and the compound could be described by a
quarter filled Hubbard model. However, later experimental
evidence demonstrated [11, 12, 13, 5] that
the ground state of the system is more complicated and should rather be
described as a state consisting of a mixture of and
electrons.
Moreover, it is precisely the coefficients in the linear
combination of and for the ground state which
allow for a quantitative distinction of the PM, PI, and AF
phases. The XAS vanadium –edge study of Park et al.
explored the phase diagram by means of temperature and doping and
summarized the respective ratio of to
occupations as [5]:
1:1 (PM), 3:2 (PI), and 2:1 (AF).
As we mentioned earlier, their results turned out to
be consistent with the x–ray diffraction data for the lattice of Robinson
[4], and showed that, within the PM – and the
PI – phase, there is essentially no change in the ground state composition
for different doping levels. One main new result, which will be discussed
later, is, that this is not true for the
pressurized metallic phase.
LDA calculations
First ab initio band structure calculations in the local density approximation (LDA) for V2O3 were
performed by Mattheiss [14]. Not surprisingly the results
neither captured the insulating character of the Cr doped PI phase nor
the signatures of the strongly correlated character of the undoped PM
phase (for example the photoemission spectral weight identified with
the lower Hubbard band). Yet, even at the LDA level, some
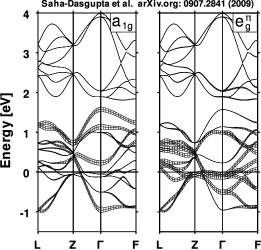
valuable information can be obtained. In Fig. 3,
a plot of the LDA band structure is shown in the rombohedral
representation taken from Saha–Dasgupta et al.[6] with Fermi level
. In the two panels the respective and
character is indicated by the width of the lines by means of
the so called “fat band” representation.
First of all it can be seen in Fig. 3 that the part is
nicely separated from the rest of the bands: Genuine oxygen –bands are
lower lying than the displayed energy range and the can
be identified as the bands at eV to eV.
Let us now turn to the
bands (left panel Fig. 3). The previously
mentioned bonding–antibonding splitting due to the V–V pairs can be
seen at the –point to be eV, where the –character is
pure. The strongest dispersion is observed along the – direction where
the main contribution stems from –
hopping. However, the dispersion of the –bands along the
other directions is also not small which is a consequence of
– hybridization. While the and states are
orthogonal eigenstates locally in a trigonal crystal field they
still hybridize in a non–local way, i.e., there is intersite
– hopping also in the ab–plane. As it was
remarked by Elfimof et al. [15] these kinds of hopping are
important for the shape of the states. With the help of the
fat bands in Fig. 3, we compare the
and –character: We clearly see that only at the
high symmetry points in the Brillouin zone the non–local
– hybridization is zero.
In fact, this LDA result contradicts also theoretically the validity of
quarter filled states and the scenario.
Previous LDA+DMFT studies By means of dynamical mean field theory (DMFT) [16] it is possible to include local electronic correlations, which trigger a Mott-Hubbard transition. Starting from the LDA results, first LDA+DMFT calculations were performed and compared to photoemission and XAS experiments by Held et al. [17] and Keller et al. [18]. Later Poteryaev et al. [19] performed new LDA+DMFT calculations employing a downfolded NMTO Wannier functions Hamiltonian provided by Saha–Dasgupta et al. [6] instead of the density of states [17, 18]. Both kind of LDA+DMFT calculations capture the Mott-Hubbard transition, and well agree with (even predicted) the photoemission spectroscopy (PES) measurements. Actually, the PES spectra at the time of the first calculations [17] still did not show a pronounced quasiparticle peak [20]. Only after improving the bulk sensitivity by using high-energy photons from a synchrotron source [21, 22], experiments agreed also in this respect with LDA+DMFT.
Extending the work of Poteryaev et al. [19], Tomczak [23] and Tomczak and Biermann [24] discussed the optical conductivity of the compound introducing corrections for the calculation of the Fermi–velocities associated with the non–monoatomic basis of V2O3 – an important issue also for this work which will be discussed in the next section. The last work that should be mentioned is the joint experimental/theory paper by Baldassare et al. [25] in which the authors show that the slight change of the lattice parameters due to temperature, drive the system into the crossover regime between metal and insulator. Their results underline how sensitive strongly correlated systems are with respect to the change of external parameter – even more so in the vicinity of a correlation driven Mott transition. For a comparison to other vanadium oxides, see [26].
The key interest of the more recent LDA+DMFT calculations, which will be discussed in the following, is to shed new light on the actual ground state of V2O3 at different points in the phase diagram Fig. 1. Special attention is paid to the insulating and metallic phase of the 1.1% Cr–doped sample in the vicinity of the MIT as well as to the comparison between the metallic phase of the undoped sample at ambient conditions and the Cr–doped sample under external pressure.
In the following, we discuss some aspects and details of the LDA+DMFT calculation in Section 2. Theoretical and experimental results for the optical conductivity are presented in Section 3, those for the photoemssion microscopy in Section 4, and those for the X-ray absorption spectroscopy in Section 5. Finally, Section 6 provides a summary and conclusion.
2 LDA+DMFT implementation
2.1 Low energy NMTO Hamiltonian
The first step of the LDA+DMFT calculations is the derivation of the
Hamiltonian for the low-energy orbitals from the bandstructure calculation via
NMTO downfolding or Wannier projections. The Hamiltonian is
constructed to capture the relevant degrees of freedom of the system for low
energy scales on a reduced basis set. In the case of V2O3 we
used a model obtained by the NMTO method, with which the full LDA Hamiltonian
was downfolded on the sub–space around the Fermi energy. As
described above (see Fig. 2), the states
are decomposed into a single and two degenerate
states. However, if we look closely at the bandstructure in
Fig. 3 we find twelve bands instead of
three. The reason for this is simply that there are four vanadium
atoms in the primitive unit cell which means, that we obtain a 12 by 12
Hamiltonian as a function of for V2O3 from the
downfolding. (For a detailed discussion of the
downfolding procedure of the V2O3 model see Saha–Dasgupta
et al. [6]). Yet, although the LDA Hamiltonian is
a twelve–band
dispersion matrix, the actual DMFT calculation can be performed with
no more effort than a three band calculation. The reason for this is
simply that all four vanadium atoms in the unit cell are located on
equivalent sites which means that they are related to one another by
symmetry transformations. In other words, each of the four vanadium
atoms experiences the same
environment and, hence, has the same local eigenstates. As a
consequence, the –integrated local Green function can be written in a basis in which we
obtain four equal diagonal blocks with respect to the site index. The orbital labels and are good quantum numbers
locally. Such a local basis set is a necessary condition for
the formulation of the local interaction parameter U and a correct definition of the
local DMFT self energy.
2.2 DMFT Green function and self energy
We explicitly write the local Green function as:
| (1) |
where the roman numerals serve as a site index, and, as mentioned
| (2) |
the diagonal blocks are equal for each site i. Hence, in order to
calculate the local DMFT self energy, which clearly has to be
the same for all four (locally equivalent) sites, we have to project out only the first
diagonal block after the –integration, and proceed with the
calculation of the DMFT self energy in the usual way.
The resulting self energy is a diagonal 3 by 3 matrix
and is used in the
next iteration to construct the full 12 by 12 diagonal matrix
taking the equality of the four vanadium sites
into account
| (3) |
This full self energy then enters equation (1) for the calculation of the next local Green function. Furthermore, it is important to strongly stress at this point that we do not make additional approximations with the procedure described above. From the DMFT point of view, i.e., the local perspective, the V2O3 calculation is de facto just a three orbital problem.
3 Optical conductivity: Phase separation around the MIT
The first work we will discuss, are measurements of
infrared optical conductivity [30]. This experiment has a twofold goal: on the one hand, to clarify
the behavior of the 1.1% Cr–doped compound around the metal to
insulator transition, and on the other hand, to perform an
experimental check of the pressure-doping equivalence. The motivation
of the former analysis is the following: In the past much
effort has been put into the understanding of the transition between
the PM and the PI phase Fig. 1. However, somehow less, or at
least less concrete, attention was paid to the local strain that
occurs in the lattice in the Cr–doped compounds
[3, 31], even though, for
(V0.989Cr0.011)2O3, the presence of a structural phase
separation, between the PM – and PI –phase, by the
Cr–doping has been stated before [3, 31, 4]. Other experimental studies also support the idea that
the Cr– atoms in (V0.989Cr0.011)2O3 could play the
role of –phase “condensation nuclei”:
Resistivity measurements, for example, show that the conducting phase of weakly
Cr–doped samples shows a bad metallic behavior, different from the
undoped compound [32].
Moreover, so called extended x–ray absorption fine–structure spectroscopy
(EXAFS) measurements showed that the presence of Cr contracts the Cr–V
bonds, inducing a concomitant elongation of V–V pair bonds
[31]. Such “long” V–V pair bond is associated to the
PI phase [2], as shown also by theoretical calculation using LDA+DMFT
[17]. Therefore it may be hypothesized that, within an
metallic matrix host, insulating–like “islands” are formed around
the Cr impurities [33, 34]. On this basis, the PM–PI MIT has been suggested
to have also a percolative nature [31].
Pressure–dependent transport studies by
Limelette et al. [35] were also used to show that across the PI–PM
first order transition a large hysteresis occurs. This points to a
non–trivial role of the lattice and its distortions due to the Cr
doping, which has however been almost disregarded, or drastically
simplified when defining the phase diagram. The latter has been established
by means of resistivity data only and suggests the equivalence of doping and pressure.
The relation between such hysteresis and the above mentioned coexistence of and –phases has not been clarified hitherto. It is these unknowns at which the more recent investigation [30] aimed.
Experimental results
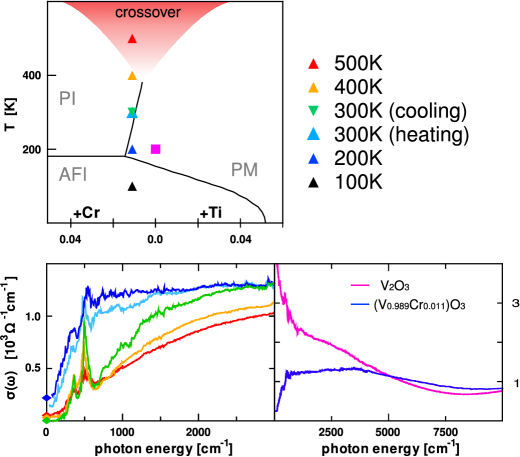
The experimental results [30] are presented in Fig. 4: In the
upper panel the positions in the phase diagram where the
spectra were taken are marked. The spectra are plotted in the lower panel in the
corresponding color: on the left hand side several spectra for
different temperatures are shown together with their values for the DC
conductivity at , whereas on the right hand side the T=200K
spectra for the undoped and the 1.1% Cr–doped samples are compared.
Let us start with the discussion of the temperature dependent
data. Shown in Fig. 4 (lower panel left hand side) are
(V0.989Cr0.011)2O3–spectra in the temperature range
between 500K and 200K (the sharp peaks around 500cm-1 correspond to
phonon resonances and are of no further interest for the present
discussion). Our starting point is in the cross–over region of the transition at
500K (red). Cooling down we obtain the spectrum at 400K (yellow) and
at 300K (green). At 300K, however, we are in the direct vicinity of
the transition line. Hence, we can, in fact, find a qualitatively
different (PM–phase) spectrum at 300K (light blue) if we approach the same point by heating up
from lower temperatures. That is, we observe hysteresis. The last spectrum we show in the plot was taken in the PM
phase at 200K (blue). The first three spectra, from 500K down to
300K (upon cooling) display the gapped shape which we expected as the
hallmark of the insulating nature of the PI –phase. The spectra
show no Drude peak and, only at elevated temperatures, gain
minimal spectral wait at . The remarkable, and
far from trivial, spectra are the ones in the PM phase at 300K (upon
heating, light blue) and at 200K (blue). We recall that already
resistivity measurements have shown a bad metallic behavior for the
Cr–doped sample as opposed to the undoped compound. Yet, how dramatic the difference to
the undoped sample really is, can be seen clearly in Fig. 4
(lower panel right hand side) where we show a direct comparison of the
(V0.989Cr0.011)2O3–spectrum at 200K (blue) and the
spectrum of the undoped sample at the same temperature (pink): The spectrum of the undoped sample shows the behavior
that is expected from a metallic phase, including a well pronounced Drude peak.
In contrast,
the shape of the spectrum of the Cr–doped compound is
rather unexpected: It does not show a Drude
peak, but neither has it a gap like in the insulating regime as
the spectral weight around is non–negligible. This
fact is a clear support for a scenario of an inhomogeneous
(i.e. – mixed) metallic phase.
On the contrary, when comparing the behavior of
(V0.989Cr0.011)2O3 and (V0.972Cr0.028)2O3 within the PI
phase, only small differences appear (not shown here).
These new interesting experimental facts were motivation enough to revisit the compound again with the help of LDA+DMFT in order to understand the features that are displayed more fundamentally. Performing this analysis allows us to test the hypothesis of the mixed – phase scenario [30].
LDA+DMFT analysis The starting point for the theoretical LDA+DMFT analysis is the downfolded NMTO Hamiltonian described in the previous section for the – and the –phase respectively. In the DMFT code, the Hirsch Fye quantum Monte Carlo method was employed. The calculations were carried out at an inverse temperature of eVK and with interaction parameters eV and eV. After convergence of the DMFT self consistent loop the single particle Green function on the imaginary time axis was analytically continued by means of the Maximum Entropy Method [36]. Next, the local self energy was extracted on the real axis in order to calculate the optical conductivity measured in the experiment. In the following we first discuss the direct DMFT results, i.e., spectral functions and local self energy thereby also comparing them to the previous data from Poteryaev et al. [19]. Afterwards we present the calculation of the optical conductivity.
Interaction parameters for V2O3
From the technical perspective, we need to elaborate in more detail on the important issue of choosing the appropriate values
for interaction parameters of a specific compound and the
theoretical method that is employed.
V2O3 presents a good example in that respect, since in the literature
several different values for and can be found. The confusion
about these parameters partly stems from the improvement in the
estimates of their values over the time and partly from the
differences in the numerical techniques. A constrained LDA
calculation (for the monoclinic antiferromagnetic phase) by
I. Solovyev et al. [37] yields the values of
eV and eV – parameters that later on were employed
in some works [38, 39, 17]. Yet, constrained LDA gives
unfortunately only very rough estimates of the values for U, which
not only crucially depend on the electronic structures, but also on the basis set of the
model at hand because it is highly sensitive to screening. For example, U has to be chosen much lower in the
case of a LDA+U calculation (for V2O3 eV) in
comparison to DMFT values ( eV) in order to overcome the
deficiency of the static mean field nature of LDA+U which
overestimates ordering and gaps (see e.g.
[40]). This leads to the parameter eV [41] following
the philosophy of Held et al. [39] and Poteryaev
et al.[19] that the
value of should be consistent with the correct physics of
V2O3, i.e., the MIT is reproduced within LDA+DMFT. Therefore,
it is not surprising that this choice of agrees well with the previous
LDA+DMFT studies. The
result of our analysis clearly demonstrates that the appropriate
for the LDA+DMFT calculation should be chosen in the range eV
eV[41], as we did in the present calculations. Considerably
smaller and larger values of U would either lead to the disappearance or a
huge overestimation of the spectral, and as to be seen also optical,
gap in the PI phase.
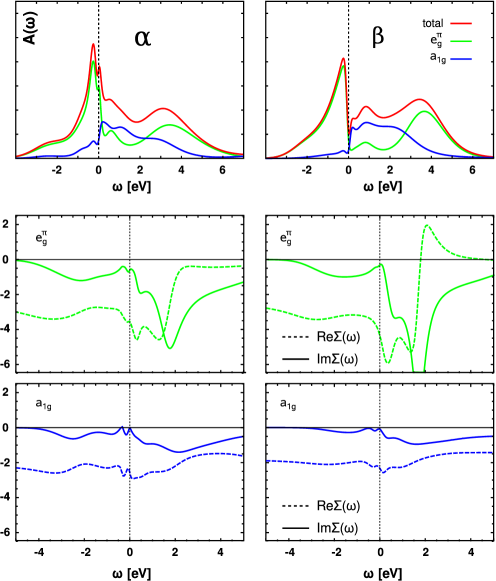
LDA+DMFT results for (V0.989Cr0.011)2O3
In Fig. 5, we report orbital–resolved spectral
function (upper panel) as well as the corresponding self energies (lower
panels). In the plots we set the Fermi energy to
and plot the sum of the two degenerate
spectra in green, the spectrum in blue, and the
total spectrum, i.e., the sum over all, in red color. We
summarize the quantities for the – and the –phase on
the left hand and right hand side of the panels respectively.
Overall our results agree with the results of the previous LDA+DMFT
analysis by Poteryaev et al. [19], although we
performed the calculations at slightly lower eV values (in
[19] eV)222The reason for our choice is
the sensitive dependence of the optical gap on this parameter.. The
self energies, both real and imaginary parts, display a strongly
orbital dependent character. The real part acts like an orbital
dependent renormalization of the chemical potential or, in other
words, as it is called in Refs. [18, 19] as an “effective crystal
field”
whereas the imaginary part is a
measure of lifetime/coherency of the excitations in the associated
band. However, the self energy depends also on the filling of the
respective orbitals and in a hybridized system like the
states of V2O3 it is a very involved quantity: Although the
self energy is diagonal we see from equation (1) that its
connection to the Green function, and hence the spectrum, involves an
inversion so that the orbitally resolved information is, in a way,
convoluted.
The spectral functions for the and –phase
are quite similar, except for the strongly renormalized coherent
quasiparticle excitations of the correlated metallic –phase
around the Fermi energy. Of course, the differences are expected to be
sharpened up at lower temperatures. From the orbital–resolved
spectra we can obtain valuable insight.
Let us have a closer look at the incoherent part of the spectrum,
i.e., the Hubbard bands. The basic features can be understood as
follows: As it was discussed in previous works (e.g. [39]) and also will be
confirmed later by the XAS study [42] the predominant local configuration
on the V atoms has two spin–aligned electrons in the
orbitals, i.e., a spin–1 configuration, with
some admixture of spin–1
configurations. For a simple picture let us first
consider the lower Hubbard band (LHB), that is, the electron removal part
of the spectrum. We recall the relevant onsite interaction parameters
to be the
intra–orbital interaction , the inter–orbital interaction ,
and the spin–coupling constant . Furthermore, in cubic (or close to cubic)
symmetry the relation holds.
Starting either from the or the
configuration, the removal of an electron will
result in an energy gain of ( eV in our case) which is in
agreement with the position of the LHB. The only structure,
i.e. splitting, which occurs is the crystal field potential
differences of the and states. This energy scale,
however, is below the resolution of our spectra at high . For the upper Hubbard
band, i.e., the electron addition part, the situation turns out to be a
little bit different. The additional electron can either populate an
or an state. Then the
process or will cost an energy of . The additional electron
interacts via with one of the other two electrons, and via
with the other one. Transitions
or only cost or depending on the respective
spin alignment. Consequently, the UHB is split into two main
features which we can find around eV and eV. We conclude that i) the
split of the UHB depends apparently strongly on the choice of and
ii) this splitting is responsible for the small width of the gap
compared to the interaction parameters333This observation explains also why the attempt to handle the gap (actually the optical
gap) with a one band Hubbard model [43] led to
unphysically small values for the interaction parameter..
Let us, finally, turn to the optical conductivity. The LDA+DMFT calculation of
the optical conductivity has been performed within the Peierls approximation
and neglecting vertex corrections
along the line of
[23].444It should be remarked, that the non–monoatomic
basis of the crystal leads to corrections in the calculation of the
Fermi velocities even at the level of the Peierls approximation as it is discussed
by Tomczak [23] and Tomczak and Biermann [24]. For V2O3, however, such corrections only concern the optical conductivity along the axis not in the xy-plane.
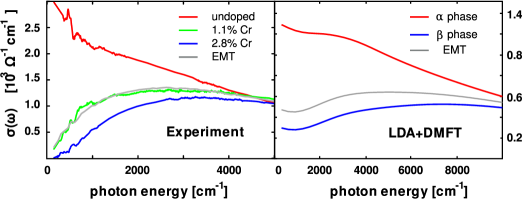
In Fig. 6 we show a comparison of experimental data
(left hand side) and LDA+DMFT data (right hand side).
We calculated the optical conductivity also for both and –phase. The LDA+DMFT
optical conductivity of the –phase (right hand side: blue)
shows a gapped behavior, as it is expected for the PI phase. The
fact that it does not extrapolate to zero at energies lower than
cm-1 is due to the temperature of K assumed for the DMFT(QMC) calculations. Further, when we
compare it to the experimental data of the 2.8% Cr–doped sample,
deep in the PI phase, we see that the calculated gap of [30]
is a little bit too large. The reason for this overestimation is an
extreme sensitivity of the calculation on the choice of and as
it was already mentioned before555A slightly larger , like it
was used, e.g., in [19] would result in an even larger
gap.. The calculated –phase optical conductivity (right hand
side: red) shows an overall good agreement with the experimental data
taken for the undoped compound (left hand side: red). At
we can distinguish the typical Drude peak contribution of
the PM phase.
The most interesting spectrum, however, corresponds to the experimental data taken
for the 1.1%Cr–doped sample at 200K (left hand side: green): As
mentioned above this spectrum is strange in its shape (with neither
Drude peak nor gap) and belongs to a state that is, according to the
resistivity measurements, a bad metal. The discrepancy between the idea
that the PM phase can be seen as a uniform metallic phase and the
experimental evidence is further enhanced by our LDA+DMFT
calculations. Specifically, as the lattice parameters practically do not
change within the –phase, the LDA+DMFT spectrum of the
1.1%Cr–doped sample at 200K and of the undoped compound are
basically indistinguishable. Hence, our calculations support the
hypothesis of an – phase mixture in the bad metal
region. To test this hypothesis further we resort to a
semi–empirical formula of the effective medium theory
(EMT) [33, 44] which provides a simple way of
approximating the dielectric constants
for mixtures of insulating
and metallic phases. Within the EMT the effective constant
satisfies the condition
| (4) |
Where and are free fitting parameters which are
phenomenologically related to the size and relative densities of the
“islands” of the two constituent phases. For further information
about this approach we refer the reader to [45]. Now we take the
optical conductivity spectra measured in the undoped sample and the 2.8%
Cr–doped sample as the – and –phase spectra
respectively and use Eq. (4) to fit the experimental spectra of the 1.1%
Cr–doped sample. For the values and an
excellent agreement can be found which is plotted in Fig. 6
(left hand side: compare green and gray).
From a theoretical point of view, it is even possible to directly use
the LDA+DMFT spectra for the – and –phase of
(V0.989Cr0.011)2O3 as an input for the EMT. Also in
this case, with the same values of and we obtain a satisfying
agreement with the experimental data.
To sum up, the experimental measurements of the
optical conductivity together with the theoretical interpretation by
means of LDA+DMFT strongly support the scenario of a mixed phase state
for the 1.1% Cr–doped compound at 200K. It will be seen in
Section 5 that the complementary x–ray absorption spectroscopy also speaks for this
scenario.
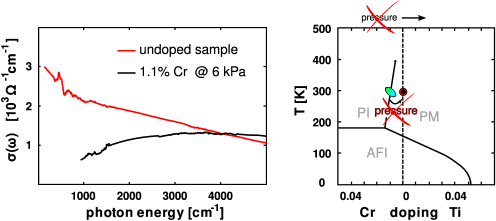
The last part of our discussion about the optical conductivity is
devoted to the data of the 1.1% Cr doped sample under pressure far in
the metallic region at 6kbar. As it was stated in the
beginning, and motivated by the results we already discussed, the
second question we want to address is whether the doping with Cr can
really be “reversed” by applying an external pressure. In short: Can
pressure really be drawn on the same axis in the phase diagram as the
doping? Experimental results from optical spectroscopy give a clear negative answer to that
question. In Fig. 7 we report on the left hand
side the comparison of the experimentally measured spectra for the
undoped and the 1.1% Cr–doped sample [30]. The spectra are,
evidently, not even qualitatively similar. This indicates the existence of
different PM states obtained by either tuning temperature/doping or applying
pressure.
It remains, however, to formulate and quantify this difference in a
rigorous manner. This will be the subject of the section 5, in which we
discuss the hard x–ray absorption spectra on the vanadium K–edge.
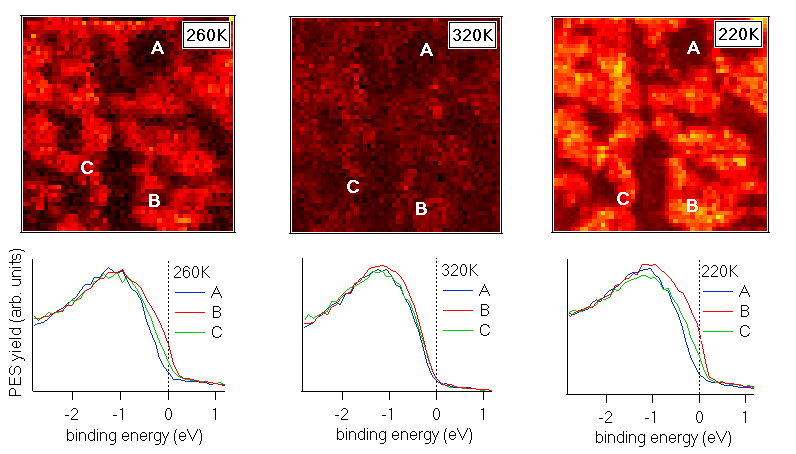
4 Photoemission microscopy
Recently, also spatially resolved photoemission microscopy
data was obtained for the 1.1% Cr–doped compound [30].
This experimental technique makes it possible to obtain the detailed physical
information of photoelectron spectroscopy with a lateral resolution
of the order of 100 nm [46], and has already proven its capability of
spatially resolving inhomogeneous electronic structures [47] that would otherwise give an average signal with macroscopic probes [48].
Applied to the 1.1% Cr–doped compound, this method provides
a spectacular confirmation of our interpretation based on a mixed
phase state in the paramagnetic metallic phase: in
Fig. 8 we show the microscopic images together
with the PES for the labeled positions. At 260K one clearly observes a
mixture of areas with coherent excitations (with finite spectral weight at
the Fermi energy) and insulating regions (gapped spectra) as we would
expect in our scenario. Upon heating, the system
becomes completely insulating (compare the image at 320K). Note,
after cooling down to 220K again the same “map” as before is
recovered.
Note, differences in Fig. 8 between 220 and 260K are due to
the different temperatures, not due to the hysteresis loop,
see the additional data in [30].
This memory effect becomes even more evident in a similar study
on the phase transition between the paramagnetic metallic and the antiferromagnetic
insulating phase [49]. This suggests a correlation between
the position of the insulating regions and the nucleating action of structural defects
in the material, which tend to guide the natural tencency of this system
towards phase separation. The structural defects may well be related to
the lattice strain caused by the presence of Cr–impurities in the material,
even though this conjecture has to be further clarified both experimentally and theoretically.
5 X–ray absorption on the V–K–edge: Pressure vs. doping
Among the different experimental methods recently employed to study
the electronic properties of the Mott transition in Cr–doped
V2O3 [35, 50, 51, 42, 52], X-ray
absorption spectroscopy (XAS) has played a crucial role. For instance, it was the
detailed investigation of the V absorption
edges [5] that demonstrated the necessity of abandoning
the simple one band, , model to obtain a realistic description
of the changes in the electronic structure at the phase
transition. Further, Park et al. obtained valuable quantitative information
about the vanadium ground state for different amounts of doping and
temperatures [5] and formulated it as a linear combination of the
and the states which
were mentioned earlier. This kind of tool would be perfect to also
clarify the question which remains from the discussion of the previous
section: What is the character of the metallic ground state of the
Cr–doped sample under pressure? However, unfortunately the V
absorption falls in the region of soft x–ray radiation, and
thus, due to the specific absorption characteristic of the diamond
anvil cell used for the pressure measurements, it cannot be employed in our
case.
But fortunately XAS can also be performed at the V –edge in the
hard x–ray range, i.e., in a spectral region without particular
absorption of the diamond anvil cell. In this case, the pre–edge will carry most of the
physical information we are interested in, as it is predominantly due
to transitions. The excitations in this pre–edge
region are influenced also by the core hole and should be considered to be
of an excitonic nature. Beside the possibility of measuring the V
-edge under pressure condition we obtain also a more straightforward
interpretation. Namely, due to the simple spherical symmetry of the
-core hole, the multiplet structure reveals a more direct view on the
-states.
Motivated by the above considerations, we used in Ref. [42, 53] V -edge XAS to explore extensively the MIT in V2O3 by
changing temperature, doping and applying an external pressure. The
onsets of the -edges were analyzed by a novel computational scheme combining
the LDA+DMFT method with configuration interaction (CI) full multiplet
ligand field
calculations to interpret subtle differences at the PM–PI
transition.
Such CI, or as they are frequently called ’cluster calculations’ became within the last 25 years a popular parameter based method for fitting experimental data in order to extract information on charge, spin, and orbital degrees of freedom particularly in correlated transition metal oxides (see e.g. Refs. [54, 55, 56, 57]). In this work, however, we do not fit to experiment, but instead use parameters derived from an ab initio LDA+DMFT scheme in order to calculate the experimentally measured x-ray spectrum (for further, more technical details see Ref. [7]).
This analysis allowed us to: (i) observe in detail the changes in
This allowed us to: (i) observe in detail the changes in
the electronic excitations, providing also a direct estimate of the
Hund’s coupling (recall the discussion of the LDA+DMFT spectral
functions in the previous chapter) (ii) analyze the physical
properties of the PI and PM phase on both sides of the MIT, leading to
the main result of our work: (iii) understand the difference between
P, T or doping-induced transitions. This difference is mainly related
to the occupancy of the orbitals, suggesting the existence of
a new “pressure” path between PI and PM in the phase diagram, which is distinctive from the ”doping” path. The
XAS is in that respect complementary to the optical conductivity
measurements. The optical conductivity is
connected to somewhat non–local excitations. Therefore it was a great
tool to confirm the mixed phase scenario. In contrast the XAS, or more
specifically the excitonic features of XAS offers us information about the occupations from
a completely localized perspective which is needed in order to formulate
the ground state in the language of localized Wannier orbitals. This information in turn
could not be extracted from the optical
conductivity.
For the experiments high quality samples of
(V1-xCrx)2O3 with various doping in the PM () and
PI phases ( and ) at ambient conditions were used in [42]. The MIT was
also crossed for the doping by changing temperature and for the
doping by pressure. To obtain the best resolution, the XAS
spectra were acquired in the so-called partial fluorescence yield
(PFY) mode [58], monitoring the intensity of
the V-K
() line as the incident energy is swept across the
absorption edge.
Further experimental details can be found in
[42, 53].
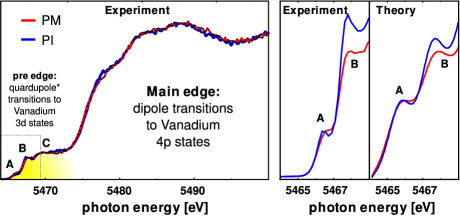
Powder data and isotropic calculations
The T–dependent absorption spectra are displayed in
Fig. 9 left hand side for both PM (200 K) and PI (300 K) phases for the
powder sample. The spectra have been normalized to an edge
jump of unity. We will focus on the pre–edge region, where
information about the V -states can be extracted as it is indicated
in the plot. It can be decomposed into three spectral features (A,B,C)
which all vary in intensity as the system is driven through the MIT
whereas C is considerably broader then A and B. Notice that no
feature is observed below peak A contrary to the early results of
Ref. [59] but in agreement with the more recent data of
Ref. [60]. Within a simplified atomic like picture, one
could directly relate the intensity of features A,B and C to the
unoccupied states: The V– states are split into one
and two states under trigonal distortion of the V sites [6]
as shown in Fig. 2. Starting from a V–, configuration,
one can either add an electron to the subshell yielding peaks A and B, or add an electron to the
sub–shell which gives rise to the broader peak C. In this picture,
Hund’s rule exchange splits peaks A and B into a quartet () and
doublet () states.
This point of view is, however, oversimplified as the V electrons are
strongly correlated and, in the pre–edge region, the spectra are
still largely influenced by the core hole potential. Keeping that
in mind, we have simulated in [42, 7] the pre–edge by combining CI with LDA+DMFT
calculations for which the one particle part (LDA) input corresponds
to the level diagram in Fig. 2. We concentrate our analysis to peaks A and B, since peak C relates mainly
to the unoccupied orbitals. These hybridize much stronger
with the ligands and thus lack direct information on the
Mott transition; peak C may also be related to
non–local excitations (not included here) [61] which
sensitively depend on the metal–ligand distance.
Let us also note that the V sites in V2O3 are non
centro–symmetric which leads to an on–site mixing of V- and
V--orbitals and interference between dipole and quadrupole
transitions [62]. This interference has been included in our scheme,
see [7] for details, together with the linear
dichroism measurements.
The CI calculations [42, 7] confirm that for the ground state the occupancy ratio between the
(,) and (,) states is smaller in
the PI than in the PM
phase [18, 5]: The isotropic
CI–based calculated XAS spectra in the pre-edge region reported in
Fig. 9 right hand side agree well with the experimental data for both
the energy splitting of features A and B and the ratio of their
spectral weight (SW) which increases in the PM phase.
Considerable insight can be gained by comparing CI and LDA+DMFT
calculations. Our LDA+DMFT calculations [42], performed using
the same NMTO Hamiltonian
with the 1.1% Cr–doped V2O3 and Hirsch–Fye Quantum Monte Carlo as impurity
solver, confirm the above mentioned tendency. Specifically we obtain
a mixing of : and : for the
(,):(,) occupation in
the PM and PI phases respectively.
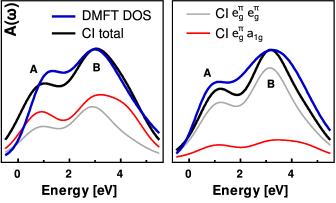
Remarkably the simple structure of the core hole
potential in the -edge spectroscopy ( i.e. spherical potential) allows us to associate the
pre–edge spectrum with the integrated spectral function above the
Fermi energy calculated by LDA+DMFT in which we do not take into
account the core hole effects. The electron–addition part of the
spectral function shows three main features in PM phase: a
coherent excitation at the Fermi level and a much broader double
peak associated to the incoherent electronic excitations, i.e., the
upper Hubbard band (UHB), almost identically to
the undoped compound. In the PI phase obviously, only the latter
survives. Comparison with the experimental spectra clearly
shows that the pre–edge features have to be related to the
“incoherent” part of the spectral function only. The physical reason is that the
core hole potential localizes the electrons destroying
the (already strongly renormalized) coherent quasiparticle excitations and making the XAS spectrum
atomic–like. The “incoherent” LDA+DMFT, CI and experimental
spectra shown in Figs. 10 and 9, respectively,
agree in many aspects, especially as for the splitting of the
first two peaks by 2.0 eV (1.8 eV in experiment) which
originates in LDA+DMFT from the Hund’s exchange in the Kanamori
Hamiltonian (see discussion of the LDA+DMFT spectral functions in Section
2). This further validates the choice of eV used in our
calculations in contrast to larger values assumed in previous
studies [18, 63], and also clarifies
the mismatch between XAS and LDA+DMFT spectra reported in the undoped
V2O3 compound [18] where incoherent excitonic
features were identified by coherent quasiparticle excitations. Moreover, the ratio between
A and B peak displays the same trend in the PM-PI
transition as the CI (or experimental) data. The quantitative
difference between the two calculations is attributed to the lack of
matrix elements in LDA+DMFT.
The intensity ratio of the first two incoherent excitations peaks A
and B (associated to the quartet and doublet states in the oversimplified picture)
thus appears as the key spectral parameter to understand the
differences between PM and PI. Even in a powder sample, this ratio is
still sensitive to the orbital occupation of the initial
state. Indeed, due to the
trigonal distortion a considerable spectral weight transfer from the
peak B to higher energies (corresponding to final states with two
electrons) can take
place for the () but not for the
() initial state. Therefore, the pre–edge XAS
can serve as a direct probe of the orbital occupation in the
ground-state. As a rule of thumb, the larger the ratio between the SW
of A and B, the larger the orbital occupation.
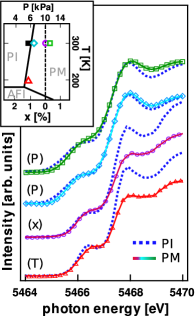
Under pressure
After we established an interpretation scheme of the vanadium
XAS –edge which allows us to use it as a ground state occupation probe it is
time to come back to the original task of inquiring the metallic phase
of Cr–doped V2O3.
Fig. 11 shows the XAS
powder spectra of the pressure–induced MIT with the corresponding
spectra for the temperature– and doping–driven transition (the markers in the
phase diagram, Fig. 11). We remark at this point
that the spectra taken under pressure display a relative shift
between main–edge (not shown) and pre–edge, which is in any case
irrelevant for our discussion of the ground state for which we only
need the intrinsic structure of the pre–edge. Hence, this shift is
compensated for the pressure spectra in Fig. 11.
Fig. 11 clearly evidences that (besides the shift)
contrary to the doping- or T-driven transition, very small
changes in spectral shapes and weights are observed in the pressure driven MIT.
In the light of the arguments discussed
above, our finding proves that the metallic state reached by applying
pressure is characterized by a much lower occupation of the
orbitals compared to the metallic state reached just by changing
temperature or doping. Importantly, the spectra measured
through the doping induced MIT are identical within the experimental
uncertainty to those measured through the temperature driven
transition. The
temperature–doping equivalence is confirmed by photoemission data
[64] and is consistent with the very similar lattice
parameter changes across the transition [2]. The
and equivalence is also borne out by the observation from XAS at
the -edges in doped V2O3 [5] that the
occupation within both the PM or PI phases is mostly independent of
the doping level. Hence, the local incoherent excitations probed by
XAS at the V edge or pre-edge are not directly affected by
disorder [31]. The reason for this is that XAS is
a local probe in the sense that we can expect the changes in
the XAS spectrum to be of the order of the percentage of the
atoms which have a different ground state.
6 Conclusion
The presented findings clearly shows the limits of the common assumption that temperature, doping, and pressure–driven MITs in V2O3 can be equivalently described within the same phase diagram666An early version of the phase diagram (Fig.15 in [2]) was actually drawn with a third pressure axis, but due to the idea of p–x equivalence, this was later abandoned. [2]. Indeed, the two different PM electronic structures that we observed reflect different mechanisms driving the MIT along different pathways. In the doping–driven MIT, the metallic phase is characterized by an increased occupation of the orbitals indicating a reduced “effective crystal-field-splitting” as the main driving mechanism towards metallicity [18, 19], related to the jump of the lattice parameter (1.4%) at the MIT [2]. In contrast, when pressure is applied, the occupation remains basically unchanged, so that this metallic phase seems to originate rather from an increased bandwidth, without any relevant changes of the orbital splitting. The smaller jump observed under pressure (0.7 %) corroborates our analysis.
Doping, temperature and pressure are shown to act differently on the interplay between electron correlations and crystal field, so that states previously considered to be equivalent metals are actually different.
A second important recent finding is the phase separation within the “paramagnetic metallic” phase for slightly Cr-doped V2O3. Photoemssion microscopy clearly reveals this phase separation on the microscale, showing that the “paramagnetic metallic” phase is actually a mixture of metallic and insulating regions. This requires the electrons to percolate inbetween the insulating regions, and hence leads to a reduced conductivity. In the optical conductivity this is reflected by a pronounced dip at low frequencies. This optical conductivity dip of phase-separated (Cr0.011V0.989)2O3 can be well described within the effective medium theory, either based on the experimental or on the LDA+DMFT optical conductivities (insulating plus metallic phase).
Acknowledgement We thank O. K. Andersen, M. Capone, M. Haverkort, N. Parragh and P. Wissgott for valuable discussions regarding the theory. The experimental results described in this paper have been obtained thanks to the collaborative effort of many colleagues, in particular B. Mansart, L. Baldassarre, F. Rodolakis, E. Papalazarou, A. Perucchi, D. Nicoletti, J.-P. Rueff, A. Barinov, P. Dudin and L.Petaccia. We acknowledges financial support from DFG Research Unit FOR 1346 project ID I597-N16 of the Austrian Science Fund (FWF), the EU-Indian network MONAMI, and the RTRA Triangle de la Physique. The calculations for the results presented have been done in part on the Vienna Scientific Cluster (VSC).
References
- [1] D. B. McWhan, A. Menth, J. P. Remeika, W. F. Brinkman, and T. M. Rice, Phys. Rev. B 7, 1920–1931 (1973).
- [2] D. B. McWhan and J. P. Remeika, Phys. Rev. B 2, 3734–3750 (1970).
- [3] D. B. McWhan, T. M. Rice, and J. P. Remeika, Phys. Rev. Lett. 23, 1384–1387 (1969).
- [4] W. R. Robinson, Acta Crystallographica Section B 31, 1153–1160 (1975).
- [5] J. H. Park, L. H. Tjeng, A. Tanaka, J. W. Allen, C. T. Chen, P. Metcalf, J. M. Honig, F. M. F. de Groot, and G. A. Sawatzky, Phys. Rev. B 61, 11506–11509 (2000).
- [6] T. Saha-Dasgupta, O. K. Andersen, J. Nuss, A. I. Poteryaev, A. Georges, and A. I. Lichtenstein, arXiv.org 0, 0907.2841 (2009).
- [7] P. Hansmann, M. W. Haverkort, A. Toschi, G. Sangiovanni, F. Rodolakis, J. P. Rueff, M. Marsi, and K. Held, Phys. Bev. B 85, 115136 (2012).
- [8] C. Castellani, C. R. Natoli, and J. Ranninger, Phys. Rev. B 18, 4945–4966 (1978).
- [9] C. Castellani, C. R. Natoli, and J. Ranninger, Phys. Rev. B 18, 4967–5000 (1978).
- [10] C. Castellani, C. R. Natoli, and J. Ranninger, Phys. Rev. B 18, 5001–5013 (1978).
- [11] R. M. Moon, Phys. Rev. Lett. 25, 527–529 (1970).
- [12] L. Paolasini, C. Vettier, F. de Bergevin, F. Yakhou, D. Mannix, A. Stunault, W. Neubeck, M. Altarelli, M. Fabrizio, P. A. Metcalf, and J. M. Honig, Phys. Rev. Lett. 82, 4719–4722 (1999).
- [13] S. Di Matteo, N. B. Perkins, and C. R. Natoli, Phys. Rev. B 65, 054413 (2002).
- [14] L. F. Mattheiss, Journal of Physics: Condensed Matter 6, 6477–6484 (1994).
- [15] I. S. Elfimov, T. Saha-Dasgupta, and M. A. Korotin, Phys. Rev. B 68, 113105 (2003).
- [16] A. Georges, G. Kotliar, W. Krauth, and M. J. Rozenberg, Rev. Mod. Phys. 68, 13 (1996).
- [17] K. Held, G. Keller, V. Eyert, D. Vollhardt, and V. I. Anisimov, Phys. Rev. Lett. 86, 5345–5348 (2001).
- [18] G. Keller, K. Held, V. Eyert, D. Vollhardt, and V. I. Anisimov, Phys. Rev. B 70, 205116 (2004).
- [19] A. I. Poteryaev, J. M. Tomczak, S. Biermann, A. Georges, A. I. Lichtenstein, A. N. Rubtsov, T. Saha-Dasgupta, and O. K. Andersen, Physical Review B (Condensed Matter and Materials Physics) 76, 085127 (2007).
- [20] M. Schramme, PhD thesis, Universität Augsburg, 2000.
- [21] S. K. Mo, J. D. Denlinger, H. D. Kim, J. H. Park, J. W. Allen, A. Sekiyama, A. Yamasaki, K. Kadono, S. Suga, Y. Saitoh, T. Muro, P. Metcalf, G. Keller, V. HeldK. Eyert., V. I. Anisimov, and D. Vollhardt, Phys. Rev. Lett. 90, 186403 (2003).
- [22] S. K. Mo, H. D. Kim, J. D. Denlinger, J. W. Allen, J. H. Park, A. Sekiyama, A. Yamasaki, S. Suga, Y. Saitoh, T. Muro, and P. Metcalf, Phys. Rev. B 74, 165101 (2006).
- [23] J. M. Tomczack, Spectral and Optical Properties of Correlated Materials, PhD thesis, Ecole Polytechnique, 2007.
- [24] J. M. Tomczak and S. Biermann, Phys. Rev. B 80, 085117 (2009).
- [25] L. Baldassarre, A. Perucchi, D. Nicoletti, A. Toschi, G. Sangiovanni, K. Held, M. Capone, M. Ortolani, L. Malavasi, M. Marsi, P. Metcalf, P. Postorino, and S. Lupi, Physical Review B 77, 113107 (2008).
- [26] A. Perucchi, L. Baldassarre, P. Postorino, and S. Lupi, J. Phys.: Condens. Matter 21, 323202 (2009).
- [27] K. Held, G. NekrasovI. A. Keller., V. Eyert, N. Blümer, , A. K. McMahan, R. T. Scalettar, T. Pruschke, V. I. Anisimov, and D. Vollhardt, phys. stat. sol. (b) 56, 829 (2007).
- [28] G. Kotliar, S. Y. Savrasov, K. Haule, V. S. Oudovenko, O. Parcollet, and C. A. Marianetti, Reviews of Modern Physics 78, 865 (2006).
- [29] K. Held, Advances in Physics 56, 829 – 926 (2007).
- [30] S. Lupi, L. Baldassarre, B. Mansart, A. Perucchi, A. Barinov, P. Dudin, E. Papalazarou, F. Rodolakis, J. P. Rueff, J. P. Itié, S. Ravy, D. Nicoletti, P. Postorino, P. Hansmann, N. Parragh, A. Toschi, T. Saha-Dasgupta, O. K. Andersen, G. Sangiovanni, K. Held, and M. Marsi, Nature Communications 1, 105 (2010).
- [31] A. I. Frenkel, D. M. Pease, J. I. Budnick, P. Metcalf, E. A. Stern, P. Shanthakumar, and T. Huang, Phys. Rev. Lett. 97, 195502 (2006).
- [32] H. Kuwamoto, J. M. Honig, and J. Appel, Phys. Rev. B 22, 2626–2636 (1980).
- [33] K. D. Cummings, J. C. Garland, and D. B. Tanner, Phys. Rev. B 30, 4170–4182 (1984).
- [34] T. M. Rice and W. F. Brinkman, Phys. Rev. B 5, 4350–4357 (1972).
- [35] P. Limelette, A. Georges, D. Jerome, P. Wzietek, P. Metcalf, and J. M. Honig, Science 302, 89–92 (2003).
- [36] M. Jarrell and J. E. Gubernatis, Physics Reports 269, 133 – 195 (1996).
- [37] I. Solovyev, N. Hamada, and K. Terakura, Phys. Rev. B 53, 7158–7170 (1996).
- [38] S. Y. Ezhov, V. I. Anisimov, D. I. Khomskii, and G. A. Sawatzky, Phys. Rev. Lett. 83, 4136–4139 (1999).
- [39] K. Held, A. K. McMahan, and R. T. Scalettar, Phys. Rev. Lett. 87, 276404 (2001).
- [40] G. Sangiovanni, A. Toschi, E. Koch, K. Held, M. Capone, C. Castellani, O. Gunnarsson, S. K. Mo, J. W. Allen, H. D. Kim, A. Sekiyama, A. Yamasaki, S. Suga, and P. Metcalf, Phys. Rev. B 73, 205121 (2006).
- [41] A. Toschi, P. Hansmann, G. Sangiovanni, T. Saha-Dasgupta, O. K. Andersen, and K. Held, Journal of Physics: Conference Series 200, 012208 (4pp) (2010).
- [42] F. Rodolakis, P. Hansmann, J. P. Rueff, A. Toschi, M. Haverkort, G. Sangiovanni, A. Tanaka, T. Saha-Dasgupta, O. Andersen, K. Held, M. Sikora, I. Alliot, J. P. Iti, F. Baudelet, P. Wzietek, P. Metcalf, and M. Marsi, Phys. Rev. Lett. 104, 047401 (2010).
- [43] M. J. Rozenberg, G. Kotliar, H. Kajueter, G. A. Thomas, D. H. Rapkine, J. M. Honig, and P. Metcalf, Phys. Rev. Lett. 75, 105–108 (1995).
- [44] G. L. Carr, S. Perkowitz, and D. B. Tanner, Infrared and milimeter waves (Academic Press, Orlando, 1985).
- [45] M. M. Qazilbash, M. Brehm, B. G. Chae, P. C. Ho, G. O. Andreev, B. J. Kim, S. J. Yun, A. V. Balatsky, M. B. Maple, F. Keilmann, H. T. Kim, and D. N. Basov, Science 318, 1750 (2007).
- [46] L. Gregoratti, S. Gunther, J. Kovac, M. Marsi, R. Phaneuf, and M. Kiskinova, Phys. Rev. B 59, 2018 (1999).
- [47] M. Marsi, S. L. Rosa, Y. Hwu, F. Gozzo, C. Coluzza, A. Baldereschi, G. Margaritondo, J. McKinley, S. Baroni, and R. Resta, J. Appl. Phys. 71, 2048 (1992).
- [48] M. Marsi, R. Houdré, A. Rudra, M. Ilegems, F. Gozzo, C. Coluzza, and G. Margaritondo, Phys. Rev. B 47, 6455 (1993).
- [49] B. Mansart, A. Barinov, P. Dudin, L. Baldassarre, A. Perucchi, E. Papalazarou, P. Metcalf, S. Lupi, and M. Marsi, Appl. Phys. Lett. 100, 014108 (2012).
- [50] S. K. Mo, J. D. Denlinger, H. D. Kim, J. H. Park, J. W. Allen, A. Sekiyama, A. Yamasaki, K. Kadono, S. Suga, Y. Saitoh, T. Muro, P. Metcalf, G. Keller, K. Held, V. Eyert, V. I. Anisimov, and D. Vollhardt, Phys. Rev. Lett. 90, 186403 (2003).
- [51] S. K. Mo, H. D. Kim, J. D. Denlinger, J. W. Allen, J. H. Park, A. Sekiyama, A. Yamasaki, S. Suga, Y. Saitoh, T. Muro, and P. Metcalf, Phys. Rev. B 74, 165101 (2006).
- [52] F. Rodolakis, P. Hansmann, J. P. Rueff, A. Toschi, M. Haverkort, G. Sangiovanni, K. Held, M. Sikora, A. Congeduti, J. P. Itie, F. Baudelet, P. Metcalf, and M. Marsi, Journal of Physics: Conference Series 190, 012092 (2009).
- [53] F. Rodolakis, J. P. Rueff, M. Sikora, I. Alliot, J. P. Iti, F. Baudelet, S. Ravy, P. Wzietek, P. Hansmann, A. Toschi, M. Haverkort, G. S. K. Held, P. Metcalf, and M. Marsi, Phys. Rev. B 84, 245113 (2011).
- [54] A. Tanaka and T. Jo, Journal of the Physical Society of Japan 63, 2788 (1994).
- [55] F. M. F. de Groot, Journal of Electron Spectroscopy and Related Phenomena 67, 529 (1994).
- [56] T. Thole, Journal of Electron Spectroscopy and Related Phenomena 86, 1 (1997).
- [57] M. W. Haverkort, Spin and orbital degrees of freedom in transition metal oxides and oxide thin films studied by soft x–ray absorbtion spectroscopy, PhD thesis, Universität zu Köln, 2005.
- [58] F. de Groot, Chemical Reviews 101, 1779–1808 (2001).
- [59] A. Bianconi and C. R. Natoli, Solid State Communications 27, 1177 – 1179 (1978).
- [60] J. Goulon, A. Rogalev, C. Goulon-Ginet, G. Benayoun, L. Paolasini, C. Brouder, C. Malgrange, and P. A. Metcalf, Phys. Rev. Lett. 85, 4385–4388 (2000).
- [61] C. Gougoussis, M. Calandra, A. Seitsonen, C. Brouder, A. Shukla, and F. Mauri, Phys. Rev. B 79, 045118 (2009).
- [62] I. S. Elfimov, N. A. Skorikov, V. I. Anisimov, and G. A. Sawatzky, Phys. Rev. Lett. 88, 015504 (2001).
- [63] M. S. Laad, L. Craco, and E. Müller-Hartmann, Phys. Rev. B 73, 045109 (2006).
- [64] F. Rodolakis, B. Mansart, E. Papalazarou, S. Gorovikov, P. Vilmercati, L. Petaccia, A. Goldoni, J. P. Rueff, S. Lupi, P. Metcalf, and M. Marsi, Phys. Rev. Lett. 102, 066805 (2009).