Two solar flares that became X-ray plasma ejections
Abstract
Solar flares and X-ray plasma ejections (XPEs) occur simultaneously but usually are separated spatially. We present two exceptional events observed by Yohkoh in 2001 October 2 (event 1) and 2000 October 16 (event 2), in which features of flares and XPEs are mixed. Namely, the soft and hard X-ray images show intense sources of emission that move dynamically. Both events occurred inside broad active regions showing complicated multi-level structure reaching up to 200 Mm high. Both events show also similar four-stages evolution: (1) a fast rise of a system of loops, (2) sudden changes in their emission distribution, (3) a reconfiguration leading to liberation of large amounts of plasma, (4) a small, static loop as the final remnant. Nevertheless, the events are probably caused by different physical processes: emerging magnetic flux plus reconnection (event 1) and reconnection plus ballooning instability (event 2). Different is also the final destination of the ejected plasma: in the event 1 overlying magnetic fields stop the ejection, in the event 2 the ejection destabilizes the overall magnetic structure and forms a coronal mass ejection (CME).
keywords:
Sun: corona - flares - X-ray Plasma Ejections (XPEs)1 Introduction
The solar corona is a place of restless interplay between plasma flows and magnetic fields continuously modified by new flux emerging from subphotospheric layers. X-ray radiation, emitted by hot plasma, provides insight into localized episodes of magnetic energy conversion. Sudden and temporal increases of brightness we call flares, macroscopic motions of hot plasma we call X-ray plasma ejections (XPEs).
Flares are more frequent than XPEs – only 50-70% of them are associated with XPEs (Ohyama & Shibata, 2000; Kim et al., 2005). On the other hand, if an XPE occurs, it does during the impulsive phase of its associated flare (Tomczak & Chmielewska, 2012). Plenty of movies collected in the XPE catalog111http://www.astro.uni.wroc.pl/XPE/catalogue.html show that pairs of associated events (flare + XPE) are usually separated spatially. It is in agreement with the canonical 2D CSHKP flare model (vestka & Cliver, 1992 and references therein), in which flare loops and a plasmoid occur on opposite sides of the reconnection point. In a 3D model, an expanding fluxtube has been proposed instead of the plasmoid (Shibata et al., 1995).
Flares and XPEs are usually easy to distinguish. XPEs are only rarely observed as sources of hard X-ray emission. Also in soft X-rays, flares are even several orders of magnitude brighter than XPEs. An appropriate simultaneous imaging of both events often needs different accumulation times of telescopes. On the other hand, motion of XPEs with velocities of km s-1 is easy for detection in soft X-ray movies, in comparison with slowly rising post-flare loop systems (several km s-1).
In the XPE catalog we found two spectacular events, in which features of flares and XPEs are mixed. They occurred on 2001 October 2 (event 1, the catalog number 346) and 2000 October 16 (event 2, the catalog number 252). For both events we observe fast moving magnetic structures, being bright sources of soft and hard X-ray emission. This appearance seems to be in contradiction with the standard flare model. Therefore our motivation is to propose a consistent mechanism, explaining the observed features.
2 INSTRUMENTS AND AVAILABLE DATA
In our analysis we used observations derived by the following instruments: (1) Yohkoh Soft X-ray Telescope, SXT (Tsuneta et al., 1991), (2) Yohkoh Hard X-ray Telescope, HXT (Kosugi et al., 1991), (3) Yohkoh Bragg Crystal Spectrometer, BCS (Culhane et al., 1991), (4) SOHO Extreme ultraviolet Imaging Telescope, EIT (Delaboudiniere et al., 1995), (5) SOHO Large Angle Spectroscopic Coronagraph, LASCO (Brueckner et al., 1995).
Yohkoh provided the almost complete set of X-ray observations illustrating the whole evolution of both analyzed events. SXT images were made sequentially with three different spatial resolutions: full resolution, FN, – 2.45 arcsec, half resolution, HN, – 4.9 arcsec, and quarter resolution, QN, – 9.8 arcsec. A particular resolution means a specific field of view: 2.6 2.6 arcmin2, 5.2 5.2 arcmin2, 10.5 10.5 arcmin2, for the FN, HN, and QN resolutions, respectively. For the FN resolution three different filters were used and the time exposure was automatically adjusted. For the HN and QN resolutions the time exposure was constant and long enough to record weak-emission structures. In consequence, the brighter pixels were heavily saturated. For the HN resolution two filters were used and for the QN resolution – only one.
Both events emitted enough photons in the energy bands L (14-23 keV) and M1 (23-33 keV) of the HXT to reconstruct a sequence of hard X-ray images. The number of counts in the band M2 (33-53 keV) is limited – only a few images can be made. There are no counts above the background in the band H (53-93 keV).
Both events had also enough counts for allowing us to investigate evolution changes of He-like ions recorded by the BCS. On the other hand, the number of counts is luckily not so high to be suffered by some instrumental effects like the line narrowing or the crystal fluorescence (Trow et al., 1994).
Important supplementary data were provided by the EIT and the LASCO instruments, especially at large spatial scales. EIT imaged the full-Sun images in Å with a 12-minutes cadence. The LASCO coronagraphs C2 and C3 recorded on average 3 and 2 images per hours, respectively.
Unfortunately, the TRACE satellite provided its high-resolution and high-cadence images of other active regions than those in which the two events under study occurred.
3 Event 1 (2001 OCTOBER 2)
Event 1 occurred in the NOAA AR 9628 active region close to the western solar limb. The estimated solar coordinates were W86.42.9 S17.4 (Tomczak, 2009). The light curves recorded by the Geostationary Operational Environmental Satellites (GOES) show a fast rise to the short-term maximum at 17:16 UT (GOES class C4.7) followed by a slow decay lasting about four hours.
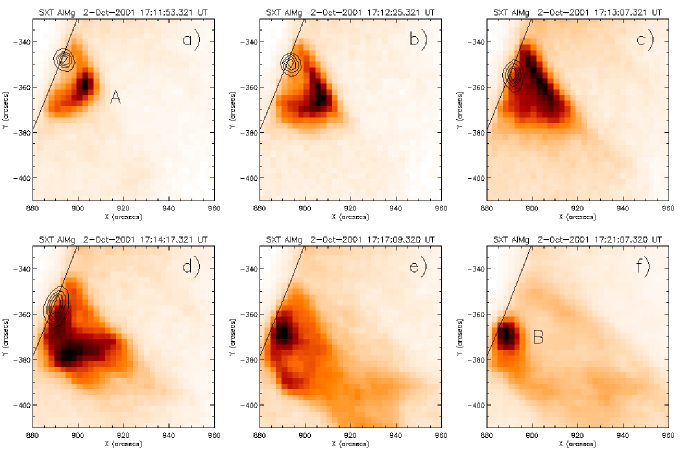
The six SXT snapshots illustrating the early evolution of the event are given in Figure 1222Full movies are available in the XPE Catalog: event number 346, entry XPE. The following four stages of evolution can be distinguished:
-
1.
A fast rise of the loop A (17:11.5-17:13 UT, Figures 1a-b):
This loop is responsible for the maximum seen in the GOES light curves. The progressive increase of the apex height is associated with the progressive decrease of the distance between the loop footpoints. The velocity of the apex height rises from 75 to 165 km s-1, the velocity of the footpoint approach decreases from 60 to 20 km s-1. The above changes cause an increase of the loop’s curvature, described by the ratio between height and diameter. The ratio changed from 0.3 to 1.0. The loop had a circular shape () around 17:12 UT. At the same moment the loop was almost symmetrical, as suggests the ratio , where and are the distances between projection of the loop apex on the solar surface and the north or south footpoint, respectively. Earlier and later the apex was shifted to the south reaching the maximum value at 17:13 UT just before the reconfiguration. -
2.
Sudden changes in the emission distribution inside the loop A (17:12.5-17:13 UT, Figure 1c):
The typical bright loop-top vanishes and the almost uniformly distributed emission concentrates in the northern leg. -
3.
The main reconfiguration (17:13-17:16 UT, Figures 1d-e):
The loop A seems not to exist anymore. Two large radial structures become seen in distance about 15 Mm one from to other. A plasma outflow is clearly seen along them. The previous loop A was contained somewhere between these structures. -
4.
The long-lived remnant (after 17:16 UT, Figure 1f):
A small loop B at the place of the southern footpoint of the loop A is the brightest. The loop does not change distinctly its size and shape.
The filter ratio method allows us to estimate amounts of plasma inside the loop A and the loop B. We obtain and grams, respectively. It means that at least grams of plasma was liberated due to the reported reconfiguration.
The HXT images reconstructed in the energy bands L, M1, and M2 accordingly localize the main hard X-ray source at the solar limb, somewhere between the footpoints of the loop A (see isolines in Figure 1). The hard X-ray spectra are relatively flat at the beginning (17:11:20 UT) with the power-law indices of about 4. The progressive steepening leads to values of of about 8 at 17:16 UT.
The high-resolution spectra of He-like ions of Fe, Ca, and S recorded by the BCS show that the observed lines are extremely broadened within time interval between 17:11.5 and 17:14.5 UT. The calculated values of the non-thermal turbulent plasma motions reach even 600 km s-1 for Fe xxv and Ca xix ions, and 400 km s-1 for S xv. For flares these values are usually 2-3 times lower (e.g., Alexander et al., 1998; Mariska & McTiernan, 1999).
Further evolution of the plasma liberated from the loop A, that did not join the loop B, can be observed in the SXT images of the HN and QN resolution having broader field of view. First, the response of many loops of heights below 90 Mm is seen. After that the systematic expansion along a narrow, radial structure between heights 100 and 190 Mm occurs, for the time interval 17:24-17:37 UT. It gives a modest average velocity of about 110 km s-1. Further expansion fades above the level 200-250 Mm.
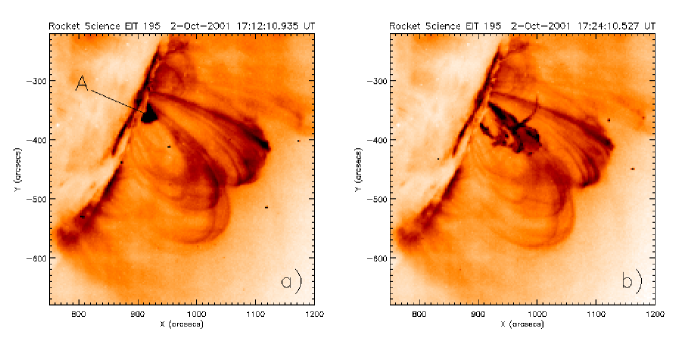
The images acquired by EIT allow us to better understand the overall magnetic structure of the active region. Figure 2 shows two of them taken during the early evolution of the event. It is seen that the loop A is localized close to the footpoints of the high loops forming an arcade reaching altitude of 170 Mm. Next snapshots, not included in this paper, show that the low-altitude reconfiguration does not modify the arcade with the exception of some oscillations. Unfortunately, the sparse, 12-minutes cadence does not allow to calculate the period of oscillations.
No coronal mass ejection (CME) nor a radio bursts were connected with the described event.
4 Event 2 (2000 October 16)
This event occurred in the NOAA AR 9182 active region behind the western solar limb. The estimated solar coordinates were W107.43.3 N01.9 (Tomczak, 2009). It means that only the higher parts of this active region (above 34 Mm) could be seen. Light curves recorded by (GOES) show a fast rise between 05:33 and 05:40 UT, a flat maximum around 05:49 UT (GOES class C7.0), then a slower decay until 06:35 UT. Thereafter, another flare occurred in the same active region. It was stronger (M2.5 class) and lasted about 9 hours, therefore the described event can be considered as its precursor.
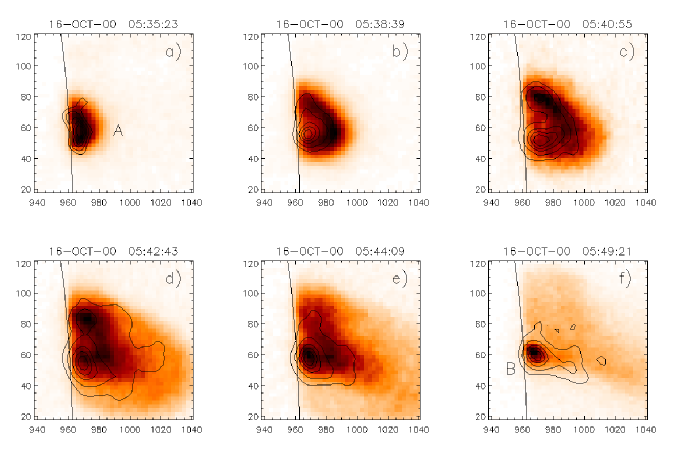
The six SXT snapshots illustrating the early development of the event are given in Figure 3333Full movies are available in the XPE Catalog: event number 252, entry XPE. Similar four-stages evolution, like for the event 1, can be distinguished:
-
1.
A fast rise of the loop A (05:33-05:39.5 UT, Figures 3a-b):
This loop is responsible for the maximum seen in the GOES light curves. The apex rises almost constantly and its velocity does not exceed 100 km s-1. The curvature of the apex stays approximately the same. -
2.
Sudden changes in the emission distribution inside the loop A (05:39.5-05:41 UT, Figure 3c):
Instead of the bright loop-top the northern leg becomes most dominant. The movies make an impression of a massive plasma downflow. -
3.
The main reconfiguration (05:41-05:46 UT, Figures 3d-e):
The velocity of the apex rise suddenly increases above 200 km s-1, then a modest deceleration ( km s-2) occurs. A strong emission drop of fast expanding apex together with a gradual concentration of the bright emission close above the solar limb make an impression of plasma liberation from the loop A. However, in spite of the progressive growth the initial shape of the loop is still recognizable. -
4.
The long-lived remnant (after 05:46 UT, Figure 3f):
A small loop B inside the inner contour of the loop A at the beginning of the stage 1 is the brightest. The loop B does not change distinctly its size and shape.
The filter ratio method allows us to estimate amounts of plasma inside the loop A and the loop B. We obtain and grams, respectively. It means that at least grams of plasma was liberated due to the reported reconfiguration.
The HXT images reconstructed in the energy bands: L, M1, and M2 show that the loops A and B are also main hard X-ray emission sources (see isolines in Figure 3). The hard X-ray spectra are relatively soft (power-law indices are between 7 and 9), which can be considered as typical appearance of coronal sources (Tomczak, 2009). The three weak increases of hard X-ray flux observed in the energy band M2 occurred at 05:38, 05:43, and 05:48 UT.
The spectra of He-like ions Fe, Ca, and S recorded by the BCS show that the observed lines are very broad within the time interval between 05:36 and 05:46 UT. The calculated values of non-thermal turbulent plasma motions reach even 400, 250, and 170 km s-1 for Fe xxv, Ca xix, and S xv, respectively. The time changes of the non-thermal motions have a complex look with three maxima at 05:38, 05:41.5, and 05:44 UT.
Further evolution of the plasma liberated from the loop A, that did not join the loop B, can be observed in the SXT images of the HN and QN resolution having broader field of view. The systematic expansion of a loop-like structure until 06:05 UT, when Yohkoh came into the Earth’s shadow, is seen. The final altitude is above 200 Mm, which gives an average velocity below 100 km s-1. The expansion occurs south to the arcade of loops of the heights between 80 and 140 Mm.
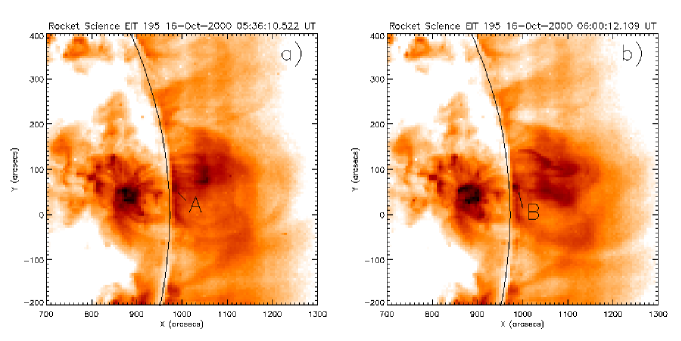
The EIT 195 Å images allow us to better understand the overall magnetic structure of the active region. Figure 4 shows two of them taken during the development of the event. It is seen that the expansion caused by the reconfiguration of the loop A destabilizes the arcade already existing to the north. Next snapshots, not included in this paper, show the violent explosion that occurred about 06:36 UT. It is followed by the CME, reported in the SOHO LASCO CME Catalog444http://cdaw.gsfc.nasa.gov/CME_list/ (Gopalswamy et al., 2009), as a fast ( km s-1), halo event.
5 Discussion
At the first look, the described events seem to be quite similar, nevertheless, in our opinion different mechanisms are responsible for their occurrence. Therefore, they are discussed in separate subsections.
5.1 Event 1
The magnetic configuration, in which the event of 2001 October 2 occurred, resembles that introduced in the Emerging Flux Model (Heyvaerts et al., 1977). In this model, subphotospheric magnetic fields emerge due to the buoyancy effect and meet overlying coronal magnetic fields. A current sheet is formed and reconnection process is responsible for energy release and acceleration of electrons.
In the described event the loop A and the legs of some loops seen in the EIT image represent emerging and overlying coronal fields, respectively. The reconnection develops since 17:11 UT and the loop A is filled with hot, dense plasma due to chromospheric evaporation, which makes the loop bright in soft X-rays. The accelerated electrons are stopped at the entrance to the chromosphere producing hard X-ray emission. When the inflow of subphotospheric fields weakens, the loop A begins to deform. The further reconnection destroys the loop and either the liberated plasma falls downward to the loop B, that is a postflare loop, or expands outward along magnetic lines of the overlying arcade. These lines protect against the final evacuation of plasma from the Sun (no CME occurs). The flows are generally sub-Alfvnic, therefore no radio type II burst was reported.
5.2 Event 2
We consider the loop A, seen at the beginning of the event of 2000 October 16, as an unusual example of an XPE formed due to the magnetic reconnection behind the solar limb. XPEs are rather faint sources of X-ray emission, therefore the loop A resembles a flare. Further expansion of the loop A leads probably to an instability.
Among from macroscopic hydrodynamic and MHD plasma instabilities relevant in coronal loops (Aschwanden, 2004), the ballooning instability seems to be the most promising. The ballooning instability is a kind of interchange instabilities occurring at the interface between two fluid layers. For this particular instability the interface between two layers, where the plasma beta is low () and high (), is important. The ballooning instability is often recognized in tokamak fusion power reactors and in the Earth’s magnetosphere but rather exceptionally in the solar corona.
Shibasaki (2001) discussed the interplay of outward (pressure gradient, magnetic pressure gradient, centrifugal force) and inward (magnetic tension, gravitation) forces in a context of the equilibrium of plasma in a coronal loop. We used formulae developed by Shibasaki to quantify the most important parameters responsible for the balance in the described event, i.e. centrifugal force of thermal plasma flows along the loop curvature versus magnetic tension force.
Crossing of a terminal value of the plasma beta triggers in the ballooning instability further evolution, therefore we assumed that at the apex of the loop A just before the main reconfiguration. In this way it is possible to estimate the magnetic field strength. For the temperature, MK, and the electron number density, cm-3, calculated according to the filter ratio method, we obtain G. We adopted the dipole field formula, , where Mm, proposed by Aschwanden et al. (1999), to calculate plasma beta maps during the main reconfiguration. The results are consistent with the ballooning instability interpretation – there is a permanent area of high- around the apex of the expanding loop-like structure, of which the loop A was a progenitor.
The detailed numbers show that the increase of the plasma beta was mainly caused by a drop of the magnetic field strength due to the expansion. However, the symptoms of energy release like the electron number density increase and the presence of turbulent motions should be also taken into consideration.
6 Conclusions
The two described events show that the division between XPEs and flares can be artificial, to some extent. Magnetic reconnection associated with hydrodynamic response on energy release can magnetic loops bring either a loss-of-equilibrium or an inflow of dense, chromospheric plasma. In the first case we observe an XPE, whereas in the second case – a flare. Usually XPEs and flares are spatially separated because magnetic structures above the reconnection point are weaker than those situated below. The described events are unique because magnetic loops strong enough to keep hot, dense plasma became weaker due to the interaction with an overlying coronal field (event 1) or due to expansion (event 2).
The overall structure of active regions plays very important role in the final destination of plasma ejected due to instabilities in the lower corona. Even similar velocities of expansion lead to opposite scenarios: full confinement (event 1) versus CME formation (event 2).
Acknowledgements
Yohkoh is a project of the Institute of Space and Astronautical Science of Japan. SOHO is a project of international cooperation between ESA and NASA. We acknowledge useful comments made by the Referee and financial support from the Polish National Science Centre grant 2011/03/B/ST9/00104.
References
-
Alexander, D., Harra-Murnion, L. K., Khan, J. I., Matthews, S. A.: 1998, Astrophys. J. Lett., 494, L235.
-
Aschwanden, M. J.: 2004, Physics of the Solar Corona. An Introduction, Springer: Praxis.
-
Aschwanden, M. J., Newmark, J. S., Delaboudiniere, J.-P., et al.: 1999, Astrophys. J., 515, 842.
-
Brueckner, G. E., et al.: 1995, Solar Phys., 162, 357.
-
Culhane, J. L., et al.: 1991, Solar Phys., 136, 89.
-
Delaboudiniere, J.-P., et al.: 1995, Solar Phys., 162, 291.
-
Gopalswamy, N., et al.: 2009, Earth Moon Planet, 104, 295.
-
Heyvaerts, J., Priest, E. R., Rust, D. M.: 1977, Astrophys. J., 216, 123.
-
Kim, Y.-H., Moon, Y.-J., Cho, K.-S., Kim, K.-S., Park, Y. D.: 2005, Astrophys. J., 622, 1240.
-
Kosugi, T., et al.: 1991, Solar Phys., 136, 17.
-
Mariska, J. T., McTiernan, J. M.: 1999, Astrophys. J., 514, 484.
-
Ohyama, M., Shibata, K.: 2000, J. Atm. Solar Terr. Phys., 62, 1509.
-
Shibasaki, K.: 2001, Astrophys. J., 557, 326.
-
Shibata, K., Masuda, S., Shimojo, M., et al.: 1995, Astrophys. J. Lett., 451, L83.
-
vestka, Z., Cliver, E. W.: 1992, in IAU Coll. 133, Eruptive Solar Flares, ed. Z. vestka, B. V. Jackson, & M. E. Machado (New York: Springer), 1.
-
Tomczak, M.: 2009, Astron. Astrophys., 502, 665.
-
Tomczak, M., Chmielewska, E..: 2012, Astrophys. J. Suppl., 199, 10.
-
Trow, M. W., Bento, A. C., Smith, A.: 1994, Nucl. Instrum. Methods Phys. Res., 348, 232.
-
Tsuneta, S., et al.: 1991, Solar Phys., 136, 37.