Transient Gamma-ray Emission from Cygnus X-3 Detected by AGILE: Leptonic and Hadronic Emission Models
Abstract
The AGILE satellite detected several episodes of transient -ray emission from Cygnus X-3. Cross-correlating the AGILE light curve with both X-ray and radio monitoring data, we found that the main events of -ray activity were detected while the system was in soft spectral X-ray states, that coincide with local and often sharp minima of the hard X-ray flux, a few days before intense radio outbursts. This repetitive temporal coincidence between the -ray transient emission and spectral state changes of the source turns out to be the spectral signature of high-energy activity from this microquasar. The -ray differential spectrum of Cygnus X-3 (100 MeV – 3 GeV), which was obtained by averaging the data collected by AGILE during the -ray events, is consistent with a power law of photon index . Finally, we examined leptonic and hadronic emission models for the -ray activity and found that both scenarios are valid. In particular, in the leptonic model – based on inverse Compton scatterings of mildly relativistic electrons on soft photons from both the Wolf-Rayet companion star and the accretion disk – the emitting particles may also contribute to the overall hard X-ray spectrum, possibly explaining the hard non-thermal power-law tail seen during special soft X-ray states in Cygnus X-3.
I Introduction
Cygnus X-3 is a high-mass X-ray binary, whose companion star is a Wolf-Rayet (WR) star (van Kerkwijk et al., 1992) with a strong helium stellar wind (Szostek & Zdziarski , 2008). The system is located at a distance of about 7-10 kpc (Ling et al., 2009). The orbital period is 4.8 hours, as inferred from infrared (Becklin et al., 1973), X-ray (Parsignault et al., 1972), and -ray (Abdo et al., 2009) observations. Owing to its very tight orbit (orbital distance cm), the compact object is totally enshrouded in the wind of the companion star (Vilhu et al., 2009). The nature of the compact object is still uncertain although a black hole scenario is favored (Szostek & Zdziarski , 2008; Szostek et al., 2008).
In the radio band, the system shows strong flares (“major radio flares”) reaching up to few tens of Jy. Radio observations at milliarcsec scales confirm emissions (at cm wavelengths) from both a core and a one-sided relativistic jet (), with an inclination to the line-of-sight of (Mioduszewski et al., 2001). The radiation from the jet dominates the radio emission from the core during (and soon after) the major flares (Tudose et al., 2010).
Cygnus X-3 exhibits a clear, repetitive pattern of (anti)correlations between radio and X-ray emission, and an overall anticorrelation between soft and hard X-ray fluxes (McCollough et al., 1999; Szostek et al., 2008).
Firm detections of high-energy -rays (HE -rays: 100 MeV) from Cygnus X-3 were published at the end of 2009: the AGILE (Astro-rivelatore Gamma a Immagini LEggero) team found evidence that strong -ray transient emission above 100 MeV coincided with special X-ray/radio spectral states (Tavani et al., 2009a), and the Fermi-LAT (Large Area Telescope) collaboration announced the detection of -ray orbital modulation (Abdo et al., 2009).
The -ray emission is most likely associated with a relativistic jet (Tavani et al., 2009a; Abdo et al., 2009; Dubus et al., 2010; Cerutti et al., 2011; Zdziarski et al., 2012), but the radiative process (leptonic or hadronic) is uncertain.
A possible leptonic scenario for -ray emission in Cygnus X-3 was proposed by Dubus et al., 2010: stellar ultraviolet (UV) photons from the WR star are Compton upscattered to HE by relativistic electrons accelerated in the jet.
A hadronic scenario accounting for -ray emission in microquasars was discussed by Romero et al. (2003, 2005). Their model is based on the interaction of a mildly relativistic jet with the dense wind of the companion star, and the -ray emission is due to the decay of neutral pions () produced by collisions.
Here we report an analysis of the whole monitoring of Cygnus X-3 during the “pointing” mode data-taking of the AGILE satellite. We present a study of the -ray spectrum by assuming both leptonic and hadronic scenarios.
This study is extracted from the paper of Piano et al. (2012), where all the details about this work are presented.
II Observations
The AGILE scientific instrument (Tavani et al., 2009b) is very compact and characterized by two co-aligned imaging detectors operating in the energy ranges 30 MeV–30 GeV (Gamma-Ray Imaging Detector, GRID: Barbiellini et al., 2002; Prest et al., 2003) and 18–60 keV (Super-AGILE: Feroci et al., 2007), as well as by both an anticoincidence system (Perotti et al., 2006) and a calorimeter (Labanti et al., 2006).
Until mid-October 2009 AGILE had operated in “pointing” mode with fixed attitude; in November 2009, AGILE entered “scanning mode”, which is characterized by a controlled rotation of the pointing axis.
During the “pointing” mode data-taking (2.5 years), AGILE-GRID was characterized by enhanced performances in the monitoring capability of a given source, especially in the energy band 100–400 MeV (see Bulgarelli et al., 2012a for details). Owing to the different pointing strategies of the AGILE and Fermi satellites, the high on-source cumulative exposure (between 100 and 400 MeV) of the AGILE-GRID may be fundamental in the observation of this particular source.
We report an analysis based on the AGILE-GRID data collected between 2007 November 2 and 2009 July 29. During this period, AGILE repeatedly pointed at the Cygnus region for a total of 275 days, corresponding to a net exposure time of 11 Ms.
We performed an analysis of the whole AGILE-GRID data using a detection algorithm developed by the AGILE team to automatically search for transient -ray emission. The algorithm initially analyzed 140 maps, each related to a 2-day integration (non-overlapping consecutive time intervals). The time bins containing the peak -ray emission, with detection significances greater than 3, were identified. The analysis was subsequently manually refined to optimize the determination of the time interval of the -ray emission. The whole analysis was carried out with the Build 19 version of the AGILE team software, using the FM3.119_2 calibrated filter applied to the consolidated dataset with off-axis angles smaller than .
We used a multi-source maximum-likelihood analysis (MSLA) to take into account the emission of the nearby -ray pulsars111The main characteristics of the persistent -ray sources that we used in the MSLA are reported in Table 1 of Chen, Piano et al. (2011). 1AGL J2021+3652 (PSR J2021+3651), 1AGL J2022+4032 (PSR J2021+4026), and 1AGL J2032+4102 (PSR J2032+4127). In particular, the MSLA is fundamental to avoid contamination by the pulsar PSR J2032+4127, located at a distance of . In this paper, we did not consider the off-pulse data for the nearby pulsar. Nevertheless, the MSLA accounted for the steady -ray emission from this source when calculating the significance and the flux of each -ray detection of Cygnus X-3. Moreover, we can exclude any substantial spectral contamination from the pulsar because the steady -ray emission from the pulsar222The steady -ray emission from the pulsar PSR J2032+4127, as detected by the AGILE-GRID, is photons for photon energies above 100 MeV, see Chen, Piano et al. (2011) for details. is much fainter than the mean flux of the active -ray emission from Cygnus X-3.
The main events of -ray activity, detected with a significance above (), are shown in Table 1.
| MJD | Flux [ photons ] | |
|---|---|---|
| 54507.76 - 54508.46 | 3.7 | 264 104 |
| 54572.58 - 54573.58 | 4.5 | 265 80 |
| 54772.54 - 54773.79 | 3.1 | 135 56 |
| 54811.83 - 54812.96 | 4.0 | 190 65 |
| 55002.88 - 55003.87 | 3.8 | 193 67 |
| 55025.05 - 55026.04 | 3.2 | 216 89 |
| 55033.88 - 55035.88 | 3.6 | 158 59 |
We found seven events, including those presented in Tavani et al. (2009a) and Bulgarelli et al. (2012a).
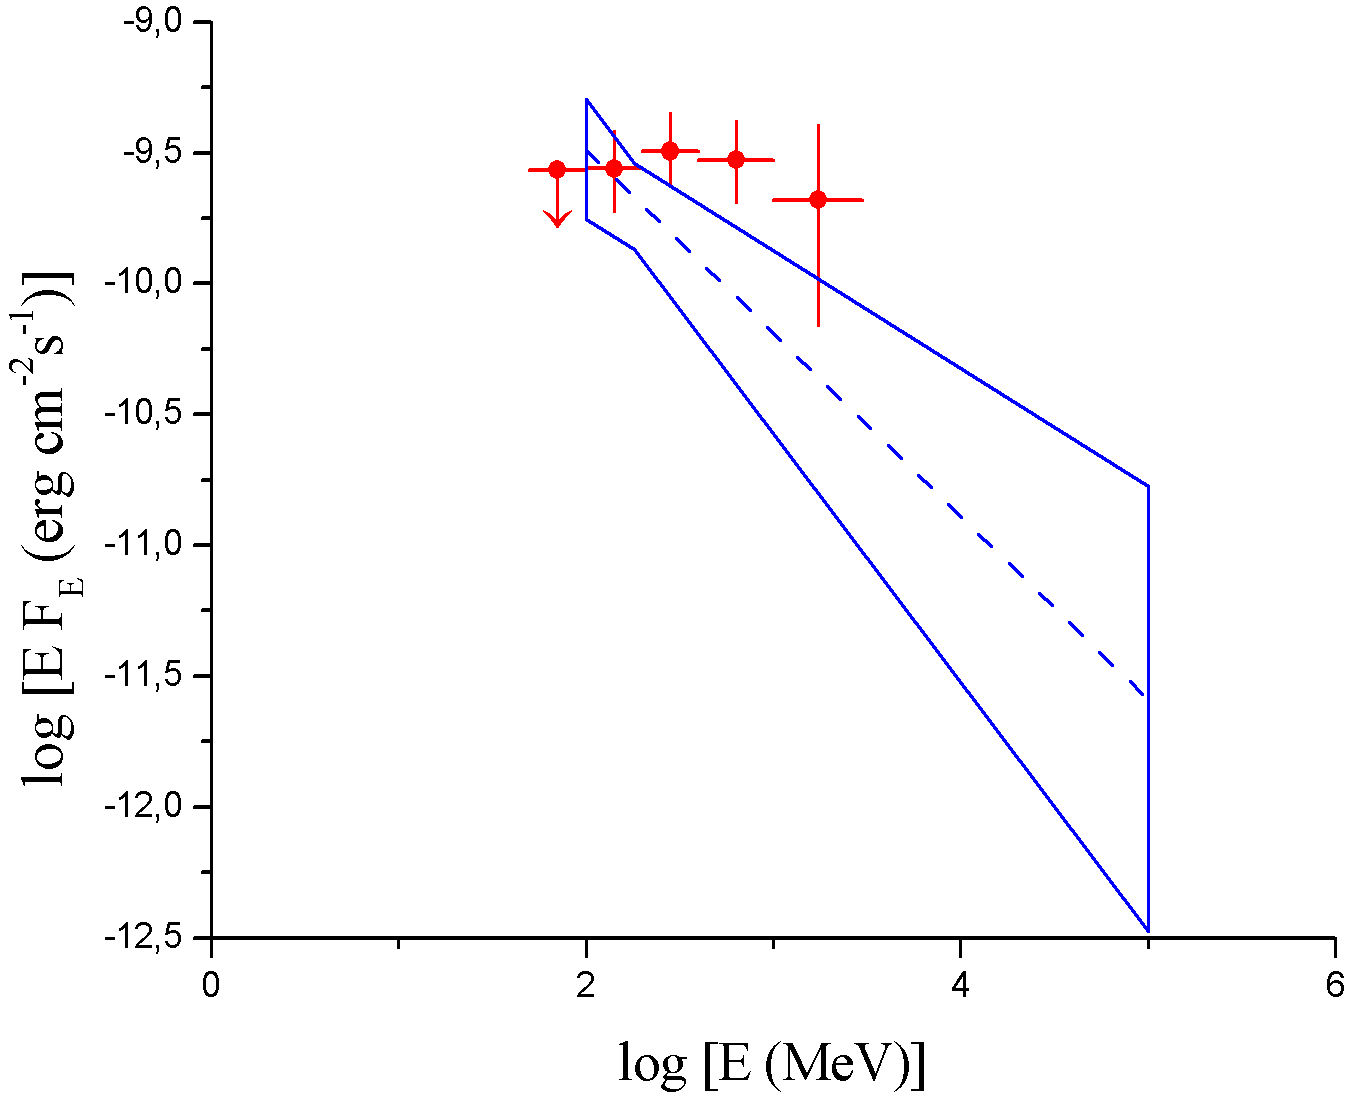
By integrating all the main events with the FM3.119_2 filter, we detected a -ray source at () at the average Galactic coordinate (stat) (syst), with a photon flux of photons above 100 MeV333Here we present an updated result for the analysis of the 7-event integration with respect to the one reported in Piano et al. (2011). In this paper, our analysis was carried out with a more recent version of the AGILE software tool (AG_multi4).. The corresponding post-trial significance for repeated flare occurrences (Bulgarelli et al., 2012b) is 5.5 Gaussian standard deviations. The average differential spectrum between 100 MeV and 3 GeV is well-fitted by a power law with a photon index .
In Figure 1, we compare the spectra of Cygnus X-3 obtained by the AGILE-GRID and Fermi-LAT (Abdo et al., 2009) during the -ray activity. We remark that the AGILE-GRID spectrum is related only to the peak -ray activity (the seven main events, lasting 1-2 days, in Table 1), whereas the Fermi-LAT spectrum is an average spectrum found during the two active windows (of about two months each) of -ray emission from Cygnus X-3 (MJD: 54750–54820 and MJD: 54990–55045).
In Piano et al. (2012) we presented the comprehensive multiwavelength light curve of Cygnus X-3, showing the transient -ray activity detected by the AGILE-GRID along with the hard X-ray (15-50 keV) fluxes from Swift/BAT (Burst Alert Telescope), soft X-ray (3-5 keV) fluxes from RXTE/ASM (Rossi X-ray Timing Explorer/All Sky Monitor), and radio flux density from the AMI-LA (15 GHz) and RATAN-600 (2.15, 4.8, 11.2 GHz) radio telescopes. If we refer to the seven main -ray episodes reported in Table 1, we found that (Piano et al., 2012):
-
•
There is a strong anticorrelation between the hard X-ray and -ray emission. The -ray flares detected by the AGILE-GRID are coincident with minima of the hard X-ray light curve (Swift/BAT count rate ).
-
•
Every time we detect -ray activity, Cygnus X-3 is in a soft spectral state (RXTE/ASM count rate ).
-
•
Every time we detect -ray episodes, the system is moving towards either a major radio flare (radio flux density Jy) or a quenched state preceding a major radio flare.
In particular, we found that the transient -ray emission occurs when the system is either moving into a quenched state (“pre-quenched”) or towards a radio flare (“pre-flare”), which has always been observed after a quenched state (Szostek et al., 2008), i.e., the -ray emission is detected when the system is moving into or out of a quenched state. Hence, from a purely phenomenological point of view, the quenched state seems to be a “key” condition for the -ray emission.
III Modeling the spectral energy distribution
By accounting for the X-ray, -ray (AGILE-GRID), and TeV emission (MAGIC spectral upper limits), we modeled the multiwavelength spectral energy distribution (SED) of Cygnus X-3 during a soft spectral state, with both the leptonic and hadronic scenarios. We considered an X-ray spectrum measured by RXTE-PCA444Proportional Counter Array (PCA) and RXTE-HEXTE555High Energy X-ray Timing Experiment (HEXTE) (3–150 keV) when the source was in a “hypersoft” state (Koljonen et al., 2010), the AGILE-GRID spectrum for the main -ray events (red spectral points in Figure 1), and the MAGIC differential flux upper limits obtained when the source was in the soft state. (Aleksić et al., 2010). The hypersoft spectrum of Cygnus X-3 is usually exhibited by the microquasar during the quenched state, which has been found to be correlated to the transient -ray emission. This X-ray spectral state is characterized by a weak and hard power-law tail (= 1.7–1.9) of non-thermal origin.
III.1 A leptonic scenario
We modeled the multi-frequency SED by assuming a simple leptonic scenario in which a plasmoid of high energy electrons/positrons, injected into the jet structure, upscatters via inverse Compton interactions soft seed photons from both the WR star and the accretion disk.
The physical parameters of the photon field are literature-based. We modeled the X-ray data with a black body (BB) spectrum characterized by a temperature keV, which is consistent with the typical characteristic temperature of the disk during the hypersoft/ultrasoft state (Hjalmarsdotter et al., 2009; Koljonen et al., 2010), and a . The main parameters that we used for the WR star are and (see Dubus et al., 2010). The WR star is assumed to emit UV photons isotropically. We modeled the average -ray emission in the orbital phase. Thus, the WR photons are assumed to come mainly from the side of the jet and collide with the relativistic leptons via IC scattering processes.
We carried out two different models: in the first one (leptonic model “A”), the plasmoid interacts with the soft photon bath “close” to the disk (the star-plasmoid distance is cm), whereas in the second one (leptonic model “B”) the interaction region is “far away” from the accretion disk (the star-plasmoid distance is cm).
For both models, the inclination of the jet to the line of sight is assumed to be , and the plasmoid is assumed to be spherical (radius cm) with a bulk motion characterized by a Lorentz factor of (). The population of electrons is modeled by a broken-power-law spectral distribution, with spectral indices , , , , and an energy break of . So that, for , we assumed that
| (1) |
The spectral indices and the energy break of the electron distribution are the best-fit values for the AGILE-GRID spectral shape. The distribution of electrons/positrons is assumed to be isotropic in the plasmoid rest frame (the jet comoving frame). We adopted the Klein-Nishina formula to describe the Compton scattering of soft photons by a cloud of mildly relativistic leptons (Aharonian & Atoyan, 1981).
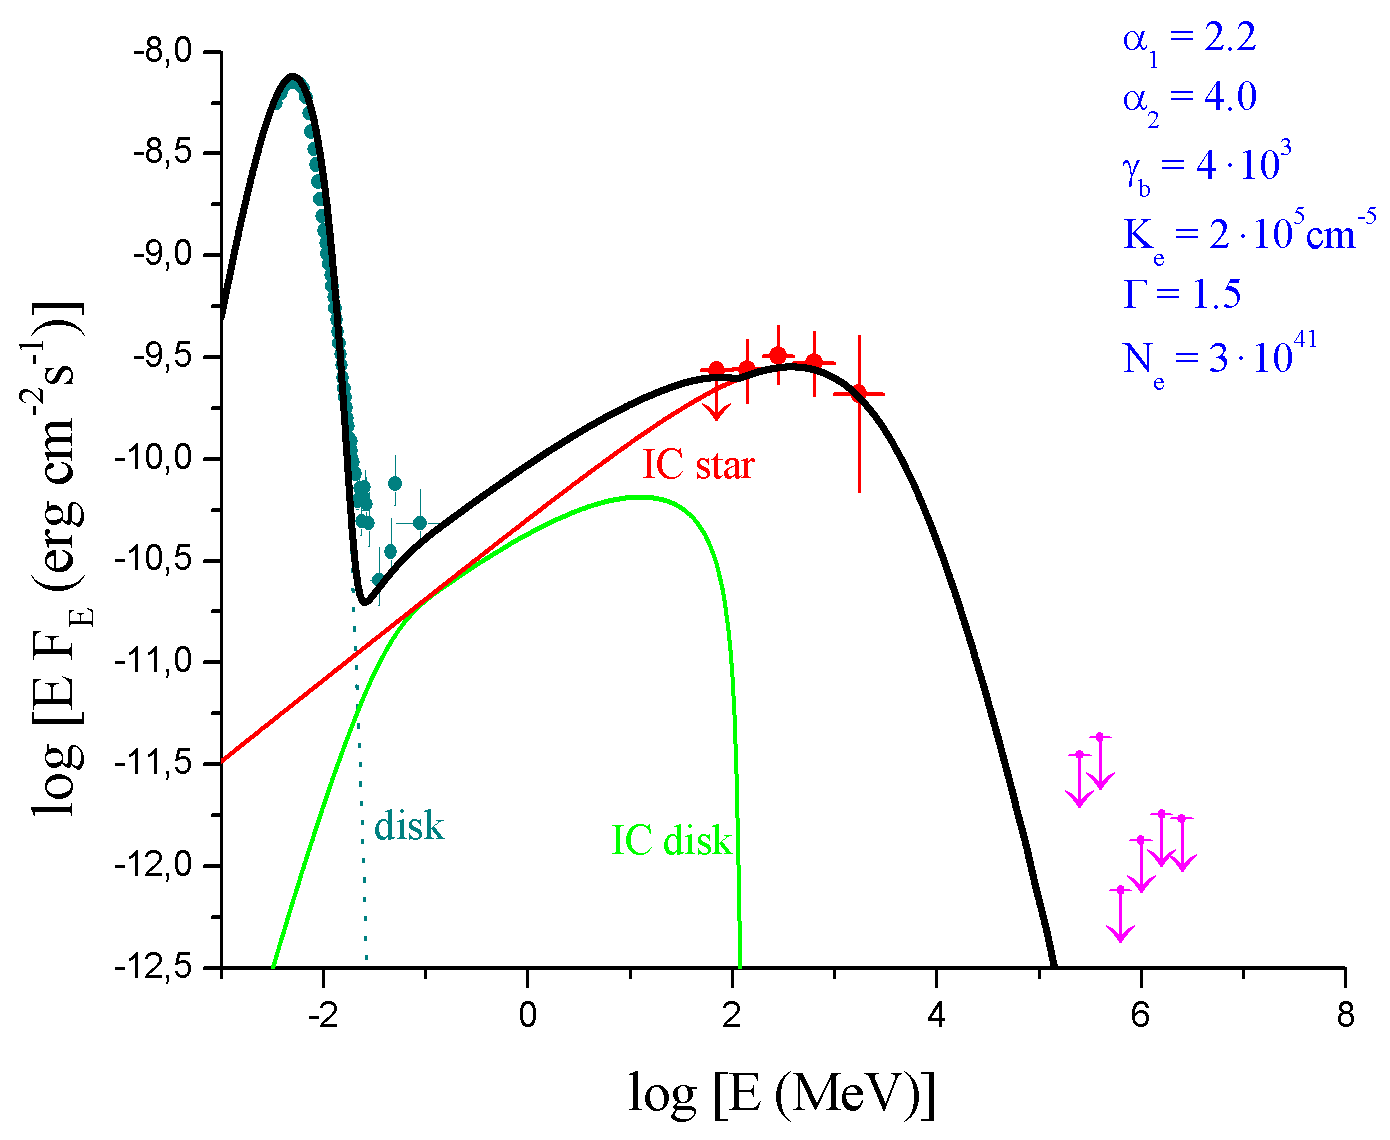
In the leptonic model “A”, the distance from the star to the plasmoid location is assumed to be cm (), i.e., the plasmoid in the jet is very close both to the compact object and the accretion disk. The distance between the plasmoid center and the compact object is cm, i.e., . The results of this modeling are presented in Figure 2.
We took into account the absorption (for pair production) of the IC -ray photons by the X-ray photons from the accretion disk. We assumed that the distribution of the disk photons is fully isotropized by the stellar wind in the observer frame. This implies that the -ray photosphere (i.e., where ) has a radius of cm (Cerutti et al., 2011). With these assumptions, the lowest part of the plasmoid is within the -ray photosphere666Assuming that the photosphere radius is equal to the plasmoid radius, i.e., cm, the fraction of the plasmoid volume inside the -ray photosphere is 32%.. The spectral component related to the IC scatterings of the disk photons (green curve) is actually produced in this region, very close to the disk, where the X-ray photon density as well as the optical depth is high. Since , this component displays a sharp cut-off energy at 100 MeV (i.e., the threshold for production, given the characteristic energies of the disk photons). On the other hand, the spectral component related to the IC scatterings of the stellar wind photons (red curve) does not show any cut-off energy, because it is mainly produced in the farthest part of the plasmoid (outside the -ray photosphere), where the absorption by the X-ray disk photons is negligible. Thus, we deduced that in our geometry the plasmoid volume outside the -ray photosphere (distances cm from the compact object) emits the bulk of the -ray emission above 100 MeV via IC processes acting on stellar photons. Conversely, we found that the innermost part of the jet (distances cm from the compact object), could contribute significantly to the hard X-rays at 100 keV (see Figure 2).
In model “A”, we found that the resulting lepton injection rate is and the corresponding jet kinetic luminosity for the leptons () is .
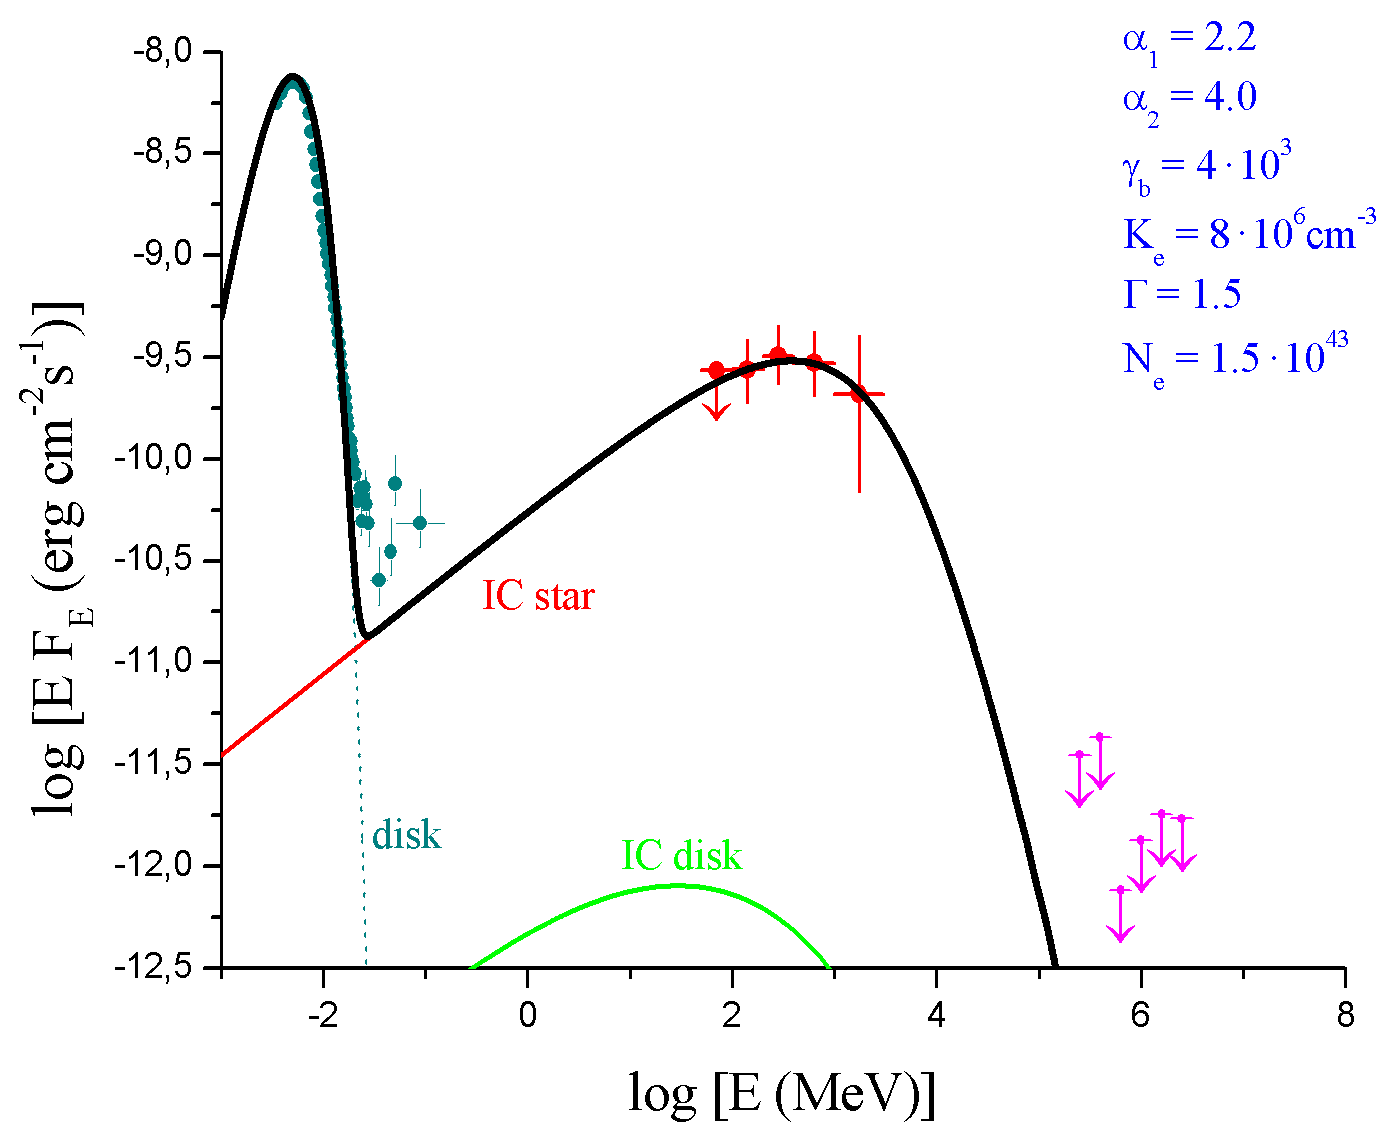
In the leptonic model “B”, the distance from the star to the plasmoid is assumed to be cm (), i.e., the plasmoid in the jet is far away from the compact object and the accretion disk. The distance between the plasmoid center and the compact object is cm, i.e., . We assumed that the disk photons enter the plasmoid mainly from behind. The results of this modeling are shown in Figure 3. In this model, the spectral component related to the IC scatterings of disk photons (green curve) is negligible compared to the IC component of soft photons from the star (red curve).
We note that the “IC disk” component does not show any cut-off energy related to the absorption by X-ray photons, because the IC -rays are produced well outside the -ray photosphere (at distances cm).
In model “B”, we found that the resulting lepton injection rate is and the jet corresponding kinetic luminosity for the leptons is .
III.2 A hadronic scenario
We also considered a “hadronic scenario” for -ray production from Cygnus X-3 based on the same formalism adopted by Romero et al. (2003). In this case, the compact source is assumed to eject a flux of mildly relativistic hadrons (mostly protons) at the base of the jet. These protons are first accelerated near the compact object and then propagate along the jet interacting with the gaseous surroundings provided by the WR companion mass-outflow. The resulting proton-proton () collisions can copiously produce pions and -rays resulting from neutral pion decays.
The proton distribution in the jet is assumed to be isotropic in the jet comoving frame, with an energy spectrum described by a power law with a high energy cut-off (for )
| (2) |
with , , and . The spectral index of the distribution is the best-fit value for the AGILE-GRID spectral shape. We set the energy cut-off value at so that the total SED is consistent with the spectral constraints of the MAGIC upper limits.
The ejected protons interact with the hadronic matter of the WR strong wind. The inelastic hadronic scatterings produce neutral pions that subsequently decay into -rays. We adopted the same formula for the cross section of inelastic interaction reported by Kelner et al. (2006). We assumed that the injected protons in the jet interact with the gas of the wind along a cylindrical column of matter with a radius cm and a height of cm. In analogy with the leptonic models, we assumed for the jet a bulk Lorentz factor of , and an inclination to the line of sight of . To quantify the density of matter in the WR wind, we assumed that the companion star has a mass-loss rate of and the speed of the wind is (Szostek & Zdziarski , 2008). By integrating the density of matter in this cylinder expressed in terms of the number density of protons (, where is the distance from the star), we find that the total number of protons from the wind in this column is .
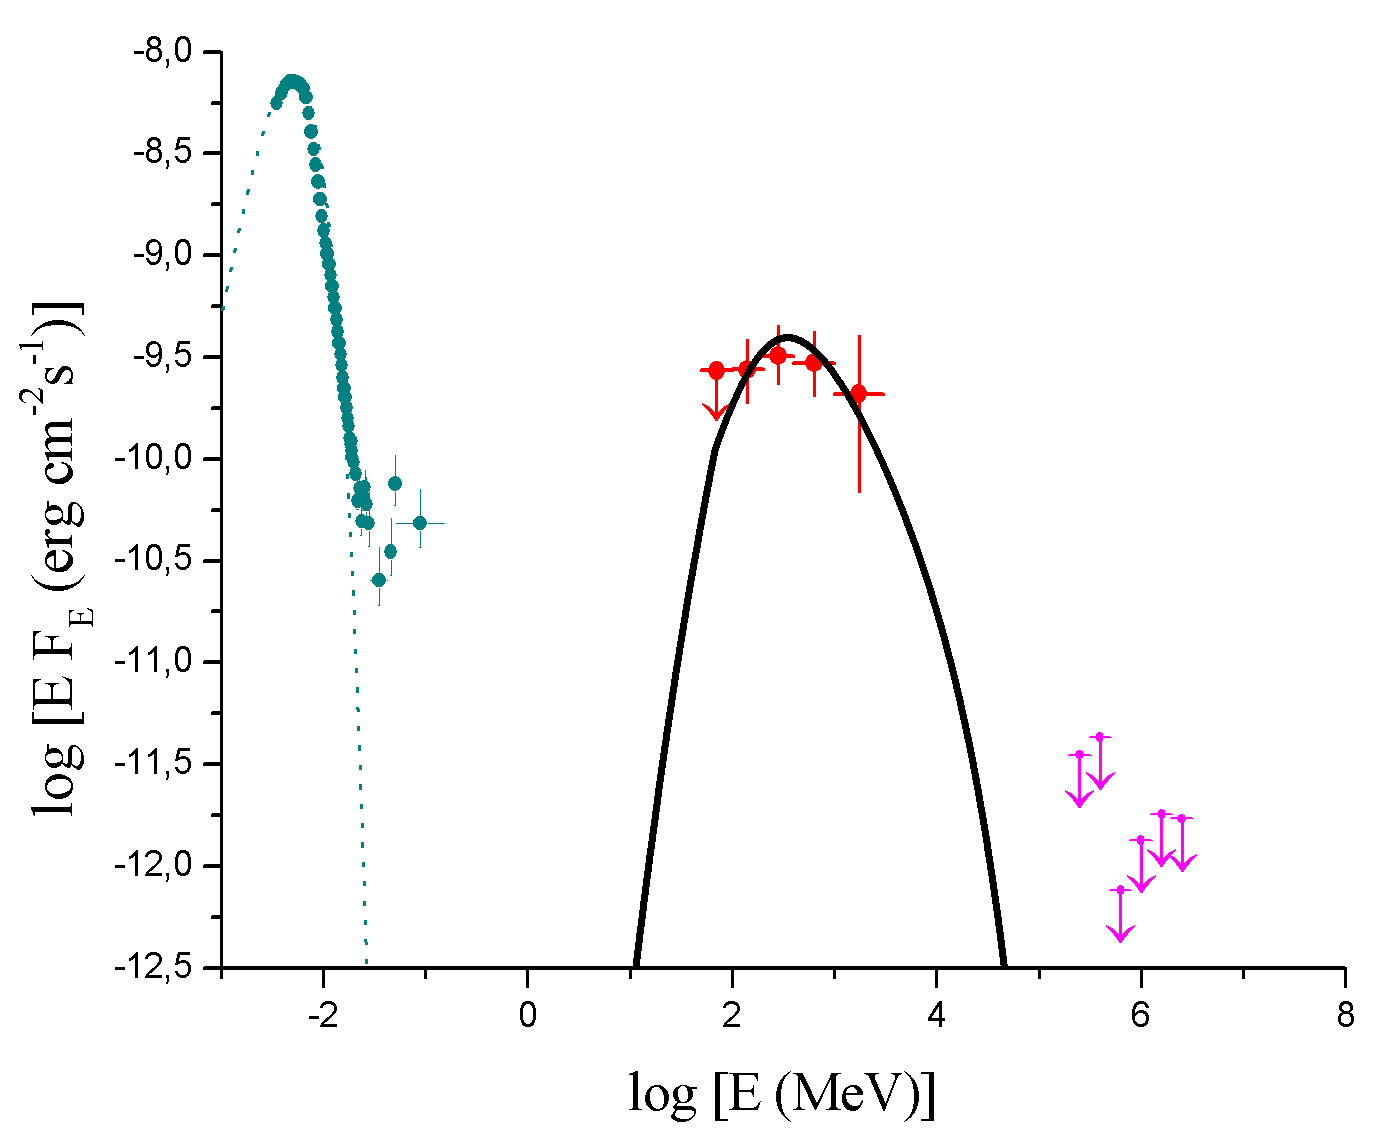
The result of our best-fit hadronic model for Cygnus X-3 is reported in Figure 4. In this case, we found a resulting proton injection rate of protons and the corresponding jet kinetic luminosity for the hadrons () is . This value is consistent with the average bolometric luminosity of the hypersoft state, (Koljonen et al., 2010) and it is lower than the Eddington accretion limit for the system ( , assuming that the compact object is a black hole with a mass of ).
IV Conclusions
We found that the -ray spectrum of Cygnus X-3 detected by the AGILE-GRID is significantly harder than the time-averaged spectrum obtained by Fermi-LAT for the “-ray active periods” of the microquasar, lasting 4 months (see Figure 1). Although both the AGILE main -ray events and the Fermi -ray active periods are both likely related to the presence of an active jet, the spectral difference may imply that there was a fast hardening of the spectrum during the peak -ray events, lasting 1-2 days.
We have demonstrated that both a leptonic model – based on inverse Compton emission from a relativistic plasmoid injected into the jet – and a hadronic model – based on -decays – might account for the -ray emission observed by the AGILE-GRID. Both of these models require the introduction of a new component (“IC bump” or “-bump”) into the SED of the system. In both the leptonic and hadronic pictures, the inclination of the jet to the line of sight is assumed to be .
A leptonic scenario seems to be more likely than a hadronic one: the -ray modulation, the spectral link between hard X-ray and -ray spectra, and the temporal link between -ray events and radio flares could be interpreted in a natural way by assuming that the electrons are the main emitters. According to our results, the innermost part of the jet (distances cm from the compact object) could provide a strong contribution to the hard X-rays at 100 keV during the -ray emitting interval, while the farthest part (distances between cm and cm from the compact object) produces the bulk of the -ray emission above 100 MeV.
In the context of a hadronic scenario, we found that a simply hadronic model can account for the -ray spectrum detected by the AGILE-GRID, by assuming a reasonable proton injection rate in the jet. Our model, with the assumption of a standard WR wind, would require a jet kinetic power that is lower than the Eddington accretion limit for a black hole with a mass of . Thus, a hadronic picture is physically reasonable and not energetically less likely than a leptonic one. Hadronic mechanisms, besides emitting strong -ray radiation via -decay, would produce an intense flux of high-energy neutrinos, emerging from the decay of secondary charged mesons produced in collisions. Hence, a firm simultaneous detection of strong neutrino flux and -ray activity from Cygnus X-3 would represent the signature of a dominant hadronic mechanism in the relativistic jet. At present, there is no strong evidence that one of these hypotheses can be excluded, and it remains an open question whether the dominant process for -ray emission in microquasars is either hadronic or leptonic (Mirabel, 2012).
References
- (1)
- Abdo et al. (2009) Abdo, A. A., et al. 2009, Science, 326, 1512
- Aharonian & Atoyan (1981) Aharonian, F. A., & Atoyan, A. M. 1981, Ap&SS, 79, 321
- Aleksić et al. (2010) Aleksić, J., et al. 2010, ApJ, 721, 843
- Barbiellini et al. (2002) Barbiellini, G., et al. 2002, NIMPA, 490, 146
- Becklin et al. (1973) Becklin, E. E., et al. 1973, Nature, 245, 302
- Bulgarelli et al. (2012a) Bulgarelli, A., et al. 2012a, A&A, 538, A63
- Bulgarelli et al. (2012b) Bulgarelli, A., et al. 2012b, A&A, 540, A79
- Cerutti et al. (2011) Cerutti, B., et al. 2011, A&A, 529, A120
- Chen, Piano et al. (2011) Chen, A. W., Piano, G., et al. 2011, A&A, 525, A33
- Corbel et al. (2012) Corbel, S., et al. 2012, MNRAS, 421, 2947
- Dubus et al. (2010) Dubus, G., et al. 2010, MNRAS, 404, L55
- Feroci et al. (2007) Feroci, M., et al. 2007, NIMPA, 581, 728
- Hjalmarsdotter et al. (2009) Hjalmarsdotter, L., et al. 2009, MNRAS, 392, 251
- Kelner et al. (2006) Kelner, S. R., et al. 2006, Phys. Rev. D., 74, 034018
- Koljonen et al. (2010) Koljonen, K. I. I., et al. 2010, MNRAS, 406, 307
- Labanti et al. (2006) Labanti, C., et al. 2006, Proc. SPIE, 6266
- Ling et al. (2009) Ling, Z., et al. 2009, ApJ, 695, 1111
- McCollough et al. (1999) McCollough, M. L., et al. 1999, ApJ, 517, 951
- Mioduszewski et al. (2001) Mioduszewski, A. J., et al. 2001, ApJ, 553, 766
- Mirabel (2012) Mirabel, I. F. 2012, Science, 335, 175
- Parsignault et al. (1972) Parsignault, D. R., et al. 1972, Nature, 239, 123
- Perotti et al. (2006) Perotti, F., et al. 2006, NIMPA, 556, 228
- Piano et al. (2011) Piano, G., et al. 2011, arXiv:1110.6043
- Piano et al. (2012) Piano, G., et al. 2012, A&A, 545, id.A110
- Prest et al. (2003) Prest, M., et al. 2003, NIMPA, 501, 280
- Romero et al. (2003) Romero, G. E., et al. 2003, A&A, 410, L1
- Romero et al. (2005) Romero, G. E., et al. 2005, ApJ, 632, 1093
- Szostek & Zdziarski (2008) Szostek A., Zdziarski A. A., 2008, MNRAS, 386, 593S
- Szostek et al. (2008) Szostek, A., et al. 2008, MNRAS, 388, 1001
- Tavani et al. (2009a) Tavani, M., et al. 2009a, Nature, 462, 620
- Tavani et al. (2009b) Tavani, M., et al. 2009b, A&A, 502, 995
- Tudose et al. (2010) Tudose, V., et al. 2010, MNRAS, 401, 890
- van Kerkwijk et al. (1992) van Kerkwijk, M. H., et al. 1992, Nature, 355, 703
- Vilhu et al. (2009) Vilhu, O.; et al. 2009, A&A, 501, 679
- Zdziarski et al. (2012) Zdziarski, A. A., et al. 2012, MNRAS, 421, 2956