High sensitivity optomechanical reference accelerometer over 10 kHz
Abstract
We present an optically-detected mechanical accelerometer that achieves a sensitivity of 100 over a bandwidth of 10 kHz and is traceable. We have incorporated a Fabry-Pérot fiber-optic micro-cavity that is currently capable of measuring the test-mass displacement with sensitivities of , and whose length determination enables traceability to the International System of Units (SI). The compact size and high -product achieved combined with the high sensitivity and simplicity of the implemented optical detection scheme highlight our device and this category of accelerometers, outlining a path for high sensitivity reference acceleration measurements and observations in seismology and gravimetry.
The reflection spectrum of an optical cavity is exquisitely sensitive to motion-driven frequency changes which, when combined with mechanical oscillators, can yield accelerometers of outstanding observation resolution and bandwidth. Typically, acceleration is obtained from a direct displacement measurement, and it is in the sensitivity of this observation where the fundamental compromise lies of reaching a particular acceleration resolution over a certain bandwidth : . The higher the sensitivity and the larger the bandwidth needed in acceleration sensing, the more challenging will be the required displacement resolution. Mechanical properties of the oscillator such as the stiffness (mass and resonance frequency ) and quality factor also play an important role in the sensing limit and transduction of displacement measurement to acceleration, as is explained below. Particularly, for high performance acceleration sensing at room temperature, a combined product of large oscillator mass and high quality factor kg will be needed to achieve resolutions at sub- () over several kHz.
In experimental gravitational physics, remarkably high acceleration resolutions at levels of have been demonstrated by torsion balances over extremely narrow bandwidths below 10 mHz, which corresponds to a displacement resolution of approximately 10 BIBREF1 ; BIBREF2 . In geodesy and geophysics, superconducting gravimeters reach acceleration resolutions of the order of over bandwidths below 1 Hz at displacement resolutions of tens to hundreds of BIBREF3 ; BIBREF4 . In contrast, acceleration measurements over wider bandwidths of 10-30 kHz have been realized, however, at tens of levels, translating to a sensitivity in displacement measurement of a few BIBREF5 . Traditional applications require either high acceleration resolution, such as in gravimetry or seismology well below 100 Hz, or large bandwidths, as for characterizing fast mechanical dynamics and piezo-electric devices, but typically not both. Yet extremely high resolution maintained over large bandwidths of tens of kHz are of interest in applications such as inertial navigation of fast moving objectsBIBREF5a .
Present state-of-the-art accelerometer calibrations employ carefully designed and instrumented shaker tables that move with prescribed accelerations that are measured using laser interferometry and currently reach levels of BIBREF5b and only at discrete frequency points. The prescribed motion realizes an acceleration that is used to calibrate reference accelerometers affixed to the tables. The reference accelerometers may then be used to calibrate other accelerometers via a back-to-back comparison technique executed using shaker tables, each optimized for specific frequency rangesBIBREF5c ; BIBREF5d . Reference accelerometers are mostly used by primary calibrations laboratories in a variety of heavy manufacturing industries, including aerospace and automotive, to calibrate instruments subsequently used in the field.
Here we present an optomechanical reference device which is directly traceable to the International System of Units (SI) for absolute acceleration sensing that combines both wide bandwidth and exquisite resolution at room temperature, which we have demonstrated to unprecedented sensitivities better than 100 over a measurement bandwidth larger than 10 kHz, between (1.5-12 kHz). It consists of a compact ( mm), high- ( kg) fused-silica oscillator that utilizes fiber-optic micro-mirror cavities, for traceable detection of its test-mass motionsBIBREF6 ; BIBREF6a . Since it does not require an external shaker to calibrate its sensitivity due to the built-in laser interferometer as traceable reference, this device provides substantial improvement over conventional systems in accelerometry standards and calibrations.
Fundamentally, acceleration resolution is limited by thermal fluctuations of the test-mass, which for a simple harmonic oscillator at high temperature is given by,BIBREF7
| (1) |
where is the Boltzmann’s constant, is temperature, is the natural frequency of the harmonic oscillator, is the oscillator mass, and is the mechanical quality factor. This shows that high-resolution (low ) and wide-bandwidth (large ) acceleration sensing at room temperature, requires a large product, requiring both large mass and high mechanical quality factor. Acceleration and displacement are related by the following transfer functionBIBREF8 ; BIBREF9 ,
| (2) |
where is the relative displacement given an input acceleration at an angular frequency .
From Equation 2, -resolution over a 10 kHz-bandwidth requires displacement detection sensitivities at levels of . Optical detection schemes, such as Fabry-Pérot interferometry, offer this type of resolution, with the added benefit of SI wavelength traceability for absolute displacement sensing. Thus, if the test-mass motion is measured in terms of an optical cavity referenced to a physical standard such as an atomic transition, according to Equation 2, the only requirement to convert to acceleration is an accurate enough measurement of and . Current wavelength and frequency calibrations reach relative accuracies of and respectively.
Conventional systems are not able to accurately measure near the mechanical resonance due to the complex system identification requiredBIBREF10 ; BIBREF11 . Therefore, sensitivity enhancements are typically achieved by lowering the sensor’s natural frequency and limiting their detection bandwidth significantly below the mechanical resonance (typically ). Due to the accurate and straightforward system identification capabilities presented in Equation 2, our optomechanical reference accelerometer provides traceable measurements at very high sensitivities throughout the entire measurement bandwidth about and even beyond the mechanical resonance, where it reaches the thermal limit over a bandwidth of approximately 1 kHz.
The device we present here combines a monolithic fused-silica oscillator and a fiber-optic micro-cavity into an absolute reference accelerometer, capable of reaching a resolution below 100 over 10 kHz. The direct link between the acceleration sensing and the SI-traceable laser wavelength provides capabilities for absolute measurements, also around and above the mechanical resonance. This is possible because the displacement-to-acceleration transfer function (Equation 2) depends only on two parameters, and , which are independently measured via a ringdown technique, providing a complete system identification. The mechanical fused-silica oscillator is shown in Figure 1.
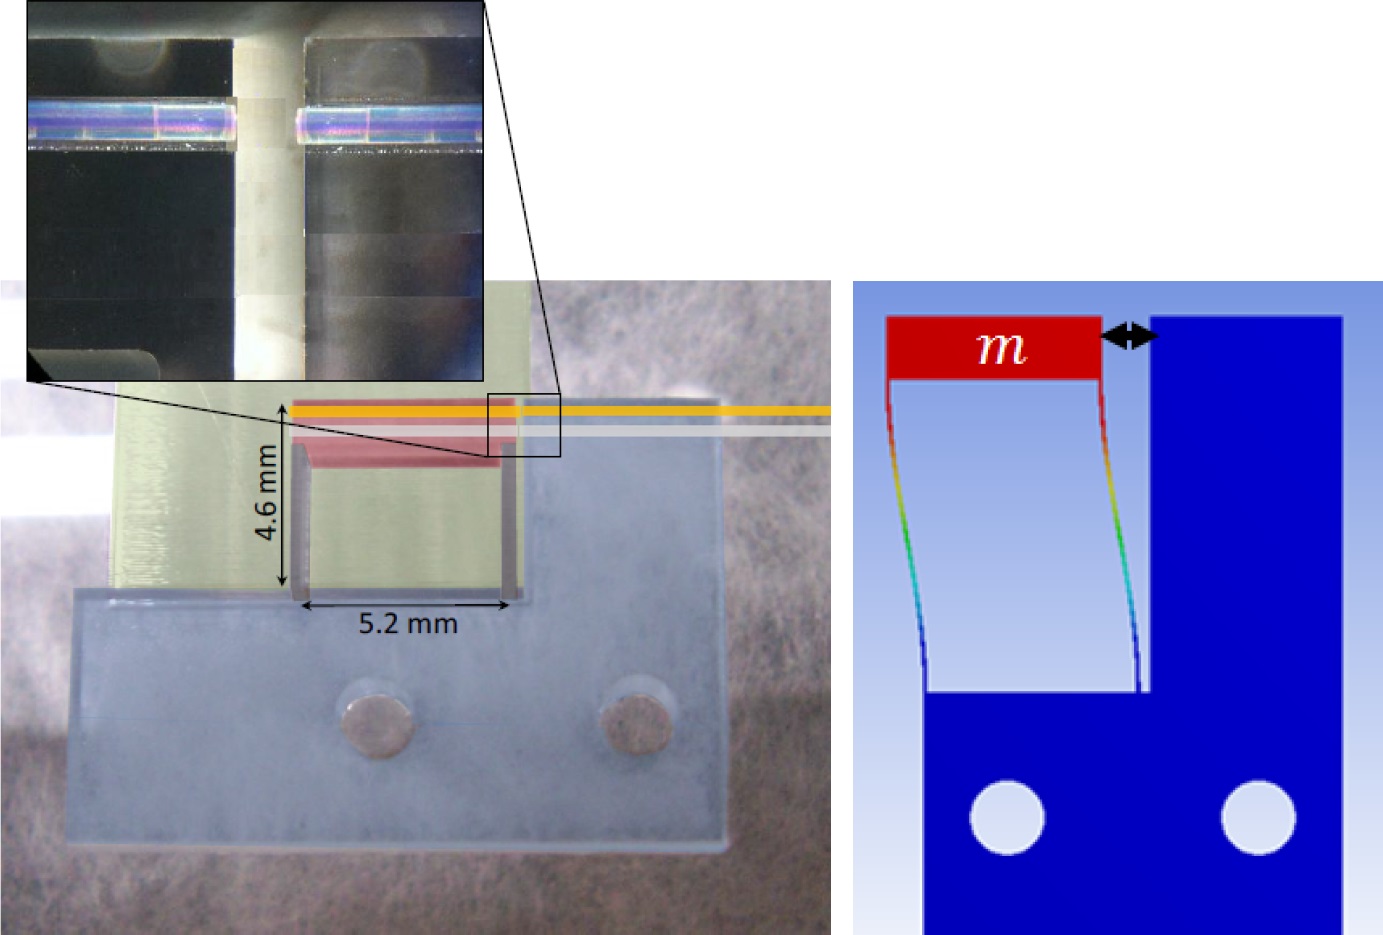
This material was chosen for its compatibility with fiber optics and its inherent low loss characteristics (BIBREF13 or at 10 kHz). The mechanical oscillator was laser-assist micro-machined fromBIBREF14 a 2 mm thick fused-silica wafer to produce a monolithic device. The base of the oscillator was frit-bonded to a fused-silica substrate and the moving portion was suspended over a laser-machined relief. The mechanical quality factor was measured to be , applying a ringdown technique in vacuum. To this end, we used a piezo-shaker to excite the oscillator at its resonance frequency and measured the exponential decay response. The resonance peak was determined by spectral analysis and then honed in by a high resolution function generator driving the piezo-shaker. After discontinuation of shaking, the AC voltage output of the cavity photoreceiver was recorded by a digital voltmeter which provided the envelope of the ring down directly. The quality factor was determined by an exponential fit to the envelope and compared to the full width at half maximum (FWHM) with good agreement. This technique is significantly faster than a high resolution spectrum allowing us to minimize the effect of resonance frequency drifts and enabling multiple trials. The moderate quality factor measured can be attributed to losses in the frit-bonding material. The mass of the oscillator is 25 mg, and kg, yielding a thermal noise floor of at room temperature.
In the optical detection scheme, we utilized a telecom laser at a wavelength of nm with moderate power of approximately 1 mW. A plane-concave fiber-based micro-mirror Fabry-Pérot cavityBIBREF14a ; BIBREF15 was built to operate in reflection as the optical sensor. The mechanical oscillator ground platform and the moving mass were equipped with collinear V-grooves as alignment canals for the fiber-based mirrors. The flat input mirror consists of a perpendicularly cleaved, dielectrically coated fiber (99.7%). The concave cavity end mirror consists of a CO2 laser ablated fiber tip with a high reflectivity dielectric coating (8ppm)BIBREF15 . The resulting cavity characteristics were measured to be: finesse , optical quality factor , and visibility . The optical output of the Fabry-Pérot cavity in reflection is a function of the laser wavelength , yielding a signal at the photoreceiver given by,
| (3) |
where is the amplitude of the signal and is the optical cavity length.
Several approaches can be implemented to conduct the optical length measurement. Typically, for field and long term operation systems it is necessary to actuate the laser frequency in closed loop in order to remain at the high sensitivity operation point around the cavity resonanceBIBREF15a . Heterodyne interferometry could also be implemented to measure the test-mass dynamics which would emerge as phase changes of the beat note that can be measured against a frequency referenceBIBREF15b . However, not all measurements require long-term stability and, particularly in our case, certain reference acceleration measurements, inter-device comparisons (as shown in Figure 5), and numerous calibrations can rely on the sufficient short-term stability provided by contemporary research laser systems, together with the SI-traceability capabilities offered by our reference acceleration measurement approach.
Well-known modulation and AC detection schemes are typically used to avoid susceptibility to effects like laser power fluctuations which, however, have been measured to be negligible in our setup, as shown in Figure 3 (magenta trace–laser intensity noise). For these reasons, and striving for simplicity towards optomechanical reference acceleration standards, we have chosen a DC cavity readout to best accommodate the short length and moderate finesse properties of our optical sensor, for which a Pound-Drever-HallBIBREF16 scheme is neither practical nor necessary. In this readout scheme, the highest sensitivity of the cavity can be achieved by tuning the laser wavelength to the points where , reaches its maximum value. Given the wide tunability range of our laser (Agilent 81600B: nm) the cavity length is directly measured by sweeping the laser wavelength over several nm and scanning the cavity resonances. The frequency separation between two adjacent resonance peaks is known as the Free Spectral Range (FSR) and its direct measurement yields the optical cavity length as,
| (4) |
which amounts to 172 m. Moreover, the remaining parameters of Equation 3, the finesse , signal amplitude and visibility can also be measured from this data. In itself, this FSR determination is a direct measurement of Equation 3. The broadband displacement/acceleration measurement is conducted by measuring the laser intensity fluctuations returning from the cavity with a spectrum analyzer, whose master clock can also be referenced and traced to a frequency standard. Cavity length fluctuations translate to laser wavelength fluctuations in a resonant cavity as
| (5) |
The effect of cavity length fluctuations d on dynamic changes of the FSR are negligible given that , being approximately 12 orders of magnitude smaller. By combining Equations 2, 3 and 5, it yields that cavity length changes driven by an acceleration can be measured via voltage fluctuations at the photoreceiver output as,
| (6) |
with
| (7) |
where the operating laser wavelength for maximum sensitivity is an SI-traceable quantity, and the function can be either simultaneously measured with the FSR measurement, or analytically obtained upon measurement of the required parameters: , , , , and . The total measured acceleration consists of the following terms: a) the Brownian limited acceleration (see Equation 1), b) equivalent acceleration of real test-mass dynamics, and c) apparent (absent of dynamics) acceleration arising from excess noise in the detection system. Equation 6 demonstrates a straightforward link between the laser wavelength and acceleration-induced voltage fluctuations measured at the photoreceiver. All parameters (, , , , ) are directly measured and are stable. This inherent relation between acceleration, the laser wavelength, and its explicit SI-traceability outlines the capabilities of absolute reference acceleration measurements of our device.
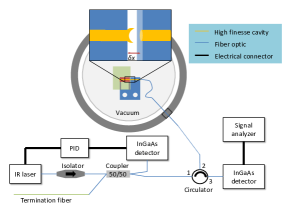
Our laboratory is located three floors below ground and the substrate was placed on a passive vibration isolation platform inside a vacuum chamber. This provides good mechanical isolation for acceleration noise measurements. The fiber optic cables were fed into the vacuum chamber through deformable capillaries that are clamped circumferentially around the cables for an air-tight seal. We used fusion splices to connect the input fiber to the fiber interferometer and laser sources and create a continuous strand of cable. A schematic of the test setup is shown in Figure 2.
Sensitivity measurements of displacement are shown in Figure 3, reaching a resolution of .
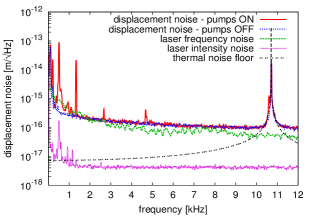
The peaks shown in the red trace originate from the running vacuum pumps, and vanish when these are turned off while still maintaining a comparable vacuum level below mbar, as shown by the blue trace. In addition, we independently measured the laser intensity (magenta trace) and frequency (green trace) noise in order to identify the limiting noise sources of our system. The latter was measured via a mismatched armlength Mach-Zehnder fiber interferometer, using two 50/50 fiber couplers, and a 1 km fiber spool in one arm. This fiber interferometer was assembled for the sole purpose of measuring the laser frequency noise and was operated outside the vacuum chamber, making it more susceptible to temperature changes and disturbances in the fibers. These environmental effects can account for the slightly higher noise below 2 kHz. Given the rather high finesse accomplished on this type of cavity, we were able to suppress the laser intensity noise to a non-limiting level. Laser frequency noise, on the other hand, is clearly setting the noise floor. Figure 4 shows the linear spectral density of the equivalent acceleration measurement. At lower frequencies of 10-100 Hz we reach a comparable resolution to conventional devices at levels, and improving to sub- through 1 kHz. Unprecedented sensitivities below over 10 kHz is achieved above 1.5 kHz, and better than slightly above 9 kHz over approximately 2 kHz.
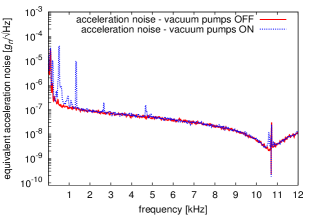
We are also able to exploit the extraordinary sensitivity enhancement provided by the mechanical resonance due to our capability to conduct a complete and accurate system identification over the entire observation bandwidth, allowing us to reach the Brownian acceleration limit around level within 1 kHz about the mechanical resonance frequency (10.7 kHz).
The laser frequency noise sets the noise floor throughout the entire bandwidth. A 10 kHz broadband detection sensitivity at the Brownian limit of requires a laser frequency stability better than throughout the observation bandwidth. Laser frequency control systems capable of reaching these stability levels, have been previously demonstrated at the thermal limitBIBREF17 , but require complex dedicated laboratory instrumentation. In addition, ongoing research in laser physicsBIBREF18 ; BIBREF19 outline the path for promising laser technologies of similar frequency stability that will be available in the near future which, combined with our optomechanical accelerometer, would enable broadband thermally-limited acceleration sensing.
Comparison measurements to a commercial reference accelerometer were conducted as a demonstration test of the acceleration sensing characteristics of our device. We have compared it against a calibrated commercial reference accelerometer, Wilcoxon 731A/P31BIBREF20 , which has a 3 dB-bandwidth of 330 Hz. We utilized a small piezo-driven shaker to inject a controlled acceleration to both devices at 10 Hz. We chose this frequency because, from the only two frequency points (10 Hz and 327 Hz) quoted in the calibration data sheet of the Wilcoxon device, this selected point reports unitary gain. The acceleration measurement was performed on one device at a time, mounted on the shaker. Figure 5 shows the corresponding acceleration measurements of the injected signal.
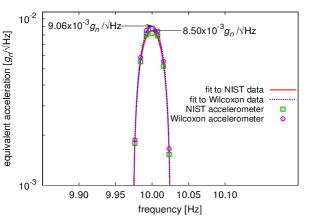
The acceleration peaks measured by both devices come to excellent agreement. The slight discrepancy in amplitude of approximately 6% can be attributed to large dimensional differences between the devices, which are of consideration in the mounting to the shaker table, and the effective acceleration field sensed by each test-mass. The Wilcoxon device has a mass of 670 g and cylindrical dimensions of 6.2 cm in diameter and 5.3 cm in height. Our device has a sensing test-mass of 25 mg, and a total mass that is 1000 times lower (approximately 600 mg) than the Wilcoxon device, and it provides a ten times larger measurement bandwidth.
In conclusion, we have demonstrated a simple and traceable optomechanical reference accelerometer to sensitivities better than over an observation bandwidth of 10 kHz. Our measurements of mechanical quality factor and mechanical resonance frequency demonstrate an product of 1 kg and a Brownian acceleration limit of . We have also developed and incorporated an optical sensor based on a Fabry-Pérot fiber micro-mirror cavity of finesse 1600 that reaches displacement sensitivities of .
Many applications do not require acceleration sensing over such large bandwidths. Design trade-offs to the device concept presented here can be made to better meet the needs of sensitivity and observation bandwidth for other applications. The simplicity, compactness and traceable high-sensitivity performance over a wide bandwidth accompanied by built-in
advanced laser-interferometric detection highlight our accelerometer for a wide variety of applications in optomechanics and quantum-limited light-matter interactions, absolute and reference accelerometry, including seismology, and ground and space-based gravimetry.
We thank J. Harris, N. Flowers-Jacobs, and S. Hoch for facilitating us samples of high reflective laser ablated fiber mirrors. We also thank C. Caves, N. Malalvala, K. Lehnert, G. Shaw and E. Polzik for helpful discussions. This work was supported by the NSF Physics Frontier Center at the JQI and DARPA QuASaR and the ARO under W911NF-11-1-0212.
References
- (1) F. Antonucci, M. Armano, H. Audley, G. Auger, M. Benedetti, P. Binetruy, C. Boatella, J. Bogenstahl, D. Bortoluzzi, P. Bosetti, et al, Class. Quantum Grav. 28, 094002 (2011).
- (2) S. Schlamminger, K.-Y. Choi, T.A. Wagner, J.H. Gundlach, and E.G. Adelberger, Phys.Rev.Lett. 100, 041101 (2008).
- (3) D. Banka and D. Crossley, Geophys.J.Int. 139,87 (1999).
- (4) D. Crossley, J. Hinderer and U. Riccardi, Rep. Prog. Phys. 76, 046101 (2013).
- (5) A.G. Krause, M. Winger, T.D. Blasius, Q. Lin and O. Painter, Nat. Photon. 6, 768 (2012).
- (6) DARPA solicitation BAA-10-90, (2010).
- (7) BF. Payne and M.R. Serbyn, in Proceedings of 14th Transducer Workshop, 1987.
- (8) ISO 16063-11:2003, Methods for the calibration of vibration and shock transducers — Part 11.
- (9) ISO 16063-21:2003, Methods for the calibration of vibration and shock transducers — Part 21.
- (10) D. Rugar, H.J. Mamin, R. Erlandsson, J.E. Stern, and B.D. Terris, Rev. Sci. Instrum. 59, 2337-2340 (1988).
- (11) D. Smith, J.R. Pratt, and L. Howard, Rev. Sci. Instrum. 80, 035105 (2009).
- (12) K. Yasumura, T.D. Stowe, E.M. Chow, T. Pfafman, T.W. Kenny, B.C. Stipe and D. Rugar, J. Microelectromech. S. 9, 117-125 (2000).
- (13) K. McConnell and P. Varoto, Vibration Testing: Theory and Practice (Wiley-Interscience, 2008).
- (14) V. Braginsky, F. Khalili, K. Thorne, Quantum Measurement (Cambridge University Press, 1992).
- (15) A. Link, and H.-J. Martens, Measurement 35, 191 (2004).
- (16) T. Bruns, A. Link, F. Schmähling, H. Nicklich and C. Elster, in Proceedings XIX IMEKO World Congress, 2009.
- (17) R. Tabrizian, M. Rais-Zadeh and F. Ayazi, in IEEE Proceedings of 15th Int. Conf. Solid-State Sens., Actuators Microsyst. (TRANSDUCERS), Denver, CO, 2009.
- (18) P. Bado, A.A. Said, M. Dugan, M. and Y. Bellouard, in SPIE Proceedings of Topical Meeting on Commercial and Biomedical Applications of Ultrafast Lasers VI, 2006.
- (19) N.E. Flowers-Jacobs, S.W. Hoch, J.C. Sankey, A. Kashkanova, A.M. Jayich, C. Deutsch, J. Reichel, J.G.E. Harris, Appl. Phys. Lett. 101, 221109 (2012).
- (20) D. Hunger, T. Steinmetz, Y. Colombe, C. Deutsch, T.W. Hänsch and J. Reichel, J. Phys. 12, 065038(23pp) (2010).
- (21) J. Lawall, J. Opt. Soc. Am. A 22, 2786-2798 (2005).
- (22) J. Lawall, E. Kessler, Rev. Sci. Instrum. 71, 2669 (2000).
- (23) R.W.P. Drever, J.L. Hall, F.V. Kowalski, J. Hough, G.M. Ford, A.J. Munley, and H. Ward, Appl.Phys.B. 31, 97 (1983).
- (24) K. Numata, A. Kemery and J. Camp, Phys. Rev. Lett. 93, 250602 (2004).
- (25) S.B. Papp, P. Del’Haye, and S.A. Diddams, Phys. Rev. X 3, 031003 (2013).
- (26) H. Lee, M.G. Suh, T. Chen, J. Li, S.A. Diddams and K.J. Vahala, Nat. Comm. 4, 2468 (2013).
- (27) This paper identifies equipment for completeness. This is not an endorsement by the National Institute of Standards and Technology.