The Impact of Starbursts on the Circumgalactic Medium
Abstract
We present a study exploring the impact of a starburst on the properties of the surrounding circum-galactic medium(CGM): gas located beyond the galaxy’s stellar body and extending out to the virial radius(200 kpc). We obtained ultraviolet spectroscopic data from the Cosmic Origin Spectrograph(COS) probing the CGM of 20 low-redshift foreground galaxies using background QSOs. Our sample consists of starburst and control galaxies. The latter comprises normal star-forming and passive galaxies with similar stellar masses and impact parameters as the starbursts. We used optical spectra from the Sloan Digital Sky Survey(SDSS) to estimate the properties of the starbursts, inferring average ages of 200 Myrs and burst fractions involving 10% of their stellar mass. The COS data reveal highly ionized gas traced by C IV in 80%(4/5) of the starburst and in 17%(2/12) of the control sample. The two control galaxies with C IV absorbers differed from the four starbursts in showing multiple low-ionization transitions and strong saturated Lyman-alpha lines. They therefore appear to be physically different systems. We show that the C IV absorbers in the starburst CGM represent a significant baryon repository. The high detection rate of this highly ionized material in the starbursts suggests that starburst-driven winds can affect the CGM out to radii as large as 200kpc. This is plausible given the inferred properties of the starbursts and the known properties of starburst-driven winds. This would represent the first direct observational evidence of local starbursts impacting the bulk of their gaseous halos, and as such provides new evidence of the importance of this kind of feedback in the evolution of galaxies.
Subject headings:
galaxies: halos — galaxies: starbursts — galaxies: ISM — quasars: absorption lines1. INTRODUCTION
The evolution of galaxies is regulated by how and when they accrete gas, produce stars and supermassive black holes, and by how different feedback processes may regulate this cycle. Similarly, the evolution of the intergalactic medium (IGM) will be regulated by these same feedback processes which can photoionize, collisionally heat, and chemically enrich the IGM. The interface between the region where star formation has taken place and the IGM is the galaxy halo, or circum-galactic medium (CGM). We take this to be the region extending from the main stellar body of the galaxy outward to the virial radius at a few hundred kpc. It is through the CGM that the two-way communication between galaxies and the IGM occurs.
One of the major ways in which feedback occurs is via outflows of gas driven from strongly star-forming galaxies by the energy and/or momentum injected by massive stars (e.g. Veilleux et al., 2005, and references therein). These outflows are ubiquitous in high redshift galaxies (Shapley et al., 2003; Adelberger et al., 2005; Weiner et al., 2009). At low redshifts the conditions needed to drive these large-scale galactic winds seem to be present only in starburst galaxies (Heckman et al., 1990; Lehnert & Heckman, 1996; Veilleux et al., 2005; Martin, 2005; Rupke et al., 2005, and references therein). However, while less common, these low redshift outflows can be studied in far greater detail than their high-z counterparts.
While it is clear that intensely star-forming galaxies at all redshifts drive outflows, the effect of these outflows on the evolution of galaxies and the IGM has not yet been well-quantified. Are they sufficiently strong to propagate out into the CGM and IGM? In so-doing can they eject baryons from low-mass dark matter halos (dwarf galaxies)? Can they shut down the delivery of gas through the CGM in more massive systems, leading to the cessation of star-formation and the migration of galaxies from the blue star-forming sequence onto the red quiescent sequence? What role do they play in establishing the galactic characteristic stellar mass of M⊙ which separates the low-mass mainly-star-forming and high-mass mainly-quiescent galaxy populations?
Unfortunately, the investigations of outflows in local starbursts cannot directly address these questions because they have been limited to regions in the inner most part of the CGM (corresponding to radii of a few tens-of-kpc or less). Moreover, the outflow speeds that are directly measured in the molecular, atomic, and warm ionized gas are typically comparable to or less than the galaxy escape velocity, so that it is not clear whether this material is truly a wind or a fountain (e.g. Chen et al., 2010; Grimes et al., 2009). The very high specific energies implied by the high temperatures of the X-ray emitting gas suggest that this gas is likely to escape at least from the less massive starbursting galaxies (Grimes et al., 2005), but again these measurements pertain to locations far inside the virial radius.
Direct imaging of the bulk of the CGM to probe the effects of winds is difficult at high-z (but see Steidel et al., 2011), and is impossible with existing facilities at low-redshift. The best available probe of the properties of the CGM comes from QSO absorption-line systems (QALS), which can detect this tenuous material with great sensitivity (albeit along single sight-lines). Various authors have suggested the connection between QALS and starburst driven winds. Zibetti et al. (2007) argued that models of metal-enriched outflows from star-forming/bursting galaxies could explain the origin of strong Mg II absorbers. Bouché et al. (2007) found that 2/3 of their strong Mg II absorbers (with rest-frame equivalent width W) at had starburst galaxies (with SFR=1-20 ) around them. This result was also later confirmed by Nestor et al. (2011) with the discovery of bright, starburst/post starburst galaxies in the field around 2 “ultrastrong” Mg II QALs. Another indication of this connection comes from the study by Ménard et al. (2011), where they found a strong correlation between the equivalent width of the Mg II absorbers and the [OII] emission-line luminosity of the host galaxy. In a slightly different experiment, Steidel et al. (2010) have used more distant galaxies located behind a sample of intensely star-forming galaxies at 2 to 3 to trace outflowing gas in absorption to radii of 100 kpc.
With the installation of the Cosmic Origins Spectrograph (COS; Green et al. (2012)) on the Hubble Space Telescope (HST) it has now become feasible to probe the CGM of low-redshift galaxies via QALS. Most of these transitions lie in the ultraviolet and the superb sensitivity of COS allows us to directly detect and characterize the CGM in a representative samples of low-redshift galaxies that can be studied in detail (e.g. Tumlinson et al., 2011b). In this paper we utilize COS to directly probe the CGM of starburst galaxies and to learn the effect of starburst-driven winds on the circumgalactic gas. To that end, we have selected a small sample of galaxies from the SDSS that have undergone a significant starburst event within the last few year, and we have also selected an appropriate control sample of typical star-forming and quiescent galaxies. For all these galaxies we have obtained ultraviolet (UV) spectroscopic data with the COS, which can directly detect gas in the CGM via absorption lines seen in the spectra of background UV-bright QSOs
Detailed descriptions of our sample selection criterion, the COS observations, and data reduction are presented in Section 2. The results and their implications are discussed in Section 3 and 4. And finally, we summarize our findings and conclude in Section 5. The cosmological parameters used in this study are , , and . Atomic data used throughout our analysis was obtained from the published work by Morton (2003).
2. OBSERVATIONS
2.1. Sample
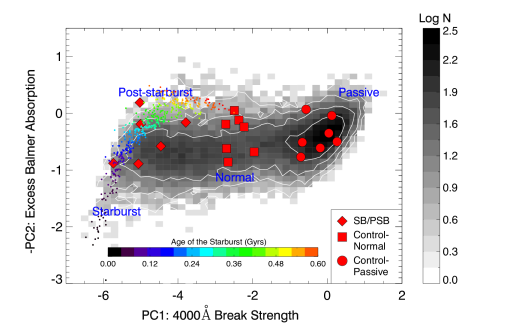
Our sample was selected in a two-phase process. The first step was to identify those galaxies in the SDSS Data Release 7 (DR7) “Main” galaxy sample (Strauss et al., 2002) that are under-going or have recently undergone a strong starburst. To do so we followed the procedure described in Wild et al. (2007). They used a Principal Component Analysis (PCA) approach to improve spectroscopic diagnostics for bursts of star formation for a bulge dominated sample. In this analysis, SDSS spectra from rest-frame 3750-4150 were decomposed in multiple eigenspectra and the resulting principal component amplitudes represent the amount of each eigenspectrum present in the galaxy spectrum. The first principal component (PC1) provides the same information as the traditional Dn(4000) index (Balogh et al., 1999). It is a good proxy for the specific star formation rate of the galaxy, averaged over the past few Gyr. The second principal component (PC2) provides additional information on any excess (or deficit) of Balmer absorption, over that expected for the 4000 Å break strength of the galaxy. This is useful in identifying galaxies with young stellar populations of ages up to 1 Gyr (see also Wild et al., 2010)111PCA catalogs for SDSS DR7 are available for download at http://www-star.st-and.ac.uk/$∼$vw8/downloads/DR7PCA.html .
 |
 |
 |
 |
 |
 |
 |
 |
 |
 |
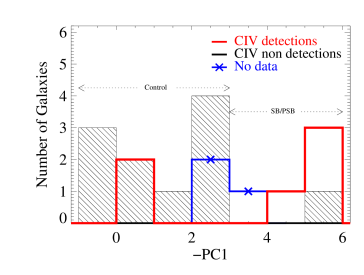
In Figure 1 we show the distribution of the SDSS main galaxy sample in greyscale as well as contours in the PC1 vs. PC2 plane. The locations of the starburst, post-starburst, passive, and typical star-forming galaxy populations are indicated. The colored dots traces out a time sequence for strong starbursts (details described by Wild et al., 2010). These bursts can be fit with a model having an exponentially declining star formation rate with an e-folding time of 200-350 Myr and typical burst mass fractions of 10 to 25% of the stellar mass. To find a sample of recent/on-going starbursts we have then searched the SDSS DR7 Main galaxy sample for galaxies lying along or near this sequence.
The second step in generating our sample was cross-correlating this starburst sample with the Galaxy Evolution Explorer (GALEX) far-ultraviolet (FUV) bright QSO catalog (GR3) to find QSO-starburst pairs. We used the following criteria:
-
1.
The background QSO is brighter than FUV = 19.5 mag or ;
-
2.
Signal-to-noise ratio 8 in the SDSS g-band spectrum of the galaxy;
-
3.
Galaxy stellar mass, M222Stellar mass catalogs, derived from 5 band SDSS photometry by Brinchmann et al. (2004) following the prescription by Kauffmann et al. (2003) and Salim et al. (2007). The catalogs were obtained from http://www.mpa-garching.mpg.de/SDSS/.. We are interested in galaxies in the mass range where the galaxy population transitions from predominantly low-mass star-forming to high-mass quiescent systems (e.g. Kauffmann et al., 2003);
-
4.
Impact parameter to nearest UV bright QSO, kpc. This distance is approximately the virial radius, for galaxies with halo masses, (approximate halo mass for galaxy of stellar mass );
-
5.
The foreground galaxy does not belong to a cluster as defined by the SDSS galaxy cluster catalog (see Miller et al., 2005). We are interested in the CGM in typical “field” galaxies.
 |
 |
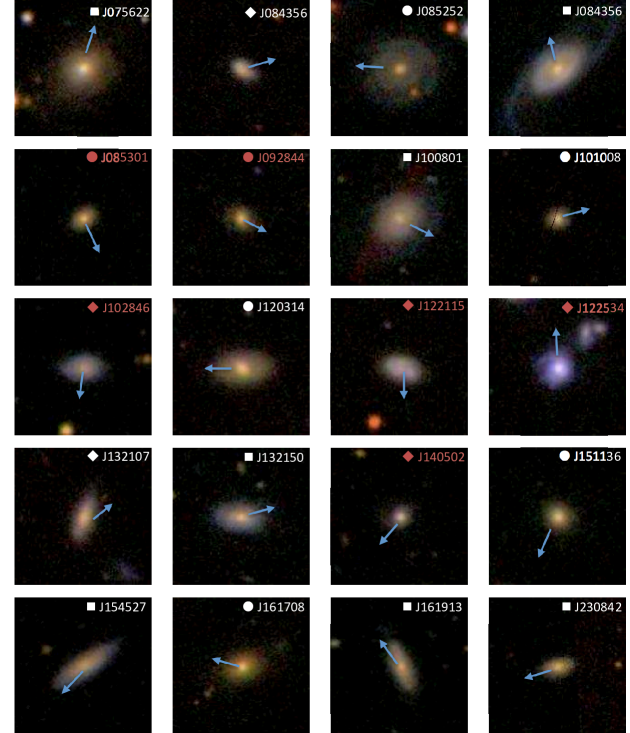
This resulted in six QSO-starburst pairs (hereafter the“starburst sample - SB/PSB”). We then repeated the above selection procedure for non-starbursts or “control” galaxies in SDSS DR7. Since there were many eligible QSO-galaxy pairs, we selected our targets so that we sampled the rest of the PC1 vs. PC2 plane uniformly with galaxies that roughly has similar stellar masses and impact parameters as the starburst sample. For multiple pairs with similar properties, the one with the brightest background QSO in FUV was selected. This resulted in 14 control galaxies with half of them passive (red) galaxies with PC1 -1 and other half consisting of normal star-forming galaxies with PC1 ranging between -3 and -1. The starburst and control samples are overplotted in the PC1 versus PC2 plane in Figure 1, while Figure 2 shows the SDSS multicolor image of the 20 target galaxies from our sample. The target galaxy is at the center of the image and the direction of the QSO is shown with a blue arrow. The galaxy names are labeled in the top right corner and the ones where we have C IV detections are labeled in red. The symbols before the labels refer to the category of galaxies. We use diamonds to identify the SB/PSB sample and circles and squares for the control sample of passive and normal star-forming galaxies respectively.
The properties of the galaxies and QSOs in our sample are summarized in Table 1. The name, position, redshift of the foreground galaxy and the background QSOs are presented in columns 1, 2, 3, 4, 11, 12, 13, and 14 respectively. The impact parameter of the QSO sightline is presented in the last column. The PC1, PC2 and the corresponding class of the foreground galaxy are presented in columns 5-7. Column 8 presents the stellar masses obtained from the MPA-JHU catalog, These masses were estimated using methods described by Brinchmann et al. (2004). The orientations of the sightlines are presented in column 9, which represents the angle of the QSO sightline with respect to the major axis of the galaxy. For example, any sightline along the major axis has , whereas a sightline probing the halo perpendicular to the disk has . The orientation was estimated using SDSS photometric i-band measurements. We considered all galaxies where the ratio of the major to minor axis (deVAB) 0.7 to be face-on, and defined as .
The star formation properties of the galaxies are presented in Table 2. The H fluxes, luminosities, and ionizing photons per second, Q∗ are presented in columns 2, 3, and 4 respectively. These values were derived by applying dust corrections (similar to that used by Wild et al., 2007, for emission lines) to the fluxes from the MPA-JHU catalog333Line fluxes were obtained from the MPA-JHU catalog. and then converting to L() (see Eq.9.5 from Conti et al., 2008). In this paper we wanted to evaluate the energy input to the CGM over the lifetime of the starburst (rather than using the instantaneous value). For this reason we do not measure the star formation rates for the starbursts using H. Instead, for the starburst sample we use the burst mass or burst mass fraction and the burst age to estimate a SFR or specific SFR (respectively) averaged over the over the duration of the burst (column 5). For the control sample we use the SFR and specific SFR from Brinchmann et al. (2004) (column 6). Both these estimates are for the central 3′′ region of the galaxies which is covered by the SDSS fiber.
 |
 |
2.2. Cosmic Origin Spectrograph Observations
The sample was observed with COS using segments B and A of the grating G140L, providing a resolution, km s-1). The data were reduced using the standard COS pipeline and covered the wavelength range between rest-frame Lyman to C IV with the exception of one control galaxy, J085254. Part of its spectrum (up to ) was missed as a result of an error in the setup of the grating. For the remaining 19 targets the data covered the entire range. The wavelength covered includes transitions of various other species such as C II, Si II, Si III, and Si IV. This allows us to probe both neutral gas via low-ionization transitions like Si II and C II as well as highly ionized gas via C IV.
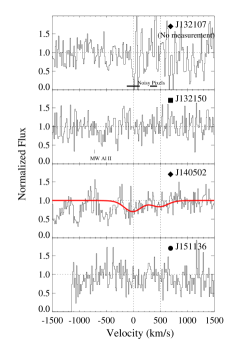
Although we have COS coverage for all the other sightlines, we do miss a few transitions due to intervening absorbers or hot pixels at the position of the expected transition. For example, in the case of J140502, the saturated Lyman transition of the background QSO completely absorbed the QSO flux at the expected position of the Lyman line associated with the foreground galaxy. Similarly, we have three galaxies namely J075622, J161913, and J132107, where the C IV is blended with the Milky Way’s Al III, Lyman of the background QSO, and lies at the position of noisy (hot) pixels respectively. No measurements could be made in these cases. This leaves us with a total of 18 targets with useful data at the expected wavelength of Lyman and 17 targets for C IV.

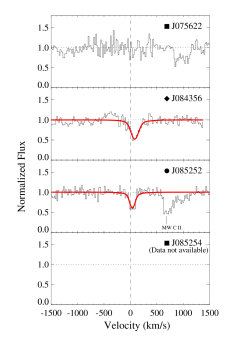
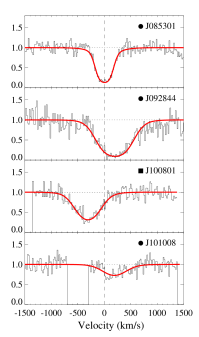
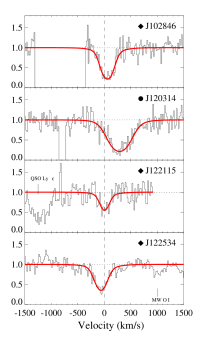
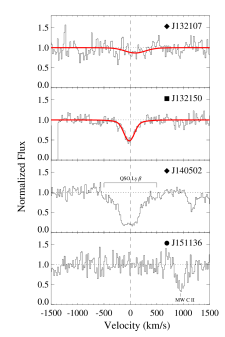
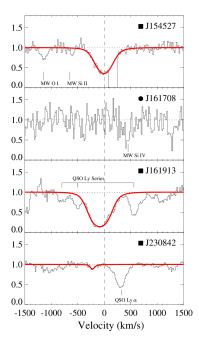
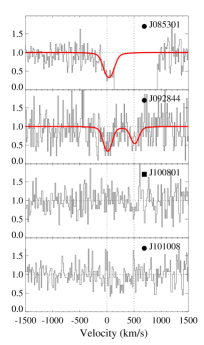
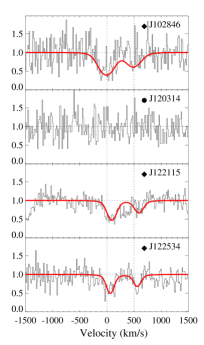
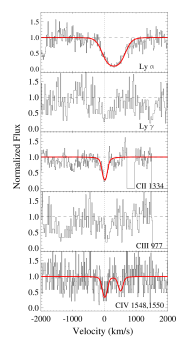
We detected H I Lyman in 15/18 targets. We also have unambiguously detection of C IV in 6/17 systems. Information on the properties of the Lyman and C IV absorbers such as equivalent widths, full width at half max (FWHMs), and column densities are presented in Table 3. Figures 3 and 4 show the Lyman and C IV features at the rest frame of the target galaxy, also marked with a dotted line. The Lyman lines are resolved and unsaturated barring a few cases. Two cases where the Lyman lines are unresolved are marked in Table 3. The C IV doublets are also resolved and are unsaturated, based on the C IV 1548 to 1550 doublet ratio (which ranges from 1.54 to 1.87). The corresponding optical depths in the (weaker) C IV1559 lines are 0.2 to 1. Apart from Lyman and C IV, we do not detect any other major metal transitions except in the cases of J085301 and J092844.
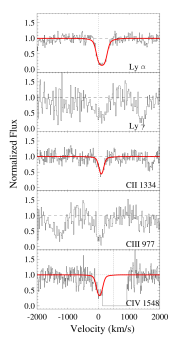
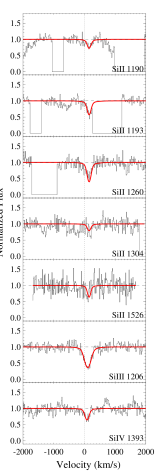
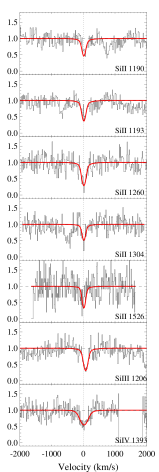
The absorption systems associated with target galaxies J085301 and J092844 showed multiple Lyman series and metal transitions. The absorbers are shown in Figures 5 & 6 and the measurements are presented in Table 4. Besides multiple Lyman series transitions, these absorbing systems show the presence of low-ionization transitions such as Si II and C II as well as higher ionization species as traced by C IV. In J085301, the C IV 1548 transition lies at the edge of the COS spectral grating and the C IV 1550 transition falls in the gap. Hence in this case, the measurements presented in Table 4 were derived from the data with incomplete wavelength coverage and may also suffer from flux inaccuracies sometimes seen near the edge of the gratings.
We fitted Voigt profiles to the data to estimate all the parameters. The associated uncertainties were estimated using the error analysis method published by Sembach & Savage (1992). Errors estimated using this procedure include continuum placement uncertainties, Poisson noise fluctuations, and zero point uncertainties. The continuum was established using absorption free regions of the spectrum within 2000-4000 kms-1 of the absorption feature and subsequently fitted with a Legendre polynomial of order between 1 and 5, similar to the procedure used by Sembach et al. (2004). This ensures that the continuum is described in the neighborhood of the absorption feature precisely and nullifies any slow variations in the shape of the QSO’s spectrum. The measurement also takes into account the appropriate line spread functions (LSFs; Osterman et al. (2011)) for the aperture of the spectrograph from the COS Instrument Handbook (Dixon, 2010). For the non-detections, we present the limiting equivalent width, which represents the 3 error in the equivalent width over 200 km s-1 i.e. 100 to 100 km s-1 in the rest frame of the foreground galaxy. Limiting column densities are estimated from the limiting equivalent widths using the relationship between the two for the linear part of the curve of growth.
We have corrected for inaccuracy in the absolute wavelength calibration of the COS data using Milky Way’s strong ISM transitions. Since we can estimate the offset of these transitions from the expected velocity with reasonable accuracy, we can then use them to correct for any offsets in the COS wavelength calibration. In order to find the intrinsic velocity offset of the ISM transitions, we use H I 21 cm measurements from the Leiden/Argentine/Bonn (LAB) Survey of galactic H I (Kalberla et al., 2005) from the same region of the sky. Although the beam-size of the H I measurements is enormous as compared to the COS aperture, nevertheless we do not expect this would cause a large error as our velocity resolution is of the order km s-1 (full width at half maximum, FWHM). In most cases for the segment A, we found velocity corrections to be of the order of 100 km s-1 . However, in the absence of ISM transitions in the segment B, we could not apply the same corrections and the velocity calibration remains highly uncertain. In cases of multiple Lyman series transitions located in both the segments, the ones in segment B (e.g. Lyman ) show a velocity offset of km s-1 relative to those in segment A (Lyman ).
3. RESULTS
3.1. The Strength of Lyman Absorbers


The properties of the CGM as a function of properties of the host galaxy are not yet clearly understood. Studies have detected gas traced by Lyman out to radii of a few hundred kpc (Chen et al., 1998, 2001b; Bowen et al., 2002; Steidel et al., 2011, and other authors) and found a weak inverse correlation between the strength of the Lyman line and the impact parameter.
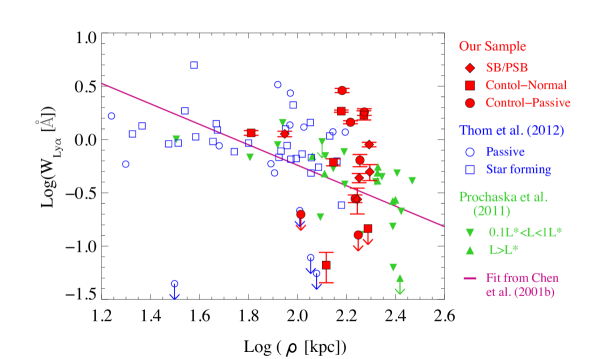
Figure 7 shows Lyman equivalent width versus impact parameter. Our data are shown as red symbols with their shapes representing their spectral classes based on the indices PC1 and PC2. The magenta line shows the best fit obtained by Chen et al. (2001b) for their data. We also overplot data from recent studies by Prochaska et al. (2011) and Thom et al. (2012) for a visual comparison. We do not see a trend of equivalent width with impact parameter in our sample. This is not surprising since our sample spans a rather narrow range in impact parameter. Furthermore, these objects cover the full range of equivalent width seen in other surveys. Interestingly, the top five strongest absorbers are associated with the CGM of the control sample.
Some authors have found a correlation between the strength of Lyman absorption and the luminosity of the host galaxy (Chen et al., 2001b; Bowen et al., 2002). We see no correlation between the Lyman equivalent width and the galaxy stellar mass, which is a proxy for its luminosity. This may be because we span a rather narrow range in stellar mass (), although the implied range in the dark halo mass is considerably larger (few to a few M⊙).
We also investigate the strength of the Lyman transition as a function of orientation of the sightline with respect to the galaxy major axis (Figure 8). The strongest absorbers are aligned close to the major axis, although some of the weak absorbers can also be found there. However, due to small number statistics of our data a correlation cannot be verified with certainty (the Spearman’s rank analysis implies that there is a 20% chance that there is no correlation).
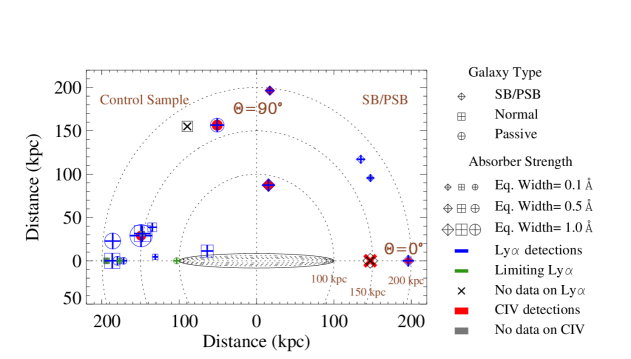
A more intuitive way of understanding the combined effect of orientation and impact parameter on the strength of the absorbers is presented in Figure 9. The figure shows a cartoon of a generic galaxy at the center. The equidistant regions from the center are marked with dotted semi-circles. It is to be noted that this model is just for illustration and does not represent the range of morphologies and sizes of our target galaxies. In order to distinguish between the two sub-samples, the starburst galaxies are plotted on the right side of the figure and the control galaxies containing the normal and passive galaxies are plotted on the left. It is evident that the Lyman absorbers with equivalent width are only found in the control sample.
To further emphasize the difference in the average Lyman strength between the starburst sample and the control sample, we study the variation in terms of both the value of PC1 and the star-formation rate per unit stellar mass (the specific star-formation rate see Table 2). Figure 10 suggests that the scatter in the Lyman equivalent width is larger in the passive galaxies and smallest in the starbursts.
3.2. Highly Ionized Gas in the CGM in Starburst Galaxies
A drop in the strength of the Lyman line can be due to either a relative lack of gas in the CGM of starburst galaxies or to a higher degree of ionization and/or temperature. A distinct difference between the two scenarios would be an enhanced presence of absorbers associated with highly ionized and/or hot (coronal-phase) gas. The best probe of such gas in our data is the C IV line. Our COS data provided useful information on this line in 17 cases (5 starbursts and 12 control galaxies). It is then possible to look for any correlation between the presence of a starburst and of highly ionized gas traced by C IV.
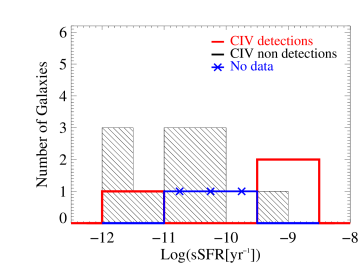
We detected C IV absorption-lines in six galaxies. As described above, we fit Voigt profiles to the doublet and this yielded typical column densities of several cm-2 (see Table 3). Four of the detected galaxies are starbursts and the remaining two are control galaxies. Thus, we find C IV absorbers in 80% (4/5) of the SB/PSB and in only 17% (2/12) of the control galaxies. Interestingly, the two detections of the C IV absorbers in the control sample are associated with passive galaxies and none with normal star forming galaxies (see Figure 11).
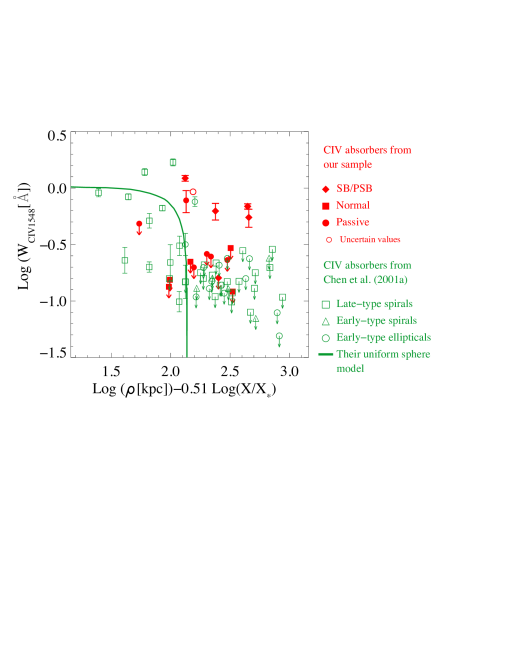
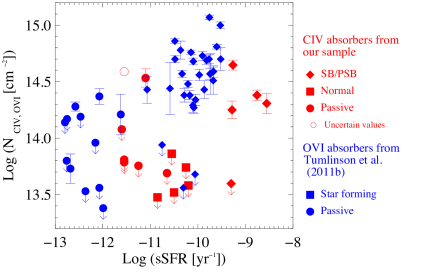
Figure 12 shows the equivalent width as a function of impact parameter and specific SFR. By design, we do not explore a large impact parameter range and hence no trends are prominent unlike that found by Chen et al. (2001a) for a sample of galaxies at a median redshift of 0.4. Our data (plotted in red) is combined with that of Chen et al. (plotted in blue) is shown in the left panel of the figure. Following the fitted empirical relation in Chen et al. (2001a), we have scaled the impact parameters for our sample by the factor . Here is the total galaxy stellar mass and is the fiducial value for a Schechter function fit to the galaxy stellar mass function: M⊙ (e.g. Li & White, 2009). This panel clearly reinforces our previous conclusion that the CGM surrounding the starbursts has unusually strong C IV absorption-lines at large impact parameters compared to typical galaxies. We do explore a large parameter space in terms of specific SFR and find strong absorbers in galaxies with high specific SFRs. A qualitatively similar trend was also observed by Tumlinson et al. (2011b) for their O VI absorber sample (plotted in blue in the right panel of figure 12).
Recent numerical simulations have modeled CGM properties in the presence of galactic outflows using SPH-based cosmological simulations (Ford et al., 2012) and adaptive-mesh refinement simulations for Milky-Way massed galaxies (Hummels et al., 2012). While Ford et al. (2012) found a subset of C IV absorbers at impact parameters of 100 kpc from their host galaxy that had column densities greater than , the median value was about (corresponding to a C IV equivalent width of 0.05 ). Simulations of Milky-Way-like galaxies by Hummels et al. (2012) predicted typical C IV columns at impact parameters 100 kpc of . Both sets of simulations are consistent with our data for typical galaxies, but fall far short of the observed C IV column densities of a few in the CGM of starbursts.
We note that most of the spectra in our sample have similar signal-to-noise ratios and therefore the C IV non-detections are not a consequence of lower data quality in these spectra. Figure 13 shows the stack of all the non-detections in the two control sub-samples. This was done in order to detect any weak signature of the presence of C IV absorption in the data by increasing the S/N of the averaged spectrum. The C IV spectrum of each galaxy is stacked at the peak velocity of associated Lyman after correcting for the intrinsic COS wavelength calibration corrections (as described in Section 2.2). The wavelength corrections help against dilution of the stacked spectra. The resulting uncertainties in rest-frame velocities are 100 km s-1 , which is lower than the resolution of the grating or the FWHM of all the C IV detections. The stacked spectra were generated by adding all the C IV non-detections for the two control galaxy subsamples i.e. 5 normal galaxies and 5 passive galaxies each. The single case of C IV non-detection in the starburst sample is not shown here. The limiting equivalent width of C IV for the normal star-forming galaxy stack is 118.5 m), compared to values of 400 to 900 m in the six detections. Passive galaxies do show a slight dip, however due to undulating nature of the noise in the spectrum this feature is still within the noise. So, in neither stacked spectrum is there a significant absorption feature.


There are important differences between C IV absorbers in starburst and control galaxies besides the detection rate. While the presence of C IV in the control (passive) galaxies is accompanied by the presence of strong low-ionization metal transitions, the same is not true for the starburst galaxies. The two passive galaxies with C IV detections show transitions such as Si II, C II, Si III, C III, and Si IV. The equivalent widths of the Lyman absorbers in each of these two systems (1.5 and 2.9 Å) are also significantly higher than those found in the starburst galaxies (0.3 to 1.1 Å; median of 0.5 Å).
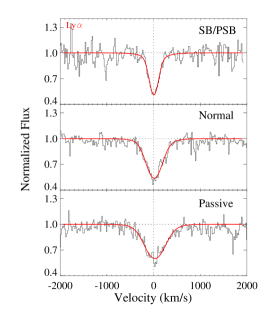
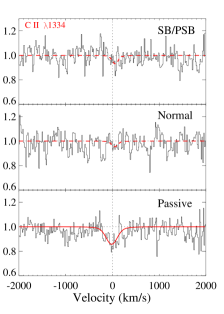
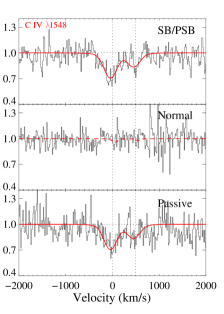
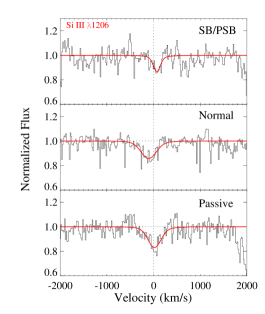
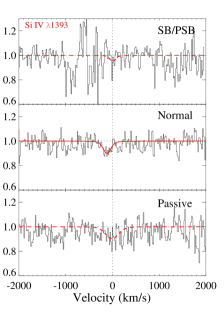
To investigate this more generally, we have created stacked composite spectra for the starburst and control samples. The composite spectra for Lyman , C II, C IV, Si III, and Si IV for the SB/PSB sample and the two control sub-samples are presented in Figure 14. These spectra were obtained by stacking both detections and non-detections together for each of the transitions - Lyman 1216 , C II 1334 , C IV1548,1550 , Si III 1206 , and Si IV 1393,1402 . The dotted lines show the rest-frame of the absorbers based on the position of the Lyman centroid. The Lyman spectra were obtained by adding each individual spectrum corrected to the rest-frame velocity of the target galaxy. For the other transitions that are weaker than Lyman , we correct the velocity to the rest-frame Lyman velocity whenever Lyman was detected. If not, we used the optical redshift of the target galaxy to set the rest-frame velocity.
Lyman was clearly detected in the stacked composite spectra in all sub-samples and C IV was detected for starburst and control-passive galaxies. We also detected Si III in all three composite spectra at a strength of about 20-25% of Lyman . Table 5 summarizes the equivalent widths, FWHMs, and column densities of all the detected transitions and provides upper limits for non-detections. Among the detections, the Lyman equivalent width as well as its velocity spread increased from the starburst to normal to passive galaxies. It is not surprising that the equivalent width and the velocity spread of the composite Lyman features are correlated. This is due to the contribution of strong (saturated) Lyman lines associated with some of the passive and normal galaxies. Since the stacked spectra were produced by averaging both saturated lines with unsaturated and even non-detections, the resulting composite may not look saturated.
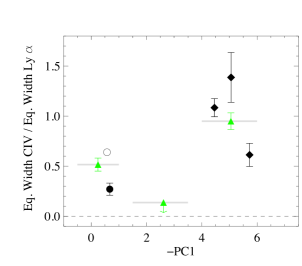
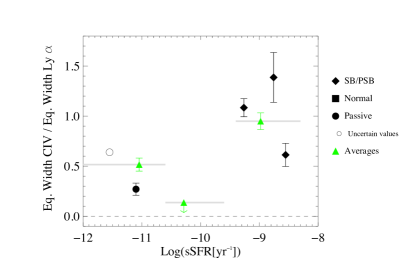
Another way to study the difference in the ionization state of the CGM in the starburst halos is shown in Figure 15. Here we plot the ratio of the equivalent widths of C IV to Lyman as a function of PC1 and specific star formation rate. The top panels show the ratios for individual galaxies in our sample. Not all galaxies have detectable Lyman and the plot includes only those with Lyman detections. The upper limits in the plot represent cases where no C IV was detected. None of the four galaxies with an upper limit on the Lyman equivalent widths show C IV absorption. In other words, we have detected Lyman in all the galaxies where we have detected C IV, with the possible exception of J140502, where we have no information on the Lyman transition.
The bottom panels of Figure 15 show the subset of galaxies where we have detected C IV and also include the average C IV/Lyman ratio for the three sub-samples in green. The averages were derived from the composite spectra obtained by stacking the velocity corrected spectrum of individual galaxies. The larger mean ratio of C IV/Lyman in the starbursts is evident. This would suggest that the CGM has a higher overall degree of ionization in the starbursts. We believe that this is an ionization effect, and not due to higher metallicities in the CGM of the starburst galaxies. If it were just a metallicity effect, then the starburst galaxies should show strong absorption-lines from metals in the lower ionization states in addition to C IV. This is not the case as can be seen from our data (see Table 5).
4. Discussion
The results presented above (section 3.2 and Tables 3 and 5) show that material with a C IV column density of a few cm-2 covers a large fraction ( 80%) of the sight-lines through the halos of starburst galaxies extending out to radii of roughly 200 kpc.
To get a crude estimate of the mass represented by the C IV absorbers we follow Tumlinson et al. (2011b) and use a simple model-independent geometric method. We take the total number of C IV ions in the CGM to be given by the product of the C IV column density for our absorbers, the cross-sectional area of the CGM that we probe (, where r = 200 kpc), and the covering factor of the C IV absorbers within this radius (4/5). This implies a total mass of C IV within a radius of 200 kpc of roughly a few M⊙. For collisionally ionized gas (see below), the minimum ionization correction (which occurs for a temperature of 105 K) implies a total Carbon mass of about (Dopita & Sutherland, 1996). The maximum likely metallicity of the CGM would be solar. In this case the minimum total gas mass associated with the C IV absorbers would be (but is likely to be larger). Since the mean stellar mass of the starbursts in our sample is about M⊙, we conclude that the C IV absorbers trace a significant repository of the baryons in these galaxies.
The results presented above also suggest that starbursts are affecting the ionization state of a significant amount of gas in the circum-galactic medium. We will first discuss whether this is physically plausible, will then use these results to estimate the properties of the absorbing material, and then briefly discuss the implications of these results.
4.1. Photoionization
One possibility is that the C IV in the starburst galaxies arises in photoionized gas. The radiation field incident on a CGM cloud of density, , at a distance, , from the galaxy can be characterized using the ionization parameter, U, that includes contribution from both the extragalactic Haardt & Madau (2012) background and the ionizing flux from the starburst:
| (1) |
As described by Tumlinson et al. (2011a), can be expressed as
| (2) |
where is the total rate of hydrogen ionizing photons produced by the starburst with an escaping fraction of , is the distance from the starburst to the cloud (which we approximate as the impact parameter) and represents the speed of light.
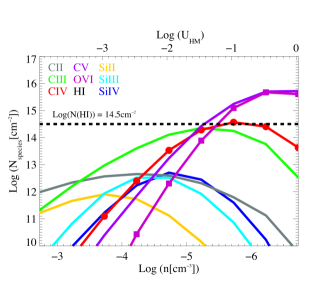
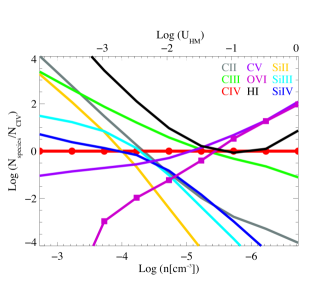
We present two scenarios for photoionization of a CGM cloud as modeled using the code Cloudy(Ferland et al., 1998) for a plane-parallel slab. These two cases can be considered to bound the range of possibilities. These simulations assume the relative abundances of the different metals have solar values with no dust depletion.
In the first case, we use the Haardt & Madau metagalactic background (Haardt & Madau, 2012). We illuminate the slab from two sides in this case to account for the isotropic nature of the metagalactic background. Figure 16 shows the ionization of the various species as a function of ionization parameter, which in turn is related to the density of the cloud (see Eq 2). The left panel shows models integrated until an H I column density of 10 is reached (matching our inferred values in the CGM of the starbursts). Changing this limit moves the plotted lines up and down such that their ratios remain the same. Hence, their ratios can be used as a robust matrix for estimating the ionization parameter. The plot in the right panel of Figure 16 shows these ratios normalized to C IV. The strongest constraint on the ionization parameter comes from the lower limit on the ratio of the Si IV and C IV columns. This requires log(U) -1.5. We use a value for based on the most recent modeling of the UV background by Haardt & Madau (2012), consistent with the value found earlier by Giroux & Shull (1997). We then increase this flux by a factor of two to account for illumination of both sides of the photoionized slab. This yields an upper limit to the density of the cloud cm -3. We find a minimum ionization correction to go from C IV to C is a factor of four. To produce the observed C IV column density would then require a cloud size kpc (where the scaling accounts for the the cloud metallicity). For plausible (sub-solar) metallicity the implied sizes are significantly larger than the CGM. Moreover, photoionization by the metagalactic background would not naturally explain why strong C IV is much more common in the CGM of starbursts than in the control sample. We conclude that this model is implausible.
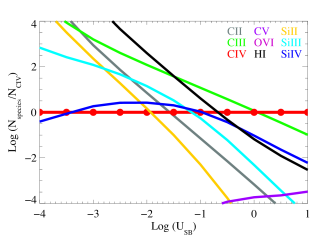
Next, we explore photoionization of the CGM caused by the radiation escaping from the starburst galaxies. Figure 17 shows the distribution of various species in a CGM cloud in terms of the ionization parameter produced by a starburst. The starburst spectrum used for these runs is a model spectrum for a starburst with constant star formation for 100 Myrs as produced by Starburst99 (Leitherer et al., 2010). Because the ionizing spectrum of a starburst is softer than that of the metagalactic background, the constraints on the ionization parameter are even more severe. The lower limit to the ratio of Si IV and C IV columns implies log(U) 0.2. We estimate using the extinction corrected H fluxes and the values are presented in Table 2. Adopting the mean values for ) and (160 kpc) for the starburst sample, the required density is and the implied cloud size is kpc. Observations of typical local starbursts yield an upper limit on the escape fraction of 0.01 or 1% (e.g. Grimes et al., 2009), so this scenario would yield cloud sizes even larger than in the case of the metagalactic background.
4.2. Collisional Ionization & Galactic Winds
If the C IV does not trace photoionized gas, the alternative is that the gas is hot and collisionally ionized. This process can not be due to shocks in the CGM associated with a major galactic merger. The images of our starburst sample in Figure 2 show that they are mostly normal single galaxies. This is consistent with Sanders & Mirabel (1996), who find that only 12% of low luminosity starbursts similar to our targets are merger driven. Since our C IV detection rate 80%, we therefore conclude that any collisional ionization of the CGM is not primarily merger-driven.
Let us then explore a model in which the C IV traces gas clouds in the CGM that are shock-ionized by a starburst-driven wind that may or may not be escaping (galactic fountains). We first consider whether such outflows driven by starbursts with the ages and strengths corresponding to our sample would be able to affect the CGM at such large radii. The models described in Wild et al. (2010) applied to our sample yield average burst ages of 200 Myr, average burst masses of , average burst mass fractions of 11%, average star-formation rates during the burst of .
The best-studied starburst wind is M82. Observations with Chandra (Strickland & Heckman, 2009) imply that the outflow speed of the wind fluid produced inside M82 is about 2000 km s-1 and the mass and kinetic energy outflow rates in this material are and respectively. Our estimated burst parameters imply an average star formation rate about 70% as high in our starbursts as in M82 so we will scale the M82 outflow rates down by a factor of two for their winds. These empirical estimates of the wind outflow rates are very similar to theoretical estimates for a starburst with a star-formation rate of (Starburst99; see Leitherer et al., 2010).
The simplest model to consider is if the wind propagates freely outward at 2000 km/sec into the halo. The wind will then travel 200 kpc in 108 years (consistent with our results). More realistically, we can consider a wind that propagates into a spherically-symmetric volume-filling CGM, thereby creating an expanding wind-blown bubble. This general problem has been analyzed by Dyson (1989) and Koo & McKee (1992) for power-law radial density profiles. Taking an initial radial profile for the CGM corresponding to an isothermal halo (, the radius of the expanding bubble is given by kpc. Here is the rate of kinetic energy injected by the starburst given in units of , the CGM mass out to a radius of 200 kpc is in units of and the time since the starburst began is given in units of 108 years.
The gas mass of the CGM is very uncertain, but is likely to be comparable to or a bit less than the galaxy stellar mass (e.g. Hummels et al. 2013). Since the average stellar mass of the starbursts is 2 M⊙, the fiducial value for 1 is reasonable. We take an average age of 200 Myr and an average kinetic energy injection rate of 5 erg sec-1 for our starburst sample. This leads to an outer radius for the expanding wind-blown cavity in the halo of about 100 kpc. Given the highly idealized nature of our model and the uncertain mass of the CGM, we regard this simple estimate as only showing that it is plausible for a starburst-driven wind to affect the bulk of the CGM.
Based on the properties of our Milky Way and of QALS associated with other galaxies, we know that the real CGM contains clouds or clumps. Assuming a simple picture in which the CGM contains both clouds and a tenuous inter-cloud medium (e.g. Kaufmann et al., 2009), the outflowing wind will then not only inflate a large bubble/cavity in the tenuous component, it will also shock-heat and accelerate the population of imbedded ambient CGM clouds.
To produce substantial amounts of C IV in these clouds requires a post-shock temperature above 105 K and hence shock speeds in excess of 100 km s-1 (e.g. Shull & McKee, 1979). For a cloud shocked by a wind, the velocity of the cloud shock is related to the velocity of the wind by , where and are the density in the wind and the pre-shocked cloud. Our adopted wind parameters give 2000 km s-1 and at 150 kpc. This implies that a cloud density of () would lead to km s-1 .
Adopting the minimum corrections for ionization and metallicity discussed above, the observed C IV column densities imply minimum total hydrogen column densities of at least a few cm-2. Together with the cloud density above, the implied minimum cloud size would be 10 kpc. This is much smaller than the total path-length our line-of-sight traverses though the CGM (roughly given by the impact parameter). This size mismatch is consistent with the absorbing material having a small volume filling factor (i.e. being clumpy). The associated time for the shock to traverse the absorbing cloud (the “cloud crossing time”) would be greater than 108 years. Wind-shocked clouds can survive several cloud-crossing times before being hydrodyamically disrupted (e.g. Pittard et al., 2010), consistent with the continued existence of the shocked clouds over a period of a few hundred Myr (the starburst duration).
These estimates can be compared to predictions for column densities behind shocks. The total column density of material cooling behind a radiative shock is independent of the gas density and is given by cm-2 (Draine & McKee, 1993). Detailed shock models yield predicted C IV column densities of for (Shull & McKee, 1979). Since the observed column densities are about an order-of-magnitude larger than this, it seems likely that the C IV absorption we see arises from an ensemble of multiple shocks.
The observed breadth of the C IV lines (FWHM 120 to 320 km s-1) could be associated with wind-driven shocks. For a CGM cloud with a total gas column density of 1019 cm-2 located initially at rest at a radius of 150 kpc from the starburst, and then exposed to the ram pressure of our adopted wind, Equation 2 in Heckman et al. (2011) predicts the cloud terminal velocity would be about 200 km sec-1.
Finally, we can consider the energetics of such a picture. If the C IV traces gas that is cooling radiatively, this cooling rate should not exceed the total heating rate available from the starburst wind. For the masses, densities, and temperatures discussed above the total CGM cooling rate traced by the C IV absorbers would be (Sutherland & Dopita, 1993). This rate is independent of metallicity (a lower metallicity increases the total gas mass and thermal energy implied by the observed C IV column densities, but increases the radiative cooling time of the shocked gas by roughly the same amount). It is still a minimum rate since it assumes the gas is cooling from a temperature of K (the minimum needed to produce C IV). This cooling rate is similar to the kinetic energy outflow rate in the wind that we have estimated above based on scaling the M82 wind (5 ). It is possible then to provide the necessary heating, but a significant fraction of the wind kinetic energy is needed.
4.3. Relationship to O VI Absorbers
In an important paper, Tumlinson et al. (2011b) reported on results obtained with COS that probed the O VI doublet (1032,1038 Å) along sightlines through the CGM of 42 galaxies at redshifts of 0.1 to 0.36 and with impact parameters ranging up to 150 kpc. They find a very high detection rate (90%) of O VI in the normal star-forming galaxies (specific SFR to 10-9.5 yr-1) and a much lower detection rate (33%) among the passive galaxies (specific SFR yr-1). At impact parameters similar to those we have probed ( kpc) the typical O VI column densities are cm-2 in the CGM of the detected galaxies.
While both their results and ours link the presence of highly-ionized gas in the CGM to star formation in the central galaxy, there is an intriguing difference: we find that strong C IV absorbers are preferentially detected in the CGM of starbursts, but are not detected in normal star-forming galaxies. The weakness of the C IV absorption at impact parameters like these is also seen in the Chen et al. (2001a) sample of normal disk galaxies at 0.4.
Putting all these results together would imply that the ratio of O VI and C IV column densities in the CGM of normal star forming galaxies is greater than 10. This could imply the O VI in these galaxies traces exceedingly low density material that is photoionized by the metagalactic background. However, the Cloudy models discussed above would require densities less than cm-3 in this case. The observed O VI column densities then lead to sizes greater than a Mpc (even for solar Oxygen abundances). This is not tenable for the CGM.
Alternatively, the large ratio of O VI to C IV could indicate collisionally ionized gas significantly hotter than K. We have argued that the C IV in the starburst CGM arises in collisionally ionized gas as well. Our results that C IV is much stronger in the CGM of starbursts might suggest that the O VI lines would also be stronger in the CGM of starbursts than in normal star forming galaxies. Currently, the data to establish that result is lacking. Observations of O VI along site lines directly into starbursts similar to those in our sample show high column densities of (Grimes et al., 2009). However it is not clear if this gas is actually located in the CGM (rather than close to the starburst). Future observations of O VI in the CGM of starbursts with HST/COS would be most instructive.
5. Summary & Implications
The circum-galactic medium (CGM) comprises of gas located in the halo of a galaxy extending out to the virial radius. As such, it is the interface between a galaxy and the inter-galactic medium (IGM). The effect of winds driven by intense star formation on gas in the CGM may be crucial to the evolution of both galaxies and the IGM. For example, can such negative feedback shut down the delivery of fresh gas flowing through the CGM into a galaxy and thereby quench future star formation? If so, does this play a role in the on-going migration of galaxies from the blue star-forming population to the red passive one? Can metals and energy be transported through the CGM and ultimately be delivered to the IGM? Answering these questions requires detailed observations of galactic winds. The best-studied such winds are driven from starbursts in the nearby universe. While existing data demonstrate that such starburst-driven winds exist, they provide scant information on their properties beyond radii of a few tens of kpc and so do not probe the bulk of the CGM.
In order to probe the effect of starburst-driven winds on the CGM we conducted a COS UV spectroscopic study using background QSOs to probe the CGM (in absorption) around foreground galaxies. This study probed sight-lines out to radii of 200 kpc for 20 galaxies. We targeted starburst galaxies and control galaxies consisting of normal star forming and passive galaxies. We compared the properties of CGM in these three classes and found the following:
1. Most (83%) of the target galaxies in our sample showed Lyman absorbers in the CGM. The dispersion in Lyman equivalent width was larger for passive galaxies, with some absorbers having values of 3 and others with upper limits whose values were an order-of-magnitude lower. This is unlike the starburst sample where Lyman was detected in all cases but had lower strengths (0.4 to 1.1 ).
2. Highly ionized gas traced by C IV, was predominantly found in the CGM of starburst galaxies. The C IV line was detected in 80% of the starburst galaxies (4/5) compared to only 17% (2/12) of the control galaxies. These lines are resolved (intrinsic FWMH 100 to 320 km s-1 and are mildly saturated with implied C IV column densities of a few cm-2.
3. Multiple transitions from low-ionization species such as Si II and C II as well as intermediate-ionization transitions like Si III and C III were detected in the two passive galaxies where C IV was detected. This was not the case for the four starbursts with detected C IV. This implies that the CGM in the starbursts is more highly ionized than the CGM in the passive galaxies, even those where C IV is detected. This inference is further supported by the result that the ratio of the equivalent widths of the C IV and Lyman lines is larger in the starburst galaxies than in either the passive or normal star forming galaxies.
4. It is very unlikely that the C IV absorbers in the starbursts are photoionized by either the metagalactic background or the stellar radiation from the starburst. CLOUDY models show that high ionization state of the gas requires cloud densities that are very small. To explain the observed column densities requires path-lengths through the absorbing gas that are significantly larger than the size of the CGM.
5. We have shown that a starburst with properties like those we infer for our sample members (average burst ages of 200 Myr and average burst mass fractions of 10% of the stellar mass) can plausibly drive an outflow that can affect the bulk of the CGM. In such a model the C IV would arise in pre-existing clumpy clouds or filaments in the CGM that are being shock-ionized and accelerated by the ram pressure of the wind. The ensemble of such clouds must have a large areal covering factor (%).
6. Even for the most conservative assumptions about ionization and metallicity corrections, the C IV absorbing clouds would constitute a significant baryon repository when compared to the galaxy stellar mass (at least 10% of the ).
While our understanding of how starbursts affect the circum-galactic gas is far from complete, our new observations show for the first time that starburst-driven outflows in the nearby universe can have a major impact on physical conditions in the CGM. This might hold the key to understanding whether such winds may quench star formation by reducing the supply of infalling cool gas and help us to better understand how the intergalactic medium is chemically enriched and heated.
References
- Adelberger et al. (2005) Adelberger, K. L., Shapley, A. E., Steidel, C. C., et al. 2005, ApJ, 629, 636
- Balogh et al. (1999) Balogh, M. L., Morris, S. L., Yee, H. K. C., Carlberg, R. G., & Ellingson, E. 1999, ApJ, 527, 54
- Bouché et al. (2007) Bouché, N., Murphy, M. T., Péroux, C., et al. 2007, ApJ, 669, L5
- Bowen et al. (2002) Bowen, D. V., Pettini, M., & Blades, J. C. 2002, ApJ, 580, 169
- Brinchmann et al. (2004) Brinchmann, J., Charlot, S., White, S. D. M., et al. 2004, MNRAS, 351, 1151
- Chen et al. (2001a) Chen, H.-W., Lanzetta, K. M., & Webb, J. K. 2001a, ApJ, 556, 158
- Chen et al. (1998) Chen, H.-W., Lanzetta, K. M., Webb, J. K., & Barcons, X. 1998, ApJ, 498, 77
- Chen et al. (2001b) —. 2001b, ApJ, 559, 654
- Chen et al. (2010) Chen, Y.-M., Tremonti, C. A., Heckman, T. M., et al. 2010, AJ, 140, 445
- Conti et al. (2008) Conti, P. S., Crowther, P. A., & Leitherer, C. 2008, From Luminous Hot Stars to Starburst Galaxies (Cambridge University Press)
- Dixon (2010) Dixon, W. V., e. a. 2010, cosmic Origins Spectrograph Instrument Handbook, Version 3.0 (Baltimore, MD: STScI)
- Dopita & Sutherland (1996) Dopita, M. A., & Sutherland, R. S. 1996, ApJS, 102, 161
- Draine & McKee (1993) Draine, B. T., & McKee, C. F. 1993, ARA&A, 31, 373
- Dyson (1989) Dyson, J. E. 1989, in Lecture Notes in Physics, Berlin Springer Verlag, Vol. 350, IAU Colloq. 120: Structure and Dynamics of the Interstellar Medium, ed. G. Tenorio-Tagle, M. Moles, & J. Melnick, 137
- Ferland et al. (1998) Ferland, G. J., Korista, K. T., Verner, D. A., et al. 1998, PASP, 110, 761
- Ford et al. (2012) Ford, A. B., Oppenheimer, B. D., Davé, R., et al. 2012, ArXiv e-prints
- Giroux & Shull (1997) Giroux, M. L., & Shull, J. M. 1997, AJ, 113, 1505
- Green et al. (2012) Green, J. C., Froning, C. S., Osterman, S., et al. 2012, ApJ, 744, 60
- Grimes et al. (2005) Grimes, J. P., Heckman, T., Strickland, D., & Ptak, A. 2005, ApJ, 628, 187
- Grimes et al. (2009) Grimes, J. P., Heckman, T., Aloisi, A., et al. 2009, ApJS, 181, 272
- Haardt & Madau (2012) Haardt, F., & Madau, P. 2012, ApJ, 746, 125
- Heckman et al. (1990) Heckman, T. M., Armus, L., & Miley, G. K. 1990, ApJS, 74, 833
- Heckman et al. (2011) Heckman, T. M., Borthakur, S., Overzier, R., et al. 2011, ApJ, 730, 5
- Hummels et al. (2012) Hummels, C., Bryan, G., Smith, B., & Turk, M. 2012, ArXiv e-prints
- Kalberla et al. (2005) Kalberla, P. M. W., Burton, W. B., Hartmann, D., et al. 2005, A&A, 440, 775
- Kauffmann et al. (2003) Kauffmann, G., Heckman, T. M., White, S. D. M., et al. 2003, MNRAS, 341, 33
- Kaufmann et al. (2009) Kaufmann, T., Bullock, J. S., Maller, A. H., Fang, T., & Wadsley, J. 2009, MNRAS, 396, 191
- Koo & McKee (1992) Koo, B.-C., & McKee, C. F. 1992, ApJ, 388, 93
- Lehnert & Heckman (1996) Lehnert, M. D., & Heckman, T. M. 1996, ApJ, 462, 651
- Leitherer et al. (2010) Leitherer, C., Ortiz Otálvaro, P. A., Bresolin, F., et al. 2010, ApJS, 189, 309
- Li & White (2009) Li, C., & White, S. D. M. 2009, MNRAS, 398, 2177
- Martin (2005) Martin, C. L. 2005, ApJ, 621, 227
- Ménard et al. (2011) Ménard, B., Wild, V., Nestor, D., et al. 2011, MNRAS, 417, 801
- Miller et al. (2005) Miller, C. J., Nichol, R. C., Reichart, D., et al. 2005, AJ, 130, 968
- Morton (2003) Morton, D. C. 2003, ApJS, 149, 205
- Nestor et al. (2011) Nestor, D. B., Johnson, B. D., Wild, V., et al. 2011, MNRAS, 412, 1559
- Osterman et al. (2011) Osterman, S., Green, J., Froning, C., et al. 2011, Ap&SS, 335, 257
- Pittard et al. (2010) Pittard, J. M., Hartquist, T. W., & Falle, S. A. E. G. 2010, MNRAS, 405, 821
- Prochaska et al. (2011) Prochaska, J. X., Weiner, B., Chen, H.-W., Mulchaey, J., & Cooksey, K. 2011, ApJ, 740, 91
- Rupke et al. (2005) Rupke, D. S., Veilleux, S., & Sanders, D. B. 2005, ApJS, 160, 115
- Salim et al. (2007) Salim, S., Rich, R. M., Charlot, S., et al. 2007, ApJS, 173, 267
- Sanders & Mirabel (1996) Sanders, D. B., & Mirabel, I. F. 1996, ARA&A, 34, 749
- Sembach & Savage (1992) Sembach, K. R., & Savage, B. D. 1992, ApJS, 83, 147
- Sembach et al. (2004) Sembach, K. R., Tripp, T. M., Savage, B. D., & Richter, P. 2004, ApJS, 155, 351
- Shapley et al. (2003) Shapley, A. E., Steidel, C. C., Pettini, M., & Adelberger, K. L. 2003, ApJ, 588, 65
- Shull & McKee (1979) Shull, J. M., & McKee, C. F. 1979, ApJ, 227, 131
- Steidel et al. (2011) Steidel, C. C., Bogosavljević, M., Shapley, A. E., et al. 2011, ApJ, 736, 160
- Steidel et al. (2010) Steidel, C. C., Erb, D. K., Shapley, A. E., et al. 2010, ApJ, 717, 289
- Strauss et al. (2002) Strauss, M. A., Weinberg, D. H., Lupton, R. H., et al. 2002, AJ, 124, 1810
- Strickland & Heckman (2009) Strickland, D. K., & Heckman, T. M. 2009, ApJ, 697, 2030
- Sutherland & Dopita (1993) Sutherland, R. S., & Dopita, M. A. 1993, ApJS, 88, 253
- Thom et al. (2012) Thom, C., Tumlinson, J., Werk, J. K., et al. 2012, ApJ, 758, L41
- Tumlinson et al. (2011a) Tumlinson, J., Werk, J. K., Thom, C., et al. 2011a, ApJ, 733, 111
- Tumlinson et al. (2011b) Tumlinson, J., Thom, C., Werk, J. K., et al. 2011b, Science, 334, 948
- Veilleux et al. (2005) Veilleux, S., Cecil, G., & Bland-Hawthorn, J. 2005, ARA&A, 43, 769
- Weiner et al. (2009) Weiner, B. J., Coil, A. L., Prochaska, J. X., et al. 2009, ApJ, 692, 187
- Wild et al. (2010) Wild, V., Heckman, T., & Charlot, S. 2010, MNRAS, 405, 933
- Wild et al. (2007) Wild, V., Kauffmann, G., Heckman, T., et al. 2007, MNRAS, 381, 543
- Zibetti et al. (2007) Zibetti, S., Ménard, B., Nestor, D. B., et al. 2007, ApJ, 658, 161
| Foreground Galaxy | RA | Dec | Class | PC1 | PC2 | QSO | RA | Dec | ||||||
|---|---|---|---|---|---|---|---|---|---|---|---|---|---|---|
| (Log (M | (Log (M | (kpc) | ||||||||||||
| J075622.09+304329.0 | 119.092 | 30.725 | 0.0796 | Normal | -2.490.08 | -0.050.09 | 11.02 | 10.32 | 0 | J075620.07+304535.4 | 119.08 | 30.76 | 0.236 | 193.9 |
| J084356.12+261855.3 | 130.984 | 26.315 | 0.1128 | SB/PSB | -5.000.08 | 0.190.09 | 10.55 | 10.22 | 41 | J084349.75+261910.7 | 130.96 | 26.32 | 0.257 | 178.5 |
| J085252.73+031320.4 | 133.220 | 3.222 | 0.0954 | Passive | -0.190.22 | 0.610.24 | 10.92 | 9.99 | 0 | J085259.22+031320.6 | 133.25 | 3.22 | 0.297 | 171.9 |
| J085254.99+030908.3 | 133.229 | 3.152 | 0.0346 | Normal | -1.960.09 | 0.680.10 | 10.32 | 9.62 | 60 | J085259.22+031320.6 | 133.25 | 3.22 | 0.297 | 179.1 |
| J085301.26+031425.1 | 133.255 | 3.240 | 0.1292 | Passive | -0.570.16 | -0.070.16 | 10.90 | 10.50 | 72 | J085259.22+031320.6 | 133.25 | 3.22 | 0.297 | 164.6 |
| J092844.89+602545.7 | 142.187 | 60.429 | 0.1541 | Passive | -0.670.15 | 0.510.15 | 10.95 | 10.57 | 11 | J092837.98+602521.0 | 142.16 | 60.42 | 0.295 | 152.1 |
| J100801.20+500915.6 | 152.005 | 50.154 | 0.0523 | Normal | -2.660.15 | 0.860.15 | 10.39 | 9.55 | 0 | J100744.54+500746.6 | 151.94 | 50.13 | 0.212 | 186.6 |
| J101008.85+300252.5 | 152.537 | 30.048 | 0.0874 | Passive | -0.710.20 | 0.770.22 | 10.41 | 10.04 | 0 | J101000.68+300321.5 | 152.50 | 30.06 | 0.256 | 179.8 |
| J102846.43+391842.9 | 157.194 | 39.312 | 0.1135 | SB/PSB | -4.460.13 | 0.580.15 | 10.50 | 9.94 | 80 | J102847.00+391800.4 | 157.20 | 39.30 | 0.473 | 88.7 |
| J120314.43+480316.4 | 180.810 | 48.055 | 0.0629 | Passive | 0.120.12 | 0.040.12 | 10.78 | 10.20 | 7 | J120329.84+480313.5 | 180.87 | 48.05 | 0.817 | 187.4 |
| J122115.76-020009.6 | 185.316 | -2.003 | 0.0625 | SB/PSB | -5.060.08 | 0.890.09 | 10.15 | 9.43 | 85 | J122115.32-020253.3 | 185.31 | -2.05 | 0.785 | 197.2 |
| J122534.26-025029.1 | 186.393 | -2.841 | 0.0673 | SB/PSB | -5.730.04 | 0.880.04 | 10.13 | 9.69 | 0 | J122534.79-024757.2 | 186.40 | -2.80 | 0.195 | 196.1 |
| J132107.48+295615.3 | 200.281 | 29.938 | 0.0723 | SB/PSB | -3.790.11 | 0.160.12 | 10.48 | 9.97 | 33 | J132059.41+295728.1 | 200.25 | 29.96 | 0.206 | 175.5 |
| J132150.89+033034.1 | 200.462 | 3.509 | 0.0816 | Normal | -2.700.09 | 0.620.09 | 10.81 | 10.13 | 16 | J132144.97+033055.7 | 200.44 | 3.52 | 0.269 | 140.2 |
| J140502.20+470525.9 | 211.259 | 47.091 | 0.1452 | SB/PSB | -5.020.13 | -0.190.14 | 10.43 | 10.08 | 0 | J140505.77+470441.1 | 211.27 | 47.08 | 1.240 | 146.9 |
| J151136.53+402852.6 | 227.902 | 40.481 | 0.0945 | Passive | 0.040.14 | 0.350.14 | 10.67 | 10.22 | 0 | J151140.33+402721.5 | 227.92 | 40.46 | 0.558 | 177.0 |
| J154527.12+484642.2 | 236.363 | 48.778 | 0.0752 | Normal | -2.370.19 | 0.120.20 | 10.50 | 9.87 | 10 | J154530.23+484608.9 | 236.38 | 48.77 | 0.399 | 64.7 |
| J161708.92+063822.2 | 244.287 | 6.640 | 0.1526 | Passive | 0.260.11 | 0.500.12 | 11.39 | 10.81 | 0 | J161711.42+063833.4 | 244.30 | 6.64 | 0.229 | 103.2 |
| J161913.50+334146.8 | 244.806 | 33.696 | 0.1326 | Normal | -2.230.15 | 0.240.16 | 11.04 | 10.50 | 12 | J161916.54+334238.4 | 244.82 | 33.71 | 0.471 | 150.9 |
| J230842.91-091112.8 | 347.179 | -9.187 | 0.1902 | Normal | -2.720.11 | 0.190.11 | 11.09 | 10.69 | 2 | J230845.60-091123.9 | 347.19 | -9.19 | 0.193 | 131.0 |
| Foreground Galaxy | H Fluxa | H Luminositya | Q∗ | Avg. sSFRb | sSFR |
|---|---|---|---|---|---|
| () | () | () | ()) | ()) | |
| J075622 | -10.70 | ||||
| J084356 | 2.3 | 7.7 | 5.6 | -9.30 | -9.30 |
| J085252 | 7.7 | 1.8 | 1.3 | -10.65 | |
| J085254 | 1.1 | 3.0 | 2.2 | -10.85 | |
| J085301 | 3.4 | 1.5 | 1.1 | -11.55 | |
| J092844 | -11.10 | ||||
| J100801 | 1.8 | 1.2 | 8.7 | -10.55 | |
| J101008 | 1.9 | 3.5 | 2.6 | -11.25 | |
| J102846 | 7.6 | 2.5 | 1.8 | -9.26 | -9.80 |
| J120314 | 2.9 | 2.8 | 2.0 | -11.55 | |
| J122115 | 1.5 | 1.4 | 1.0 | -8.76 | -9.75 |
| J122534 | 5.1 | 5.5 | 4.1 | -8.55 | -9.40 |
| J132107 | 2.7 | 3.5 | 2.5 | -9.73 | -9.45 |
| J132150 | 4.2 | 7.0 | 5.1 | -10.25 | |
| J140502 | 1.3 | 7.2 | 5.3 | -9.28 | -9.05 |
| J151136 | -11.55 | ||||
| J154527 | 1.8 | 2.5 | 1.8 | -10.50 | |
| J161708 | -11.60 | ||||
| J161913 | 3.3 | 1.5 | 1.1 | -10.10 | |
| J230842 | 3.5 | 3.6 | 2.6 | -10.20 |
| Galaxy | W a,b | FWHM | Log NLyα | W | FWHM | W | Log NCIV |
|---|---|---|---|---|---|---|---|
| (km s-1 ) | (km s-1 ) | ||||||
| J075622 | 146b | 255 | |||||
| J084356 | 437 43 | 14.110.05 | 160 | 215 | |||
| J085252 | 279 23 | 13.71d | 199 | 256 | |||
| J085254 | 121 | 114 | |||||
| J085301 | 1452 47 | 15.05e | 928 86f | 14.590.06f | |||
| J092844 | 2885 132 | 15.08e | 779 172 | 505 104 | 14.530.08 | ||
| J100801 | 1694 168 | 14.690.02 | 295 | ||||
| J101800 | 640 84 | 14.130.05 | 231 | 221 | |||
| J102846 | 1129 67 | 14.690.07 | 1224 72 | 741 92 | 14.650.04 | ||
| J120314 | 1815 129 | 14.790.03 | 261 | 279 | |||
| J122115 | 497 85 | 14.120.10 | 689 37 | 409 56 | 14.380.05 | ||
| J122534 | 898 44 | 14.460.03 | 550 100 | 332 61 | 14.310.09 | ||
| J132107 | 275 75 | 13.730.20 | |||||
| J132150 | 613 47 | 14.230.02 | 223 | 234 | |||
| J140502 | 627 105 | 336 57 | 14.250.08 | ||||
| J151136 | 127b | 248 | 289 | ||||
| J154527 | 1154 59 | 14.530.02 | 134 | 125 | |||
| J161708 | 199b | 485 | 486 | ||||
| J161913 | 1847 45 | 14.900.01 | 94 | ||||
| J230842 | 66 21 | 13.09d | 154 |
| Galaxy | Redshift | Transition | FWHMb | Log N | ||
|---|---|---|---|---|---|---|
| () | () | |||||
| J085301 | 0.1292 | H I Ly | 1215.67 | 1452 47 | 15.05c | |
| H I Ly d | 972.54 | 1023 154 | ||||
| Si II | 1190.42 | 215 23 | 13.8e | |||
| Si II | 1193.29 | 345 23 | ||||
| Si II | 1260.42 | 524 47 | ||||
| Si II | 1304.37 | 165 36 | ||||
| Si II | 1526.71 | 311 63 | ||||
| Si III | 1206.50 | 790 46 | 171 | 13.81 0.03 | ||
| Si IV | 1393.76 | 423 37 | 13.7e | |||
| Si IV | 1402.77 | 240 50 | ||||
| C II | 1334.53 | 633 54 | 14.68 0.05 | |||
| C III d | 977.02 | 1031 126 | ||||
| C IV | 1548.20 | 928 86 | 14.59 0.06 | |||
| J092844 | 0.1541 | H I Ly | 1215.67 | 2987 132 | 15.08c | |
| H I Ly | 972.54 | 1063 117 | ||||
| Si II | 1190.42 | 424 61 | 14.13e | |||
| Si II | 1193.29 | 526 80 | ||||
| Si II | 1260.42 | 647 86 | ||||
| Si II | 1304.37 | 382 63 | ||||
| Si II | 1526.71 | 578 95 | ||||
| Si III | 1206.50 | 611 84 | 13.45e | |||
| Si IV | 1393.76 | 738 77 | 14.03 0.05 | |||
| C II | 1334.53 | 777 68 | 14.56e | |||
| C IIId | 977.02 | 1063 118 | ||||
| C IV | 1548.20 | 779 172 | 14.53 0.08 | |||
| C IV | 1550.77 | 505 104 |
| Galaxy | Transition | FWHM c | Log Nd | ||
|---|---|---|---|---|---|
| () | |||||
| SBPSB | H I Ly | 1215.67 | 590.4 30.0 | 14.19e 0.03 | |
| C II | 1334.53 | 60.1 | 13.5 | ||
| C IV | 1548.20 | 559.6 42.3 | 14.20 0.04 | ||
| Si III | 1206.50 | 125.2 19.5 | 12.85 0.12 | ||
| Si IV | 1393.76 | 44.0 | 12.71 | ||
| Control | H I Ly | 1215.67 | 881.3 21.5 | 14.32e 0.01 | |
| (Normal) | C II | 1334.53 | 40.1 | 13.32 | |
| C IV | 1548.20 | 39.5 | 13.00 | ||
| Si III | 1206.50 | 255.1 18.7 | 13.10 0.05 | ||
| Si IV | 1393.76 | 111.2 20.0 | 13.12 0.10 | ||
| Control | H I Ly | 1215.67 | 946.2 31.7 | 14.33e 0.02 | |
| (Passive) | C II | 1334.53 | 213.5 31.7 | 14.06 0.08 | |
| C IV | 1548.20 | 487.5 56.0 | 14.13 0.06 | ||
| Si III | 1206.50 | 264.0 28.7 | 13.12 0.06 | ||
| Si IV | 1393.76 | 167.7 | 13.30 |