Reactor Antineutrino Anomaly with known
Abstract
We revisit the reactor antineutrino anomaly using the recent reactor flux independent determination of sizable by considering the full set of the absolute reactor flux measurements. When normalized to the predicted flux of Mueller et al. nspec2 , the new world average, after including results from Palo Verde, Chooz, and Double Chooz, is 0.959 0.009 (experiment uncertainty) 0.027 (flux systematics). Including the data with kilometer baseline, the new world average is only about 1.4 lower than the unity, weakening the significance of the reactor antineutrino anomaly. The upcoming results from Daya Bay, RENO, and the Double Chooz will provide further information about this issue.
I Introduction
The term “reactor anomaly” was coined by Mention et al. anom who noted that the average of the experimentally determined reactor antineutrino flux at reactor-detector distances 100 m accounts for only 0.943 0.023 of the reevaluated theoretical expectation of Ref. nspec2 . In addition to the 19 experimental results obtained with detectors distant less than 100 m from the reactor source, we are able now to include in the analysis also the results of the Chooz Chooz1 ; Chooz2 and Palo Verde PaloVerde as well as of the Double Chooz DChooz ; DChooz1 ; DChooz2 experiments, where the detectors were further away from the reactor complex. In these cases, the corresponding experimental results need be corrected for the flux loss associated with the known value of the mixing angle , which was determined in a model independent way by comparing the count rates in two essentially identical, but separated in distance, detectors. We use the value obtained in the Daya Bay experiment dayabay ; dayabay_long ; dayabay_cpc , and confirmed by the RENO experiment reno . The corresponding correction is easy to apply using the formula for the survival probability
| (1) |
with . Values of mixing angles and mass-squared differences used in the simulation are taken from Ref. PDG assuming normal mass hierarchy ():
| (2) |
II Analysis Description
In the following, we will explain in detail the inputs to our analysis as well as the chi-square method. For the 19 experimental results obtained with detectors distant less than 100 m from the reactor source, the measured fluxes normalized to the prediction of Ref. nspec2 (noted as “ratio”) are taken from Ref. anom and tabulated in Table. 1, together with the detector technology, fission fractions, distance to the reactor core, and year of publication. The average survival probability for each experiment is calculated by integrating over the neutrino antineutrino spectrum nspec2 convoluted with the inverse beta decay cross section with . There are two uncertainties listed in Table 1. The represents the total uncertainty on the ratio. The represents the part of uncertainty correlated among different experiments. In particular, there is a 2.7 uncertainty in coming from the uncertainty in the predicted reactor flux. (In first versions of Ref. anom , the reactor flux uncertainty was assumed to be 2.7%, which was replaced by 2% in the final version. In this analysis, we chose the more conservative number (2.7%).) Since it will not affect the relative differences among different measurements, we define the reduced uncertainties:
| (3) |
after removing the 2.7% overall normalization uncertainty. We change the between SRP-I and SRP-II SRP from 3.7% (originally quoted in Ref. anom ) to 2.7% (the reactor flux uncertainty only). The original 3.7% assumes almost full correlation between SRP-I and SRP-II, which can not explain the apparent differences between the two ratios (0.952 vs. 1.018), indicating less correlation between the two experiments. For the same reason, we reduce the between the ROVNO88-1I and ROVNO88-2I from 6.9% to 5.7%, which is the final reported uncertainty for ROVNO88 experiments Rovno88 .
There are three reactor cores in the Palo Verde experiment PaloVerde . The distances between detector and each reactor core are 750 m, 890 m, and 890 m. In calculating the average survival probability , we assume that all three reactor cores have equal power. The result is compared with assuming full power in only the 750 m reactor and assuming full power in the 890 m reactors. The differences are quoted as an additional uncertainty, which is only about 5% of the total reduced experimental uncertainty.
There are two reactor cores in Chooz experiment Chooz1 ; Chooz2 . The distances between the detector and each reactor core are 998 m and 1115 m. Similar procedure is applied to calculate the uncertainty for the equal power assumption. The resulting uncertainty is about 6.2% of the total reduced experimental uncertainty. The fission fractions are assumed to be the same as those from Double Chooz DChooz1 . We also calculated the average by varying these fission fractions. The differences are negligible.
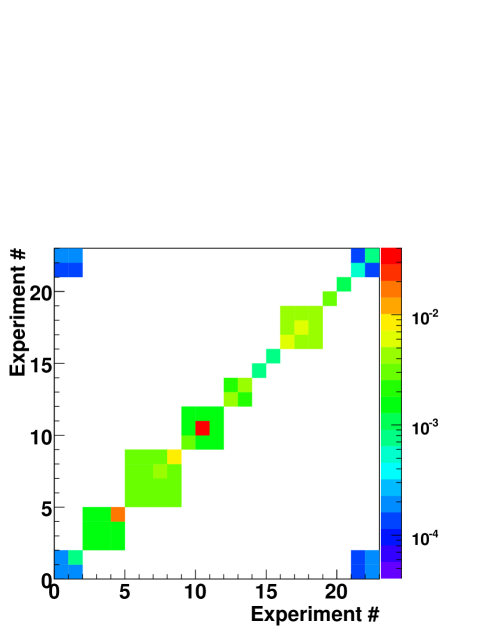
The Double Chooz experiment is conducted at the same location as Chooz. With a single detector, the recent rate-only analyses of the data from delayed neutron capture on Gadolinium (n-Gd) and delayed neutron capture on hydrogen (n-H) reported the value of DChooz1 and DChooz2 111To be consistent with other experiments, we choose the rate-only results, which represent simple measures of the disappearance in the total number of events., by anchoring to the short-baseline Bugey-4 results Bugey4 , respectively. Although the measured flux normalized to the prediction of Ref. nspec2 has not been reported, we can deduce such ratios using the reported fission fractions DChooz1 , the reported values of DChooz1 ; DChooz2 , and the Bugey-4 results. The is dominated by the uncertainties of reported , with additional uncertainties coming from the equal power assumption. The are calculated from the reduced experimental uncertainty from Bugey-4. Furthermore, there are additional correlated uncertainties between the n-H and n-Gd measurements due to the equal power assumption. The final covariance matrix using reduced uncertainties is shown in Fig. 1.
The function used in this analysis is constructed as follows:
| (4) |
Here, is the inverted covariance matrix. The vector contains the reported ratios from all 23 experiments (tabulated in Table. 1). The absolute normalization ratio is treated as a free parameter. The vector contains the predicted average survival probabilities given a value of . The values of using are tabulated in Table. 1. The last term in Eq. (4) represents the constrain on from the latest Daya Bay results dayabay_cpc .
III Results
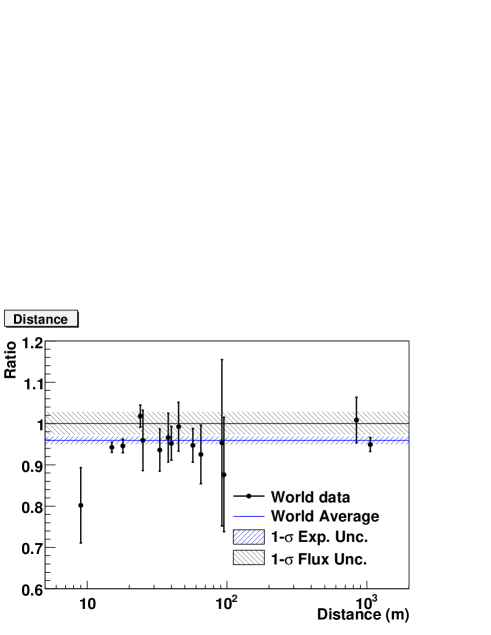
In the following three figures, we show the results of all 23 measurements and the deduced ratios after minimizing the defined in Eq. (4). The global average is determined to be 0.959. In Fig. 2, the results are shown in analogous way as in Ref. anom , i.e. as a function of the distance from the corresponding reactor core. We combine results at same baseline together for clarity. The corresponding /Dof = 23.8/22. We stress that our error bars do not include the reactor flux uncertainty (2.7%), hence they appear smaller than those in anom .
The new global average is somewhat larger than the 0.943 value of Ref.anom quoted earlier, weakening the significance of the reactor antineutrino anomaly. There are two reasons for this difference. First, we include more recent and more distant experiments, of which Palo Verde and Chooz have larger rates. Second, we change the correlated uncertainty between SRP-I and SRP-II from 3.7% to 2.7% (the reactor flux uncertainty only), since the original 3.7% assumes almost full correlation between SRP-I and SRP-II, which can not explain the apparent differences between the two ratios (0.952 vs. 1.018). With fixed total experimental uncertainties, this change effectively increases the significance of SRP experiments and leads to about 1% larger world average.
In addition, our results are larger than those reported in Ref. Evslin and Ref. thomas_new , which also include the kilometer experiments with known . The result reported in Ref. Evslin included the Gallium neutrino data GALLEX1 ; GALLEX2 ; SAGE1 ; SAGE11 ; SAGE2 ; SAGE3 ; Gallium3 , which was not included in our reactor antineutrino analysis. They also did an analysis by including a RENO preliminary result from the absolute flux analysis. However, such analysis of the RENO experiment has not been, to our knowledge, released and is not finished as yet soobong . In Ref. thomas_new , the measured experimental fluxes are normalized to the predicted flux of Huber nspec1 with a new neutron lifetime 881.5s (2011 update of PDG PDG ). The change in reactor flux model and the neutron lifetime leads to in average 1.6% lower ratios than what we used in this work (tabulated in Table. 1). The rest of differences come from the treatment in the correlated uncertainty of SRP experiments and the uncertainty of the reactor flux prediction (2% used in Ref. thomas_new vs. 2.7% used in this work).
One of the main purposes of this work is to illustrate the impact of kilometer experiments to the results of Mention et al. anom . Therefore, we have adapted the same neutron life time (885.7s) as in Mention et al. anom . The current recommended neutron lifetime from the 2012 Particle Data Group PDG is 880.1s. Using the latest neutron life time would lead to about 0.63% reduction in the average ratio.
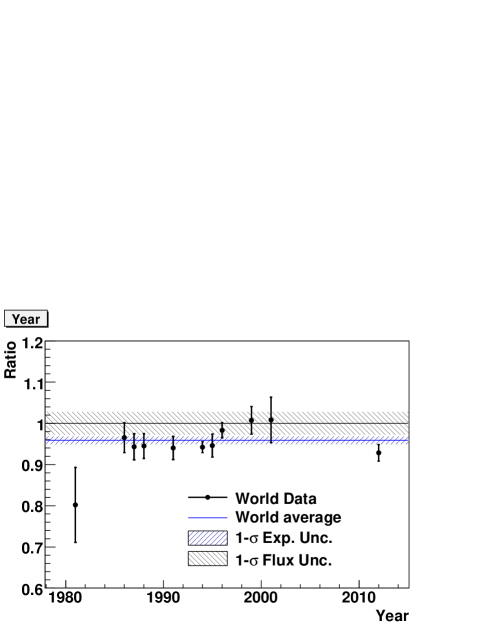
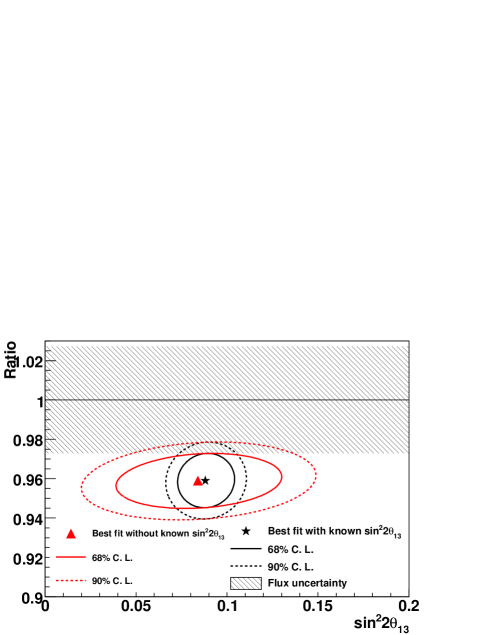
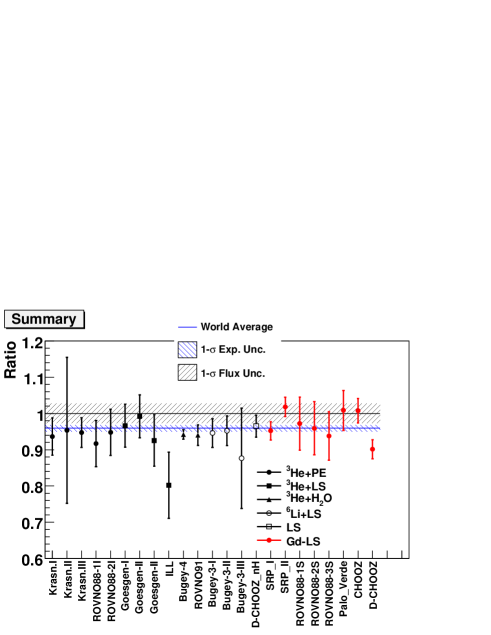
Fig. 3 shows results from all 23 experiments again arranged by the detector technology. Five different technologies were used in the 23 experiments to record the capture on protons. In the ILL ILL and Goesgen experiments Goes the liquid scintillator targets cells were interspaced with the 3He neutron counters. In the Bugey-3 experiments Bugey3_1 ; Bugey3_2 the liquid scintillator was loaded with 6Li to detect the neutron captures. In the Bugey-4 Bugey4 and Rovno91 Rovno91 only the neutron captures were detected. The detector in these two experiments consisted of a water target with embedded 3He detectors. In the Krasnoyarsk Krasn and Rovno88 Rovno88 experiments again only the total capture rates were measured. The detectors consisted of the polyethylene neutron moderator with 3He neutron counters embedded in them. Finally, the Savannah River experiments SRP , the Rovno88 Rovno88 and the Chooz, Palo Verde and Double Chooz experiments DChooz1 222 In Double Chooz n-H analysis DChooz2 , the neutrino events are largely generated in the liquid scintillator region without the Gd loading. use the Gd loaded liquid scintillators. The Daya Bay and RENO experiments are employing that technology as well. The results from the Gd loaded scintillator experiments are, with the exception of Double Chooz, in general higher than the new world average.
We should also note that the experiments with Gd loaded scintillator were in general carried out at a later time. In Fig. 4 we show the same data, but now arranged as a function of the year when the corresponding measurements were published. One can see that the more recent experiments, except the Double Chooz, appear to have higher rates than the earlier ones. If such tendency is true, it could either be due to difference in detector technologies or improvement in data acquisition or analysis methods. However, the of the global fit, /Dof = 23.8/22, signifies that the 23 reactor flux determinations are mutually consistent. Therefore, our observation might be simply due to statistical fluctuations.
In addition, we also use these 23 experiments to extract by minimizing the in Eq. (4) without the penalty term (). The best-fit is determined to be 0.084 0.030 (one dimension: ). The non-zero is dominated by the latest Double Chooz results, and is also consistent with the latest Daya Bay results dayabay_cpc . Fig. 5 shows the best-fit and ratio with and without the Daya Bay constrains. The corresponding 68% (two dimensions: ) and 90% (two dimensions: ) confidence intervals are shown as well. The correlation between the ratio and is rather weak due to the strong correlation between results from Double Chooz, which dominate the non-zero extraction from these 23 experiments, and result from Bugey-4, which is the most precise short baseline measurement. Therefore, it is not surprising that the precise value from Daya Bay, which is very close to the best fit value from these 23 experiments, does not improve the knowledge on the ratio.
IV Summary and Discussion
With the known , we include results from Palo Verde, Chooz, and Double Chooz, and re-evaluate the reactor antineutrino anomaly. The new world average is determined to be 0.959 0.009 (experiment uncertainty) 0.027 (flux systematics), when normalized to the predicted flux of Mueller et al. nspec2 . The new world average is about 1.4 lower than unity, weakening the significance of the reactor antineutrino anomaly. We also show that the analysis of all 23 experiments yields in agreement with its independently obtained value from the Daya Bay and RENO experiments.
The forthcoming absolute flux analysis of the Daya Bay, RENO, and Double Chooz experiments will clearly shed more light on this issue. The final answer to the question of agreement between the predicted reactor flux and the measured rate clearly depends on the results of these experiments as well as on the careful analysis of the predicted flux and its uncertainties.
The most popular explanation of the anomaly, if it turns out that it is statistically significant, is the existence of additional sterile neutrinos. The consistency of the rate of the short baseline neutrino experiments, demonstrated here and also e.g. in Ref. anom ; thomas_new suggests that such additional neutrinos must have large enough masses that the corresponding oscillation length is at most few meters. Experiments sensitive to such short oscillation length would be able to convincingly prove the existence of the sterile neutrino and allow determination of their masses and mixing angles.
| # | result | Det. type | 235U | 239Pu | 238U | 241Pu | ratio | (%) | (%) | L(m) | Year | |
| 1 | Bugey-4 | 3He + H2O | 0.538 | 0.328 | 0.078 | 0.056 | 0.942 | 3.0 | 3.0 | 15 | 0.999987 | 1994 |
| 2 | ROVNO91 | 3He + H2O | 0.614 | 0.274 | 0.074 | 0.038 | 0.940 | 3.9 | 3.0 | 18 | 0.999981 | 1991 |
| 22 | Double Chooz | Gd-LS | 0.496 | 0.351 | 0.087 | 0.066 | 0.860 | 3.7 | 3.0 | 998-1115 | 0.954 | 2012 |
| 23 | Double Chooz | LS (n-H) | 0.496 | 0.351 | 0.087 | 0.066 | 0.920 | 4.0 | 3.0 | 998-1115 | 0.954 | 2012 |
| 3 | Bugey-3-I | 6Li - LS | 0.538 | 0.328 | 0.078 | 0.056 | 0.946 | 4.8 | 4.8 | 15 | 0.999987 | 1995 |
| 4 | Bugey-3-II | 6Li - LS | 0.538 | 0.328 | 0.078 | 0.056 | 0.952 | 4.9 | 4.8 | 40 | 0.999907 | 1995 |
| 5 | Bugey-3-III | 6Li - LS | 0.538 | 0.328 | 0.078 | 0.056 | 0.876 | 14.1 | 4.8 | 95 | 0.999479 | 1995 |
| 6 | Goesgen-I | 3He + LS | 0.620 | 0.274 | 0.074 | 0.042 | 0.966 | 6.5 | 6.0 | 38 | 0.999916 | 1986 |
| 7 | Goesgen-II | 3He + LS | 0.584 | 0.298 | 0.068 | 0.050 | 0.992 | 6.5 | 6.0 | 45 | 0.999883 | 1986 |
| 8 | Goesgen-III | 3He + LS | 0.543 | 0.329 | 0.070 | 0.058 | 0.925 | 7.6 | 6.0 | 65 | 0.999756 | 1986 |
| 9 | ILL | 3He + LS | 1 | - | - | - | 0.802 | 9.5 | 6.0 | 9 | 0.999995 | 1981 |
| 10 | Krasn. I | 3He + PE | 1 | - | - | - | 0.936 | 5.8 | 4.9 | 33 | 0.999937 | 1987 |
| 11 | Krasn. II | 3He + PE | 1 | - | - | - | 0.953 | 20.3 | 4.9 | 92 | 0.999511 | 1987 |
| 12 | Krasn. III | 3He + PE | 1 | - | - | - | 0.947 | 4.9 | 4.9 | 57 | 0.999812 | 1987 |
| 13 | SRP-I | Gd-LS | 1 | - | - | - | 0.952 | 3.7 | 2.7 | 18 | 0.999981 | 1996 |
| 14 | SRP-II | Gd-LS | 1 | - | - | - | 1.018 | 3.8 | 2.7 | 24 | 0.999967 | 1996 |
| 15 | ROVNO88-1I | 3He + PE | 0.607 | 0.277 | 0.074 | 0.042 | 0.917 | 6.9 | 5.7 | 18 | 0.999981 | 1988 |
| 16 | ROVNO88-2I | 3He + PE | 0.603 | 0.276 | 0.076 | 0.045 | 0.948 | 6.9 | 5.7 | 18 | 0.999981 | 1988 |
| 17 | ROVNO88-1S | Gd-LS | 0.606 | 0.277 | 0.074 | 0.043 | 0.972 | 7.8 | 7.2 | 18 | 0.999981 | 1988 |
| 18 | ROVNO88-2S | Gd-LS | 0.557 | 0.313 | 0.076 | 0.054 | 0.959 | 7.8 | 7.2 | 25 | 0.999964 | 1988 |
| 19 | ROVNO88-3S | Gd-LS | 0.606 | 0.274 | 0.074 | 0.046 | 0.938 | 7.2 | 7.2 | 18 | 0.999981 | 1988 |
| 20 | Palo Verde | Gd-LS | 0.60 | 0.27 | 0.07 | 0.06 | 0.975 | 6.0 | 2.7 | 750-890 | 0.967 | 2001 |
| 21 | Chooz | Gd-LS | 0.496 | 0.351 | 0.087 | 0.066 | 0.961 | 4.2 | 2.7 | 998-1115 | 0.954 | 1999 |
Acknowledgments We would like to thank R. D. McKeown and W. Wang for fruitful discussions. This work was supported in part by Caltech, the National Science Foundation, and the Department of Energy under contracts DE-AC02-98CH10886.
References
- [1] Th. A. Mueller et al. Phys. Rev., C83:054615, 2011.
- [2] G. Mention et al. Phys. Rev., D83:073006, 2011.
- [3] M. Apollonio et al. Phys. Lett., B466:415, 1999.
- [4] M. Apollonio et al. Eur. Phys. J., C27:331, 2003.
- [5] F. Boehm et al. Phys. Rev., D64:112001, 2001.
- [6] Y. Abe et al. Phys. Rev. Lett., 108:131801, 2012.
- [7] Y. Abe et al. Phys. Rev., D86:052008, 2012.
- [8] Y. Abe et al. arXiv:1301.2948 (2013).
- [9] F. P. An et al. Phys. Rev. Lett., 108:171803, 2012.
- [10] F. P. An et al. Nucl. Inst. Method, A685:78, 2012.
- [11] F. P. An et al. Chinese Phys., C37:011001, 2013.
- [12] J. K. Ahn et al. Phys. Rev. Lett., 108:191802, 2012.
- [13] J. Beringer et al. Phys. Rev., D86:010001, 2012.
- [14] Z. D. Greenwood et al. Phys. Rev., D53:6054, 1996.
- [15] A. O. Afonin et al. Sov. Phys. JETP, 67:213, 1988.
- [16] Y. Declais et al. Phys. Lett., B338:383, 1994.
- [17] E. Ciuffoli, J. Evslin, and H. Li. JHEP, 12:110.
- [18] M. C. Gonzalez-Garcia, M. Maltoni, J. Salvado, and T. Schwetz. JHEP, 1212:123, 2012.
- [19] P. Anselmann et al. Phys. Lett., B342:440, 1995.
- [20] W. Hampel et al. Phys. Lett., B420:114, 1998.
- [21] J. N. Abdurashitov et al. Phys. Rev. Lett., 77:4708, 1996.
- [22] J. N. Abdurashitov et al. Phys. Rev., C59:2246, 1999.
- [23] J. N. Abdurashitov et al. Phys. Rev., C73:045805, 2006.
- [24] J. N. Abdurashitov et al. Phys. Rev., C80:015807, 2009.
- [25] C. Giunti and M. Laveder. Phys. Rev., C83:065504, 2011.
- [26] Soo-Bong Kim, private comminication.
- [27] P. Huber. Phys. Rev., C84:024617, 2011.
- [28] H. Kwon et al. Phys. Rev., D24:1097, 1981.
- [29] G. Zacek et al. Phys. Rev., D34:2621, 1986.
- [30] B. Achkar et al. Nucl. Phys., B534:503, 1995.
- [31] B. Achkar et al. Phys. Lett., B374:243, 1996.
- [32] A. I. Alfonin et al. JETP, 67:213, 1998.
- [33] G. S. Vidyakin et al. JETP Lett., 59:390, 1994.