Magnetoelastic coupling and charge correlation lengths in a twin domain of Ba(Fe1-xCox)2As2 (): A high-resolution X-ray diffraction study
Abstract
The interplay between structure, magnetism and superconductivity in single crystal Ba(Fe1-xCox)2As2 (x=0.047) has been studied using high-resolution X-ray diffraction by monitoring charge Bragg reflections in each twin domain separately. The emergence of the superconducting state is correlated with the suppression of the orthorhombic distortion around T, exhibiting competition between orthorhombicity and superconductivity. Above T, the in-plane charge correlation length increases with the decrease of temperature, possibly induced by nematic fluctuations in the paramagnetic tetragonal phase. Upon cooling, anomalies in the in-plane charge correlation lengths along () and axes () are observed at T and also at T indicative of strong magnetoelastic coupling. The in-plane charge correlation lengths are found to exhibit anisotropic behavior along and perpendicular to the in-plane component of stripe-type AFM wave vector (101)O below around T. The temperature dependence of the out-of-plane charge correlation length shows a single anomaly at T, reflecting the connection between Fe-As distance and Fe local moment. The origin of the anisotropic in-plane charge correlation lengths and is discussed on the basis of the antiphase magnetic domains and their dynamic fluctuations.
pacs:
74.25.Ha, 74.70.Xa, 75.30.Fv, 75.50.EeI Introduction
In the recently discovered iron-based superconductors Kamihara2008 ; Aswathy2010 , the superconducting temperatures are found to be in close proximity to an antiferromagnetic (AFM) and a tetragonal-orthorhombic (T-O) structural transitions. It turns out that the suppression of both the AFM and the T-O structural transitions, by doping or by pressure, eventually induces superconductivity. These phenomena beg the question about the role of spin and lattice degrees-of-freedom in the emergence of superconductivityAswathy2010 ; Fernandes2010 . Several theoretical descriptions have been proposed to interpret the relationship between the structural and AFM transitions on the basis of orbital ordering or by introducing an intermediate spin-nematic phase resulting from an effective local-spin model or from an itinerant model both with equivalent consequences.Fernandes2010 ; Barzykin2009 ; Cano2010 ; Fernandes2012 Although different in details, these descriptions emphasize the importance of the magnetoelastic coupling in driving the two transitions simultaneously or separately. Canoet al. Cano2010 studied the interplay between the elastic and spin degrees-of-freedom in iron pnictide superconductors using a Ginzburg-Landau approach, indicating that the magnetoelastic coupling can bring about the particular features of the structural and magnetic transitions in these systems including the emergence of the collinear stripe-type AFM ordering. Recently, a microscopic study Paul2011 of a simple symmetry-allowed model Hamiltonian demonstrated that due to the effect of magnetoelastic coupling, the considerable orthorhombic elastic softening is caused by critical spin fluctuations present in the system before magnetic order occurs. This may explain why the AFM transition is often preceded by the T-O structural transition. It should be pointed out that this picture is similar to the nematic phase modelFernandes2010 ; Fernandes2012 . To date, there are very few experimental reports on the magnetoelastic effect in iron pnictides and such reports investigated the role that magnetoelastic effect plays in the structural and magnetic transitions under the application of external driving forces. Magnetoelastic effects have been demonstrated by applying pressure to CaFe2As2 and inducing an O-T and AFM-to-nonmagnetic transitionsKreyssig2008 , or by applying shear stress to BaFe2(As1-xPx)2 that shifts the magnetic transition and superconducting critical temperatures significantly.Kuo2012 Therefore, it is of interest to study the possibly intrinsic magnetoelastic effect in iron-based superconductors, without introducing any external driving force.
The Co-doped BaFe2As2 system exhibits a rich phase diagram with a complex interplay between the structural, magnetic, and superconducting phases.Nandi2010 ; Pratt2009 ; Ni2008 ; Chu2009 In the parent BaFe2As2 compound, the AFM ordering transition at T coincides with a T-O structural transition at T. Upon doping both transitions gradually separate, such that T T, accompanied with the appearance of superconductivity above in Ba(Fe1-xCox)2As2. It is interesting to point out that the orthorhombic distortion in Ba(Fe1-xCox)2As2 with lower Co content () shows one clear anomaly at the magnetic transition temperature T, but it is absent at T for superconductor with intermediate Co content. For higher than 0.066, both the magnetic and structural transitions are completely suppressed and superconducting transition is the only transition observed. Only in an intermediate composition region of , does Ba(Fe1-xCox)2As2 exhibit a coexistence of superconductivity, O-structure and AFM phases providing potential candidates to investigate the effects of the magnetoelastic coupling. However,the tendency of these crystals to form twinned orthorhombic domains has hampered definitive determination of inherent features of the intermediate phase between T and T where the presumed nematic phase exists. Therefore, there have been extensive efforts to de-twin these crystals Chu2010 to establish the underlying electronic, structural, and magnetic anisotropies that characterize this intermediate phase. Motivated by these issues, we set out to investigate anisotropic features of the crystal structure and domain formation over a wide range of temperatures using high resolution x-ray diffraction methods that reveals the intrinsic magnetoelastic coupling in the Ba(Fe1-xCox)2As2 () superconductor. The high resolution allows us to separately monitor Bragg reflections of different orthorhombic twin domains and study their temperature evolution, as has been done recently on CeFeAsOLi2011 .
II Experimental Details
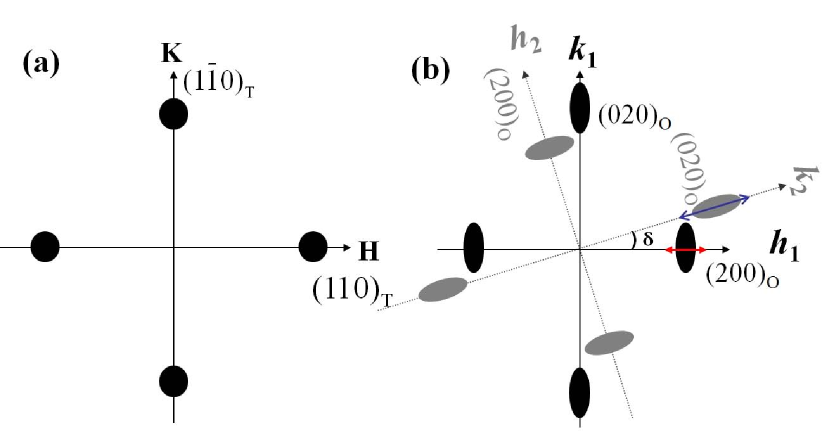
The Ba(Fe1-xCox)2As2 () crystal was grown using a self-flux solution method as described previouslyNi2008 ; Kim2011 . The crystal has been characterized by X-ray diffraction, neutron scattering, magnetization, resistivity and heat capacity, identifying reported three transitions, structural at T K, magnetic at T K and SC at T K.Pratt2009 ; Kim2011 A plate-like piece of crystal with its -axis perpendicular to its surface was chosen for investigations by high-resolution x-ray scattering technique using the six-circle diffractometer of the 6-ID-B beamline at the Advanced Photon Source (APS), Argonne National Laboratory (X-ray energy kept at 8 keV). The scattering geometry of our experiment is similar to that used previously by Li et al.Li2011 . We use orthorhombic indices at all temperatures so that the tetragonal (HKL) indices are provided in terms of the twin domains in the orthorhombic structure with the following conversion and . The crystal was mounted at the end of the cold-finger of a Displex cryogenic refrigerator with access to ()O and high index ()O Bragg reflections. Flux intensity on the sample was optimized to eliminate beam heating effects of the sample while maintaining a reasonable signal to noise ratio. To achieve that, slit setups and attenuations yielding Bragg reflection intensities that scaled with beam attenuations were chosen. In this regard, it should be noted that the low thermal conductivity in the SC state required a significant increase of beam attenuation to prevent sample-heating during measurements. These considerations limited the choice of setups, i.e., resolution, but as discussed below, by adequate analytical tools we captured the intrinsic behavior (i.e., charge correlation lengths, in particular) of this system. As demonstrated on the CeFeAsOLi2011 , the twin domains are uniformly rotated and separated in reciprocal space by a microscopic shear-angle enabling the characterization of each domain. Fig. 1 shows schematically a limited in-plane reciprocal zone with the (110)T of the untwinned crystal (a) that transforms to the (200)O and (020)O in the orthorhombic symmetry notation (b). The misfit angle between the two domains is determined by the orthorhombic distortion ( ).Li2011 The arrows in Fig. 1 show typical scans performed at Bragg reflections. In the present study, we monitored the (208)O/(028)O systematically (corresponding to (118) at high temperatures) and also the (008)O, as a function of temperature.
III Results and Discussion
Fig. 2(a) shows the evolution of the orthorhombicity as the temperature decreases with a sharp splitting of the (118)T into the (208)O and (028)O at T K. With further decrease in temperature, the orthorhombicity increases without displaying an anomaly at T K (see the inset of Fig. 2(a)), which is consistent with the report by Kim et al. Kim2011 . A slight decrease in the splitting is observed below the SC temperature T, indicating that superconductivity and the orthorhombic distortion are coupled.Nandi2010 . Note that for higher Co substitution, the suppression of orthorhombic order parameters becomes larger. For example, the orthorhombic distortion in is completely suppressed and the reentrant transition to tetragonal structure occurs below T. When increases to 0.066, the orthorhombic distortion vanishes and no T-O transition is observed.Nandi2010 From Fig. 2 (a), we point out that the in-plane lattice constant shrinks linearly in the tetragonal phase of Ba(Fe1-xCox)2As2 with decreasing temperature at a rate of Å/K per unit cell (linear thermal expansion parameter /K). By contrast, the thermal expansion along the -axis is weakly quadratic (Fig. 2(b)) with no abrupt anomaly at T and displays a deviation from the quadratic form near T (a weak minimum is observed in c-axis lattice parameter for (20l)O reflection as shown in the inset of Fig.2(b)). The effect of magnetic transition at T on the lattice parameter implies a coupling between them, which will be discussed below.
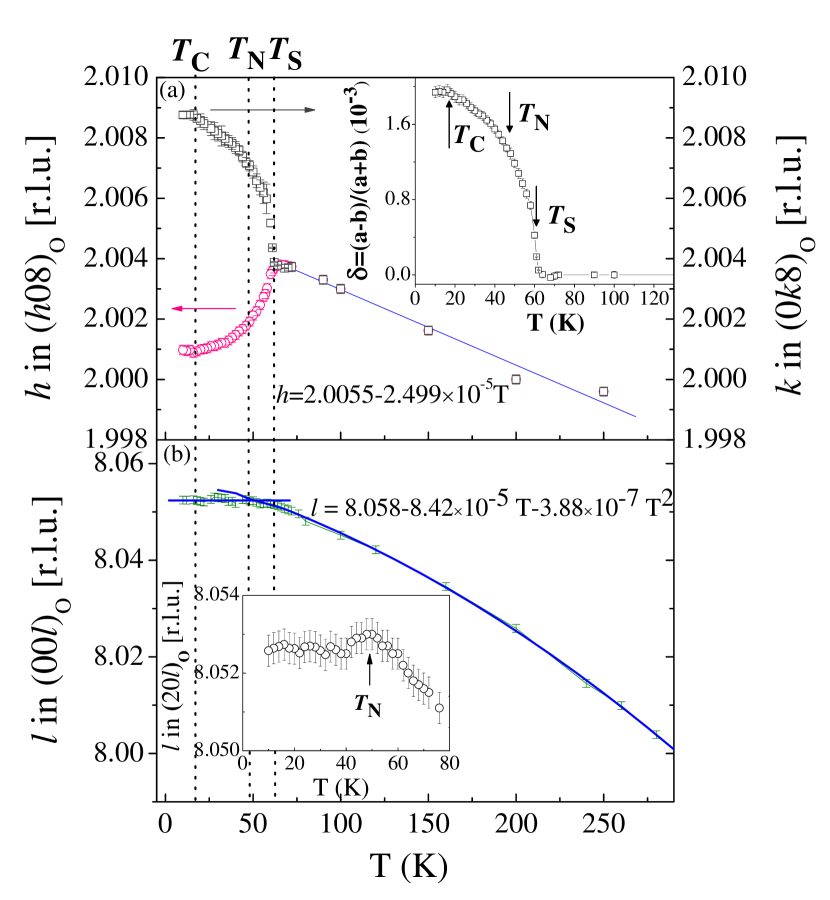
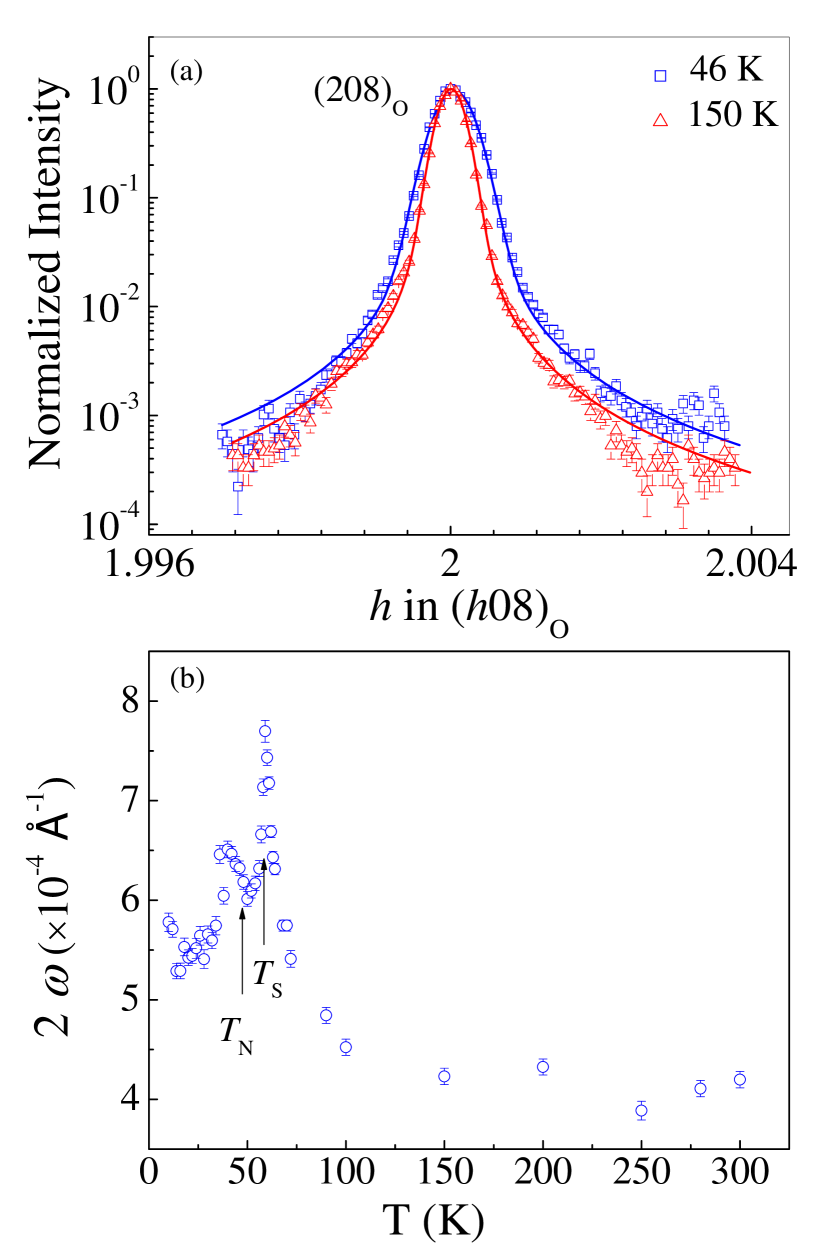
Fig. 3(a) shows representative in-plane scans along for the (208)O Bragg reflection at 150 K (above T) and 46 K (below T). It is clear that the full width at half maximum (FWHM) of the Bragg peak is broader below T. Variation in the line broadening can be due to changes in coherence length, domain size, mosaic distributions, and more likely a combination of all three. To obtain quantitative evaluation of peak line-widths, these and other scans were initially modeled as a Gaussian, a Lorentzian, their linear combination, or Pseudo-Voigt line-shapes, but none of these lineshapes yielded satisfactory agreement with the data. We therefore adopted a standard convolution method by systematically folding a Gaussian resolution function and a Lorentzian function that reflects an exponentially decaying charge (chemical) coherence length as follows,
| (1) |
where and , such that and are the FWHM of the Gaussian and Lorentzian functions in reciprocal space, respectively. Our resolution was high enough to resolve the twin domains separately, i.e., optimizing peak intensity of the (208)O from one twin domain and that of the (028)O of the other domain required sample rotation between the two peaks as has been done for CeFeAsOLi2011 . While the FWHM of the Lorentzian function () represents the intrinsic width of the sample, we should note that the Gaussian function in Eq. (1) has two contributions: one from geometrical setup (i.e., incident and scattered beam divergence) and the other from the mosaic spread of the studied crystal (see a detailed discussion in resolution function in Ref. Cowley1987 ). It is by now well established that the mosaic spread of typical pnictides undergoing shear induced O-T transition exhibit mosaic spread changes due to stresses during the transitions. We therefore attribute the temperature dependence of the Gaussian width as arising primarily from the variation in the mosaic distributions. Fig. 3(b) shows the FWHM of the Gaussian function for the (208)O along as a function of temperature indicating anomalies that can be related to the stresses introduced by the structural and magnetic transitions in the system.
The temperature evolutions of the intrinsic width () extracted from the Lorentzian functions of (208)O and (028)O Bragg peaks are shown in Fig.4(a). It is evident that anomalies are observed at both T and T. Similar observation by using high-resolution x-ray diffraction was reported in different systems TbV1-xAsxO4 (x=0 and 1) Rule2008 , where the intrinsic width of the Bragg peaks shows a clear peak at their T that is reminiscent of anomalies in the heat capacity. Note that the intrinsic width in unit of , i.e., the FWHM of the Lorentzian profiles from X-ray scattering in reciprocal space corresponds to the inverse charge correlation length Li2011 ; Rule2008 ; Feng2012 ; Lorenzo2008 :
| (2) |
Thus, the temperature dependence of the in-plane charge correlation lengths along and normal to the in-plane component of AFM propagation wavevector (101)O, i.e., longitudinal charge correlation length (along the AFM bond direction) and transverse charge correlation length (along the ferromagnetic bond direction), can be derived from the intrinsic widths of (208)O and (028)O Bragg peaks. As illustrated in Fig.4 (b), both and show two clear peaks at T and T, respectively. With the decrease of temperature to T, the in-plane charge correlation lengths increase gradually, followed by a rapid decrease below T. When the temperature approaches T, the in-plane charge correlation lengths increase again. It is worth emphasizing that the Bragg reflections used to extract these data are not allowed by the symmetry of the magnetic structure of the ordered iron moments and they are strictly the result of charge (nuclei) ordering. Interestingly, the intrinsic width and charge correlation length obtained from the high-resolution X-ray data show a clear anomaly at the magnetic transition temperature, suggesting these charge Bragg reflections are sensitive to the spin-structure and fluctuations. This is presumably due to the strong magneto-elastic coupling that exerts secondary effects on charge correlations, domain formation and their shape.
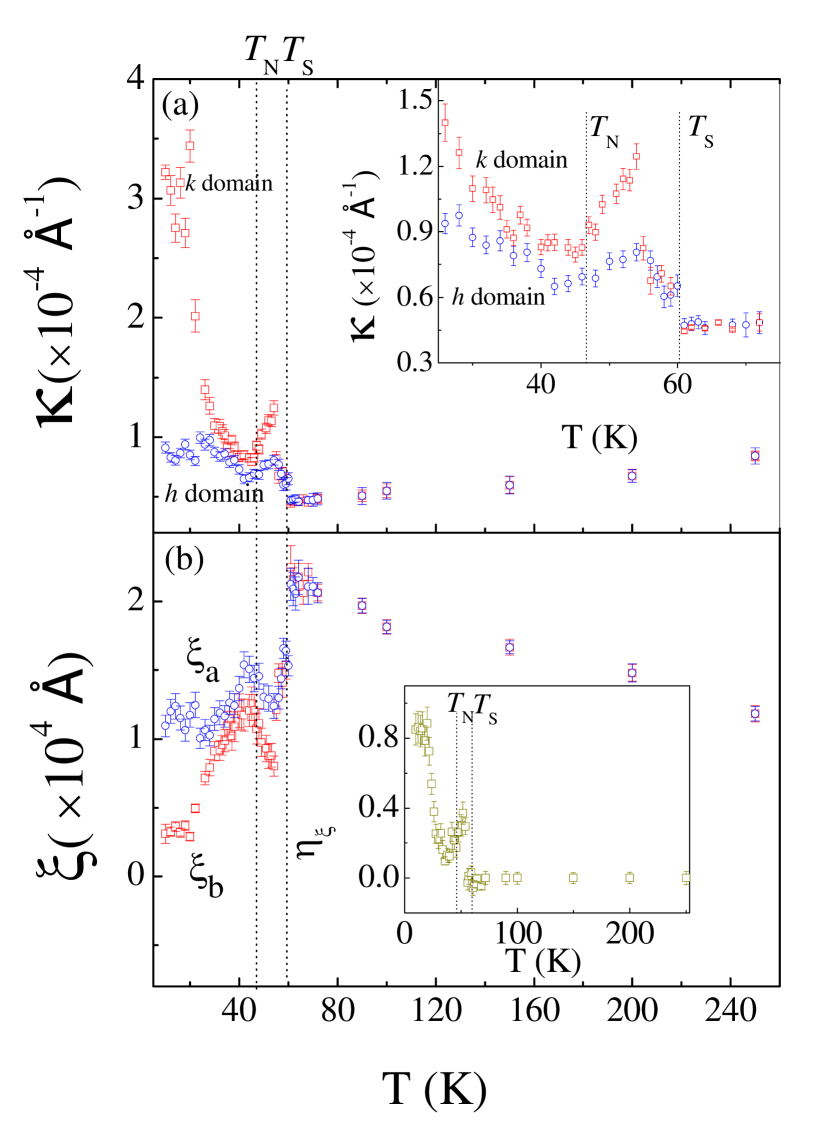
Below around T, we notice that the charge correlation lengths along and normal to the in-plane component of AFM propagation wavevector (101)O are different (), displaying an anisotropic behavior. The anisotropy in charge correlation length is defined asTucker2012
| (3) |
=0 indicates isotropic correlations (=), whereas =1 (=-1) corresponds to the extreme case of () for structural domains consisting of long linear stripes. Based on this equation, we have derived the anisotropy of the charge correlation length as a function of temperature, as shown in the inset of Fig. 4. The anisotropy is most pronounced below T, with values ranging from 0.1 to 0.8 as the temperature is lowered.
A possible scenario to interpret the anisotropic charge correlation lengths along and below around T in may be related to the presence of the antiphase magnetic domains Mazin2009 ; Yin2009 ; Li2012 . Mazin and Johannes Mazin2009 first proposed that antiphase domains and their dynamic fluctuations are central for understanding the high-T ferropnictides. Very recently, Li et.al Li2012 observed surface-pinnned antiphase domains in BaFe2As2 using high-resolution scanning tunneling microscopy. Since the energy differences between the AFM stripe magnetic structure and other AFM patterns are small Mazin2009 , it is highly possible that many antiphase magnetic boundaries are formed. The antiphase domains are pinned at T T, and show dynamic fluctuations in the region of T T T. There are two kinds of simple antiphase domains (labeled A and B) with boundaries along and axes, as shown in Fig. 5. Due to the same magnetoelastic interactions that lead to a difference in the ferromagnetic and AFM bond lengths in the orthorhombic structure, we propose that the formation of such antiphase domains are accompanied by elastic distortions at their boundaries. The antiphase boundaries along axis influence the magnitude of transverse charge correlation length , whereas the antiphase boundaries along axis affect the longitudinal charge correlation length . Differences in the density of antiphase boundaries in the two directions eventually leads to the anisotropy in and below T. The dynamic fluctuations of the antiphase domains may be responsible for the anisotropy in charge correlation lengths in the small temperature region above T (but lower than T), as shown in the inset of Fig. 4 (b).
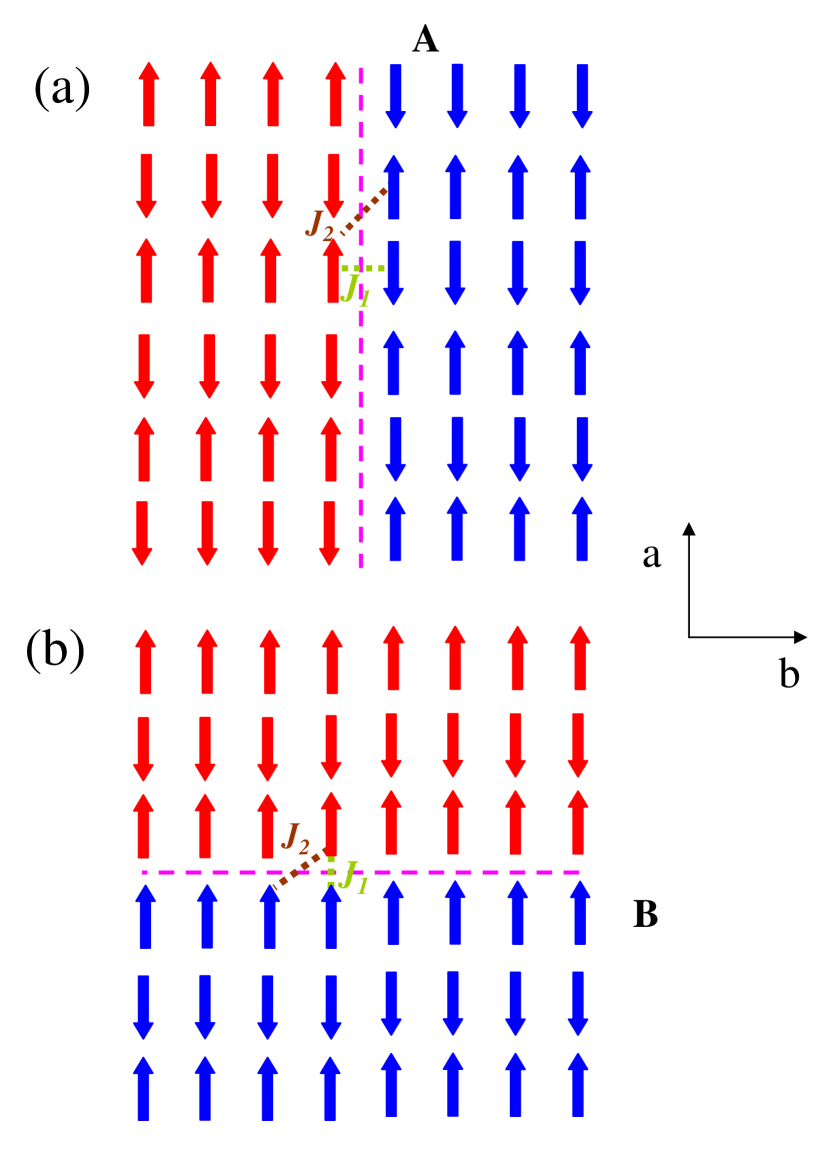
Based on such antiphase magnetic domain scenario and the model, the anisotropic charge correlation lengths can be used to estimate the ratio of the magnetic exchange parameters and . As shown in Fig. 5, the energies per-spin (S) for forming these two kinds of antiphase boundaries are given by
| (4) |
| (5) |
Since is AFM, the number of antiphase domain boundaries and should scale inversely with the magnetic energy of the domain wall so that
| (6) |
The charge correlation length scales inversely proportional to the number of boundaries, i.e., . Thus,
| (7) |
In Fig. 4 (b), we observe at low temperatures and from Eq. (6) we can get , which is consistent with the previous calculations or experiments on other iron pnictides, such as LaFeAsO Ma2008 and Ba(Fe1-xCox)2As2 ()Li2008 . This is also reasonable for producing a stripe-type AFM structure that requires .
It is worthwhile noting that the in-plane charge correlation lengths show gradual changes at temperatures significantly above T, probably due to magnetic fluctuations that are known to persist above T in similar pnictidesDiallo2010 ; Li2009 . We point out that this feature may support the nematic model. In the nematic modelFernandes2010 ; Fernandes2012 , the nematic order coincides with the structural transition with the notion that the driving force for the transition is not elastic in origin but magnetically driven by Ising-like interpenetrating AFM domainsFernandes2010 ; Paul2011 . Nematic (magnetic) fluctuations remain at higher temperature above T, which has been suggested by various techniques, such as susceptibility anisotropy Kasahara2012 , shear modulusFernandes2010 , inelastic neutron scatteringHarriger2011 , and anisotropic in-plane resistivityChu2010 .
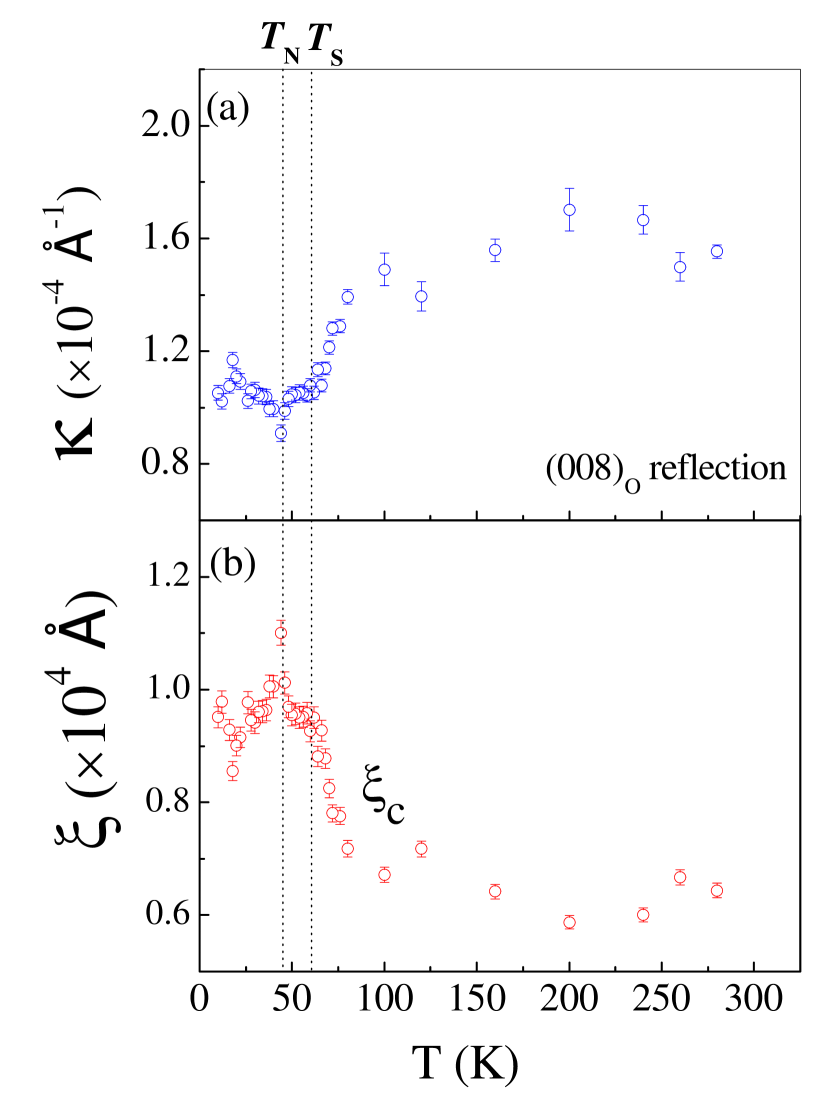
We now turn to a discussion of the -axis charge correlation length. Fig. 6(a) and (b) show the temperature dependence of the intrinsic width of the (008)O Bragg reflection and the corresponding out-of-plane charge correlation length along axis (), respectively. A single anomaly at the magnetic transition temperature T and a gradual change above and through T, are observed. The absence of sharp anomaly in suggests that atomic distortions resulting from the T-O structural transition mainly occur in the plane. This is consistent with the fact that the in-plane lattice parameters and change significantly, but changes weakly around T, as can also be seen from Fig. 2. Both the out-of-plane charge correlation length and lattice parameter show an anomaly at T, showing close correlation between the AFM magnetic transition and the modification of structure along axis. Recent experiments and calculations reveal that the Fe local moment is very sensitive to the Fe-As distance in iron pnictides. Yin et al. Yin2008 performed density functional theory (DFT) calculations within the generalized gradient approximation and found the Fe-Fe transverse exchange coupling is strongly dependent on both the AFM symmetry and the Fe-As distance. Belashchenko et al.Belashchenko2008 demonstrated that in layered iron-pnictide compounds, as the Fe-As distance is decreased, the degree of itinerancy of Fe moments increase. Moreover, the coupling between the local moment and the Fe-As distance is controlled by strong covalent Fe-As bonding. Recently, neutron diffraction studies of CeFeAs1-xPxO Cruz2010 and DFT calculations Lee2010 demonstrated that a decrease in Fe-As distance induces strong hybridization between Fe 3d and As 4p orbitals, leading to quenched Fe magnetic moments. Therefore, the AFM transition at T is coupled to the change of Fe-As distance, which leads to the anomalies in the out-of-plane charge correlation length and lattice parameter .
In summary, high resolution X-ray diffraction studies on structural Bragg reflections of the SC and AFM Ba(Fe1-xCox)2As2 (=0.047) single crystal reveal secondary effect stemming from the magnetic properties of the system, which is understood to result from intrinsic and strong magnetoelastic coupling. In addition to showing anomalies around the structural and magnetic transitions, the in-plane charge charge correlation lengths along and axes show anisotropy below around T, which probably results from the effect of antiphase boundaries formed along and axes. Employing our anisotropic charge correlation lengths, we are able to estimate the ratio of to be around 1 on the basis of such antiphase magnetic domain scenario and model. The out-of-plane charge correlation length and lattice parameter exhibit a single anomaly at T, which can be associated with the modification of Fe-As distance when the AFM transition occurs. Our results also show gradual evolution of the Bragg peak widths and in-plane charge correlation length above T, which is presumably induced by the nematic magetic fluctuations up to almost 200 K.
IV Acknowledgements
Research at Ames Laboratory is supported by the US Department of Energy, Office of Basic Energy Sciences, Division of Materials Sciences and Engineering under Contract No. DE-AC02-07CH11358. Use of the Advanced Photon Source at Argonne National Laboratory was supported by the US Department of Energy, Office of Science, Office of Basic Energy Sciences, under Contract No. DE-AC02-06CH11357
References
- (1) Y.Kamihara,Y. Kamihara, T. Watanabe, M. Hirano, and H. Hosono, J. Am. Chem. Soc. 130, 3296 (2008).
- (2) P M Aswathy, J B Anooja, P M Sarun and U Syamaprasad, Supercond. Sci. Technol. 23, 073001 (2010).
- (3) R. M. Fernandes, L. H. VanBebber, S. Bhattacharya, P. Chandra, V. Keppens, D. Mandrus, M. A. McGuire, B. C. Sales, A.S. Sefat, J. Schmalian, Phys. Rev. Lett. 105, 157003 (2010).
- (4) V. Barzykin and L. P. Gor’kov, Phys. Rev. B 79, 134510 (2009).
- (5) A. Cano, M. Civelli, I. Eremin, and I. Paul, Phys. Rev. B 82, 020408 (2010).
- (6) R. Fernandes and J. Schmalian, Supercond. Sci. Technol. 25, 084005 (2012).
- (7) I. Paul, Phys. Rev. Lett. 107, 047004 (2011).
- (8) A. Kreyssig, M. A. Green, Y. Lee, G. D. Samolyuk, P. Zajdel, J. W. Lynn, S. L. Bud’ko, M. S. Torikachvili, N. Ni, S. Nandi, J. B. Leao, S. J. Poulton, D. N. Argyriou, B. N. Harmon, R. J. McQueeney, P. C. Canfield, and A. I. Goldman, Phys. Rev. B 78, 184517 (2008).
- (9) H-.H. Kuo, James G. Analytis, J.-H. Chu, R. M. Fernandes, J. Schmalian, I. R. Fisher, Phys. Rev. B 86, 134507 (2012).
- (10) S. Nandi, M. G. Kim, A. Kreyssig, R. M. Fernandes, D. K. Pratt, A. Thaler, N. Ni, S. L. Bud’ko, P. C. Canfield, J. Schmalian, R. J. McQueeney, and A. I. Goldman, Phys. Rev. Lett. 104, 057006 (2010).
- (11) D. K. Pratt, W. Tian, A. Kreyssig, J. L. Zarestky, S. Nandi, N. Ni, S. L. Bud’ko, P. C. Canfield, A. I. Goldman, and R. J. McQueeney, Phys. Rev. Lett. 103, 087001 (2009).
- (12) N. Ni, M. E. Tillman, J. Q. Yan, A. Kracher, S. T. Hannahs, S. L. Bud’ko, and P. C. Canfield, Phys. Rev. B 78,214515 (2008).
- (13) J.-H. Chu, J.G. Analytis, C. Kucharczyk, and I. R. Fisher, Phys. Rev. B 79, 014506 (2009).
- (14) J.-H. Chu,J. G. Analytis, D. Press, K. DeGreve, T. D. Ladd,Y. Yamamoto, and I. R. Fisher, Science 329, 824 (2010).
- (15) H.-F. Li, J.-Q. Yan, J. W. Kim, R. W. McCallum, T. A. Lograsso1, and D. Vaknin, Phys. Rev. B 84, 220501(R) (2011).
- (16) M. G. Kim, R. M. Fernandes, A. Kreyssig, J. W. Kim, A. Thaler, S. L. Bud’ko, P. C. Canfield,R. J. McQueeney, J. Schmalian, and A. I. Goldman, Phys. Rev. B 83, 134522 (2011).
- (17) R. A. Cowley, Acta Cryst. A43, 825 (1987).
- (18) K. C. Rule, M. J. Lewis, H. A. Dabkowska, D. R. Taylor, and B. D. Gaulin, Phys. Rev. B 77, 134116 (2008).
- (19) Yejun Feng, Jiyang Wang, R. Jaramillo, Jasper van Wezel, S. Haravifard, G. Srajer, Y. Liu, Z.-A. Xu, P. B. Littlewood, T. F. Rosenbaum, Proc. Nat. Acad. Sci. 109, 7224 (2012).
- (20) J. E. Lorenzo,C. Mazzoli, N. Jaouen, C. Detlefs, D. Mannix, S. Grenier,Y. Joly, and C. Marin,Phys. Rev. Lett. 101, 226401 (2008).
- (21) G. S. Tucker, R. M. Fernandes, H.-F. Li, V. Thampy, N. Ni, D. L. Abernathy, S. L. Bud’ko1, P. C. Canfield, D. Vaknin, J. Schmalian, and R. J. McQueeney, Phys. Rev. B 86, 024505 (2012).
- (22) I.I.Mazin and M. D. Johannes,Nat. Phys. 5, 141 (2009).
- (23) Z. P. Yin and W. E. Pickett, Phys. Rev. B 80, 144522 (2009)
- (24) Guorong Li, Xiaobo He, Jiandi Zhang, Rongying Jin, A. S. Sefat, M. A. McGuire, D. G. Mandrus, B. C. Sales, and E. W. Plummer, Phys. Rev. B 86, 060512(R) (2012).
- (25) F. Ma, Z.-Y. Lu, and T. Xiang, Phys. Rev. B 78, 224517 (2008)
- (26) H.-F. Li, C. Broholm, D. Vaknin, R. M. Fernandes, D. L. Abernathy, M. B. Stone, D. K. Pratt, W. Tian, Y. Qiu, N. Ni, S. O. Diallo, J. L. Zarestky, S. L. Bud’ko, P. C. Canfield, and R. J. McQueeney, Phys. Rev. B 82, 140503 (2010)
- (27) H.-F. Li, W. Tian, J. L. Zarestky, A. Kreyssig, N. Ni, S. L. Bud’ko, P. C. Canfield, A. I. Goldman, R. J. McQueeney, and D. Vaknin, Phys. Rev. B 80, 054407 (2009).
- (28) S. O. Diallo, D. K. Pratt, R. M. Fernandes, W. Tian, J. L. Zarestky, M. Lumsden, T. G. Perring, C. L. Broholm, N. Ni, S. L. Bud’ko, P. C. Canfield, H.-F. Li, D. Vaknin, A. Kreyssig, A. I. Goldman, and R. J. McQueeney, Phys. Rev. B 81, 214407 (2010).
- (29) S. Kasahara, H.J. Shi, K. Hashimoto, S. Tonegawa, Y. Mizukami, T. Shibauchi, K. Sugimoto, T. Fukuda, T. Terashima, Andriy H. Nevidomskyy, Y. Matsuda, Nature 486, 382 (2010).
- (30) L. W. Harriger, H.Q. Luo, M.S. Liu, C. Frost, J.-P. Hu, M. R. Norman, P. Dai, Phys. Rev. B 84, 054544 (2011).
- (31) Z. P. Yin, S. Lebe‘gue, M. J. Han, B. P. Neal, S.Y. Savrasov, and W. E. Pickett, Phys. Rev. Lett. 101, 047001 (2008).
- (32) K. D. Belashchenko and V. P. Antropov, Phys. Rev. B 78, 212505 (2008).
- (33) C. de la Cruz, W. Z. Hu, Shiliang Li, Q. Huang, J.W. Lynn, M. A. Green, G. F. Chen, N. L. Wang, H. A. Mook, Qimiao Si, and P. Dai, Phys. Rev. Lett. 104, 017204 (2010).
- (34) Y. Lee, D. Vaknin, H.-F. Li, W. Tian, J. L. Zarestky, N. Ni, S. L. Bud’ko, P. C. Canfield, R. J. McQueeney, and B. N. Harmon, Phys. Rev. B 81, 060406 (2010).