Effects of pulse collisions in a multilayer system with noninstantaneous cubic nonlinearity
Abstract
The numerical simulations of an ultrashort pulse propagation in a one-dimensional nonlinear photonic crystal are carried out. It is known that the relaxation of cubic nonlinearity is the reason for the effect of pulse self-trapping in such multilayer system. In this paper we study further implications of this effect. It is shown that the trapped light absorbs additional low-intensity pulses which cannot be self-trapped per se. On the other hand, such low-intensity pulses are subject of the so-called induced trapping when light gets trapped due to a collision of two such pulses. We consider the conditions for this effect in both cases of co- and counter-propagating pulses.
pacs:
42.65.Re, 42.65.Jx, 42.65.Ky, 42.65.HwI Introduction
It is known that nonlinear response of optical media is not generally instantaneous and is described by a certain settling time. This relaxation of nonlinearity can be neglected if the characteristic time of electromagnetic field (such as a pulse duration) is much greater than the relaxation time. However, in the modern era of ultrashort pulses, there is growing number of situations when this neglect cannot be justified. The standard means to calculate the relaxation of non-resonant cubic (Kerr) nonlinearity is the so-called Debye model Akhm ,
| (1) |
where is the nonlinear part of refractive index, the Kerr nonlinear coefficient, and the relaxation time. The latter depends on the specific mechanism of nonlinearity. In this paper it is assumed to be of the order of several femtoseconds.
The influence of non-instantaneousness of nonlinearity on optical response was studied in a number of works during last several decades. Not aiming to name all of them, we can call researches on laser beam self-focusing Fleck69 ; Aleshkevich ; Hanson , filament formation Fleck72 , parametric amplification Trillo , pulse compression Apanasevich , modulation instability Shih ; Velchev ; Leblond ; Zhang , pulse train generation SotoCrespo , soliton-array generation Cambournac , instability of speckle patterns Skipetrov , solitary pulse dynamics Liu ; Michel , optical switching Armaroli ; Ferreira , etc. In this paper we deal with ultrashort (femtosecond) pulse propagation in a one-dimensional nonlinear photonic crystal which is a set of periodically arranged dielectric layers. Such multilayer structure can be symbolically designated as ( is the number of pairs of layers of and type). One of the first studies of role of nonlinearity relaxation in such a system is the paper by Vlasov and Smirnov Vlasov where the problem of pulse compression was under investigation. In recent works Novit ; Novit1 ; Novit2 ; Novit3 the effect of pulse self-trapping in the photonic crystal due to relaxing nonlinearity was discovered and discussed. The present paper is a continuation of those researches, so that it is worth recalling briefly the main results obtained there.
It was shown Novit that the pulse of high enough intensity can be trapped inside the one-dimensional photonic crystal due to formation of dynamical nonlinear ”cavity”, or ”trap”. This trap appears only if both linear refractive index modulation and Kerr nonlinearity relaxation present. The range of pulse durations and relaxation times for such self-trapping effect to be observed in the multilayer system of several hundreds layers was studied as well: varies from a fraction of a femtosecond to more than fs, and from about fs to several hundreds fs. This corresponds to the fast electronic mechanism of Kerr nonlinearity. Though we do not mean any specific materials, it is believed that such nonlinear structures can be composed, for example, from doped glasses with rapidly relaxing nonlinearities. This leads to the requirement of comparatively high intensities of the pulses because of the well-known from experiments approximate proportionality Akhm . Nevertheless, the necessary peak intensities of the order of a hundred of GW/cm2 seems to be not excessively high for femtosecond pulses from the viewpoint of optical damage of the materials. Polymeric materials are worth to be mentioned due to both high nonlinearity coefficient and fast relaxation Meng that make them perspective for applications in the discussed situations. In Novit2 we studied in detail the conditions for self-trapping in different configurations of the structure (linear and nonlinear layers, focusing and defocusing nonlinearities, etc.) taking into account the correlation between the nonlinearity coefficient and the relaxation time mentioned above. Another problem studied is the spectral transformations of light pulses interacting with nonlinear photonic crystal in the regime of self-trapping Novit1 . In particular, under properly chosen conditions, it is possible to generate quasi-monochromatic radiation or quasi-continuum covering the whole band gap. Finally, the possibility of asymmetric light transmission due to pulse self-trapping was analyzed recently Novit3 .
In this paper we consider the situation of not a single pulse, but of many pulses inside the photonic crystal with relaxing nonlinearity. We are especially interested in investigation of interaction of probe pulses with the previously trapped radiation. This problem is studied in II. Another question is connected with possibility of light trapping due to a collision of two low-intensity pulses which are not trapped when propagate separately. This situation, which we call the induced trapping, is considered in III.
II Trapping of probe pulses
At first, let us state the main equations used in this paper. Propagation of an ultrashort pulse in a one-dimensional nonlinear photonic crystal is described by the Maxwell wave equation
| (2) |
where is the electric field strength, is the refractive index which depends on light intensity as
| (3) |
Here is the linear part of the refractive index varying periodically along the axis, and the nonlinear addition behaves according to Eq. (1). Further we consider femtosecond light pulses of Gaussian shape with the amplitude , where is the pulse duration. To analyze the interaction of such a pulse with a nonlinear photonic crystal, i.e. to solve self-consistently the system (1)–(3), we use the finite-difference time-domain method of numerical simulations which was described in detail in Ref. Novit . The stability of the algorithm used is governed by the well-known von Neumann condition , where and are the time and space steps, respectively. If the ratio of the steps is small enough (taking into account possible nonlinear change of ), one provides the necessary stability of calculation. The level of discretization (size of the steps) is chosen to be optimal in respect to both accuracy and calculation time and allows to obtain the reliable general dependencies discussed further.
The parameters of the photonic crystal [the structure of type] used in our calculations are as follows: the linear parts of refractive indices of the layers and are and , respectively; their thicknesses and m; the number of layers . The pulse duration is fs, and the central wavelength of the initial pulse spectrum is m if not stated otherwise. The nonlinear coefficient of the material is defined through the nonlinear term of the refractive index, so that ; this means that the pulse amplitude is normalized by the value . The relaxation time of the nonlinearity of both layers is fs. We adopt these parameters in this paper though the similar effects can be obtained even in the half-linear structure Novit2 . It is also important to note that the parameters (in particular, the wavelength) satisfy the requirements on the sign of group velocity dispersion studied in Refs. Novit1 ; Novit2 .
Figure 1(a) shows the dependence of the output energy leaving the photonic crystal during a certain time interval after pulse incidence on the pulse amplitude. The output energy is calculated by integration of intensity of light leaving the photonic crystal over time. The relative output energy normalized by the input one is
| (4) |
where and are the absolute values of energy of the incident and output light, respectively; and are the corresponding intensity profiles. The value calculated by Eq. (4) at the input edge (incidence plane) of the structure gives the normalized energy of the reflected light, while the energy calculated at the exit edge corresponds to the transmitted light. The sum of these two values is the total output energy. The relative output energy in Fig. 1(a) is integrated over the time which is approximately ten times larger than the pulse transmittance time in the linear regime (about ). The dip seen in the curve for the total output energy is the feature of self-trapping of the pulse. This means that the pulses with the amplitudes in the certain range are trapped inside the photonic crystal. Outside this range, the low-intensity pulses transmit through the system, while the high-intensity ones are mostly reflected.
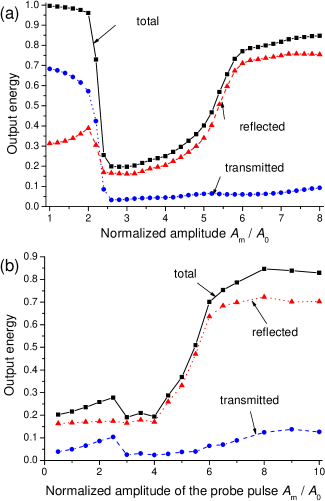


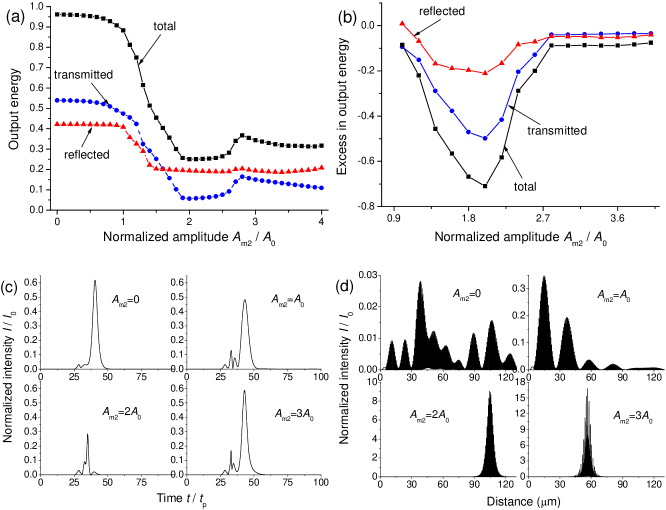
The result of self-trapping is the formation of localized light intensity distribution which is the indication of trap creation. This trap stores most of the pulse energy for the times of the order of several thousands Novit . It is worth noting that self-trapping does not mean light absorption, because the modulated refractive indices remain real. Let us study what happens when the second (probe) pulse interacts with this excited state of the photonic crystal containing trapped light. In this case the intensity of light in Eq. 1 is governed by the sum of the field present at a certain space point and time instant. The second pulse starts at the instant after the first (trapped) one. The results of calculations of the output energy (integrated over the time ) as a function of amplitude of the probe pulse is presented in Fig. 1(b). It is seen that the trap formed due to the pulse with the amplitude blocks propagation of probe pulse with low enough intensity. This means that the energy of the probe pulse gets stored inside the photonic crystal, so that the trap collects more and more light. Our estimate shows that the probe pulse with loses about of its energy due to interaction with the trap. The region of optimal self-trapping of single pulses () is naturally the range where the most part of both pulses is trapped. Finally, the high-intensity probe pulse (with ) cannot be trapped. This, however, is connected not with the breakdown of the trap but with reflection of the high-intensity pulses seen in Fig. 1(a).
We prove these conclusions in Fig. 2 where the distributions of light intensity inside the photonic crystal at different time instants are shown. It is seen that, by the time (launch time of the probe pulse), the trap (bell-shaped stable light distribution) formed by the first pulse with the amplitude exists inside the multilayer system (the total length of the system is m). If the probe pulse has low peak amplitude [, see Fig. 2(a)], it is just absorbed by the trap, the peak intensity of the distribution increasing from about to . This distribution is slowly spreading with time. The situation is totally different for the probe pulse with the amplitude [Fig. 2(b)]. It is seen that this high-intensity pulse is stopped near the very entrance of the photonic crystal and then effectively reflected. However, some part of its light penetrates in the vicinity of the trap and perturbs it. As a result of this perturbation, the peak intensity of the distribution decreases (about at ), the trap spreads and shifts towards the entrance of the structure. At time the distribution is strongly widen and has maximum of the order of . In other words, the trap looses the light energy faster than in the case of low-intensity probe pulse and is less stable.
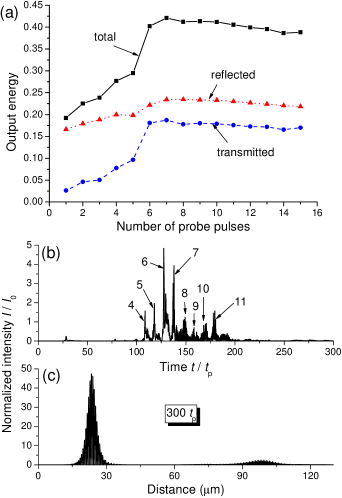
Nevertheless, we can state that, generally, the trap persists and cannot be overcome by a single probe pulse. To study stability of the trap further, we launch more probe pulses inside the photonic crystal. The first probe pulse starts at after the initial one (which forms the trap); the interval between every subsequent probe pulses is . The integral output energy as a function of the number of probe pulses is plotted in Fig. 3(a). It is seen that, at first, the part of energy leaving the multilayer structure is growing quite rapidly. But after the sixth probe pulse the trapped energy (in relative units) stays approximately the same. This means that the absolute value of light energy trapped inside the system is growing. The evidence for this conclusion is presented in Fig. 3(c) where the intensity distribution is shown for the case of probe pulses. The peak value of intensity is about (at ) which is much greater than for the single probe pulse [see Fig. 2(a)]. The profile of the transmitted radiation shown in Fig. 3(b) allows to identify the intensity peaks corresponding to particular probe pulses. Notice that the first strongly pronounced peak is connected with the fourth probe pulse, i.e. the first, second, and third probe pulses are almost entirely absorbed. Every following pulse appears more or less sharply in the output of the photonic crystal.
Returning to Fig. 3(c), one can note not only the increase in peak intensity of light in the trap but also the shift of the trap towards the input of the system. Obviously, this process continues as we launch more and more pulses in the structure. Such situation is shown in Fig. 4. We also see substantial spreading of the distribution for larger number of input pulses. Finally, for probe pulses (lower three panels in Fig. 4), the bell-shaped distribution tends to collapse sooner than for lesser number: the trap is absent at which is about after the last pulse enters the system, while for pulses the trap is still stable after (see left upper panel). Nevertheless, even at approximately of the energy of pulses remains inside the photonic crystal due to multiple reflections on the numerous boundaries.
III Induced trapping


In Fig. 1(a) we see that the transition between the regimes of propagation and trapping is an abrupt one. Therefore the amplitude of this transition which is approximately equal to can be called the critical amplitude. The pulses with subcritical intensity freely propagate through the photonic crystal (the most part of light is simply reflected and transmitted), while the supercritical pulses are self-trapped. In this section we study the possibility for light trapping as a result of collision of two pulses with subcritical intensities. We refer to such a situation as the induced trapping.
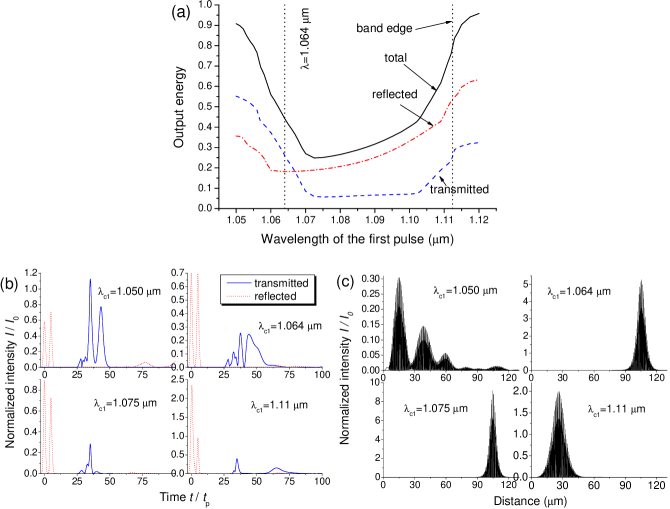
The first possible scheme is the collision of two co-propagating pulses. This scheme implies that the second pulse must move faster than the first one and overtake it at a certain point of space. As a result, the light intensity is to increase in the vicinity of this point and formation of the trap is expected due to summation of the fields of two subcritical pulses. To demonstrate possibility of such course of events, we should select the proper values of the parameters of the pulses, so that they could meet inside the photonic crystal. It is known that the group velocity of the pulse in the periodic structure depends on the wavelength: it is large in the transmission band and decreases towards the band gap where it vanishes. The reflectivity spectrum and group velocity behavior near the band edge of the system considered in this paper are shown in Fig. 5. It is seen that the group velocity at the central wavelength m is about half of the light speed (). Therefore, we keep the central wavelength of the second (”fast”) pulse unchanged ( m) and vary the central wavelength of the first (”slow”) pulse.
Note that in our consideration, we neglect the dispersion of the materials of the layers, i.e. the change of the refractive index with frequency. This is justified by the very slow rate of this change for many optical materials (such as glasses) in the spectral range of our interest, namely near infrared region Palik ; Weber . In addition, we take only narrow section of this range from about to m. Thus, the only source of dispersion in the further study is the structural dispersion caused by the order of the photonic crystal layers.
The results of calculations of the output energy as a function of are presented in Fig. 6(a). The time interval between the peaks of co-propagating pulses is ; their amplitudes are equal and sub-critical (). As it was expected, the effective trapping occurs for (i.e. when ), so that it can be unambiguously interpreted as a result of pulse collision. The details of pulse interaction are clarified in Figs. 6(b) and 6(c) where the resulting intensity profiles and distributions (at ) are plotted. It is seen that, when the first pulse moves faster ( m) than the second one, there are two sharp peaks at the output. For the pulses with equal wavelengths ( m), these peaks are much less pronounced and about a half of the energy of the pulses stays inside the system. There is the bell-shaped light distribution near the very exit of the structure [see Fig. 6(c), upper right panel] which indicates the trap formed in this case. This trap is perhaps due to multiple reflections from the interfaces between layers as well as the reflection from the output boundary of the photonic crystal. This is corroborated by the position of the trap (near the very output) and the structure of the transmitted radiation (two peaks of lowered intensity, in contrast to the single peak seen in the case of optimal induced trapping at m). It is worth noting that the interaction between the pulses can be observed when they move close enough one to another, i.e. the interval between pulses is not very large.
At m we have nearly optimal induced trapping when there is the single low-intensity pulse at the exit. This transmitted pulse corresponds to the first incident one, while the second one is almost entirely absorbed. The trap forms close to the exit and has comparatively high peak intensity (about ). As we move further towards the band gap shown in Fig. 6(a) by the dotted vertical line, the first pulse gets more and more reflected, so that the transmittance starts to increase as well. However, even near the very band edge (for m), some part of the light energy (about , to be exact) is trapped. The corresponding distribution shows that the trap forms near the entrance of the structure. This can be interpreted as a result of the collision of the very slowly moving first pulse (or the rest part of it which was not reflected) and the second one. The resulting distribution has large width and low peak intensity (about ). For larger , the output energy rapidly increases to the unity as we are now inside the forbidden gap.
Thus, the effect of induced trapping can be observed in the rather wide range of wavelengths of the pulse near the band edge of the photonic crystal. This range is limited, at a given interval between the pulses, by the length of the structure and, on the other hand, by the reflectance near the band edge. The length of the system is important at small differences between speeds of the pulses when one of them needs much time to overtake the other; at best, they collide near the exit of the system. The importance of the band edge appears in the opposite case of large velocity difference when, though the pulses collide near the entrance of the system, the most of the ”slow” pulse is reflected.
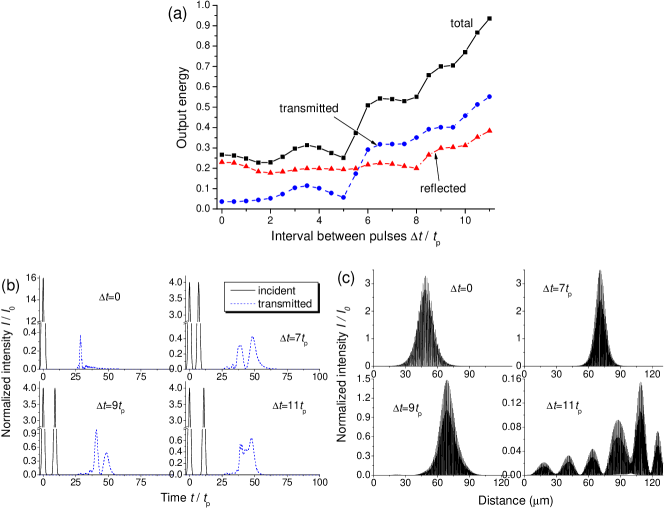
In Fig. 7 we study dependence of the induced trapping of two identical co-propagating pulses (with amplitudes ) on interval between them. The central wavelength of the first pulse ( m) is nearly optimal for trapping. means that, in fact, we have a single pulse with the amplitude , i.e. the supercritical one. The trapping with approximately the same efficiency is observed for but then the output energy starts to increase in a stepwise manner. This is accompanied by the rise of transmitted light as the trap forms nearer to the exit of the system (see the panels corresponding to and ). Finally, at , the collision do not happen: the interval is too large for the pulses to have time to collide. This is the same limit due to the finiteness of the length of the photonic crystal.
The next question is the dependence of the induced trapping on the amplitudes of the pulses at the fixed values of other parameters (we adopt and m). Without loss in generality, we can vary only the amplitude of the second (”fast”) pulse leaving the amplitude of the first one the same as previously (). The results of calculations at different are shown in Fig. 8. It is seen in the panel 8(a) that the output energy starts to decrease at and reaches the minimum at approximately . At there are the local peaks in the curves of total and transmitted energy. These peaks can be interpreted as a result of effective trapping of the second, high-intensity pulse preventing the collision. This conclusion is proved in Fig. 8(c): the transmitted pulse profiles have approximately the same peak intensity in the cases (the single first pulse) and (the trapping of the second pulse), while in the intermediate variant () the transmitted pulse is strongly suppressed due to the induced trapping. The intensity distributions in Fig. 8(d) demonstrate the difference between the trap formation due to the collision (at ) and single pulse absorption (at ). Note that, in the last case, the trap forms at larger distance than in the case of the single pulse [see Fig. 2 at ]. This means that the dynamics of the second pulse in the two-pulse scheme still depend on the first one.
Figure 8(a) does not allow to demarcate unambiguously the regions of induced trapping and single pulse trapping. To carry out this demarcation, we calculate the excess in output energy, i.e. the difference between output energies in the cases of two-pulse and single-pulse propagation. This value can be written as
| (5) |
where the relative output energies , , and are defined by Eq. (4) in the instances of both pulses, single first and single second pulse, respectively. , , and are the corresponding absolute energies of incident light (at that, ). The value shows how much extra energy leaves the system when both pulses are launched in comparison with the single pulse cases; if it is negative, , then one can say that the additional energy is trapped inside the multilayer structure due to the interaction between the pulses. The excess value extracted from the data in Fig. 8(a) is shown in the panel (b). This figure is the evidence that, in the region , the effective trapping occurs due to the collision of the pulses (up to of the total energy can be additionally trapped). At higher values of the amplitude, , the excess value is small and approximately constant, , which means that only a minor part of light is trapped due to the interpulse interaction. This proves our previous conclusion about practically independent trapping of the second pulse in the high-intensity regime.
Finally, we should consider the case of counter-propagating pulses colliding inside the photonic crystal. Obviously, it is enough to consider the pulses with identical sub-critical intensities and central wavelengths. We take the latter to be m, while the former is varied. The results of calculation of the energy excess for this case are presented in Fig. 9. It is seen that, at low intensities (), the excess is negligible which means that the pulses propagate independently from one another. At higher intensities, a small negative excess appears; this means that only a few percent of the energy of the pulses is trapped due to their interaction. If we increase the pulse amplitude further (), becomes positive, i.e. some additional part of energy (less than ) is released due to simultaneous presence of both pulses inside the structure.
Thus, there is no evidence of induced trapping in the situation of counter-propagating pulses. One can suppose that the reason is the short interaction time between the pulses. Indeed, in the case of co-propagating pulses, they travel one after another exchanging energy for a long time. On the contrary, the intersection of two subcritical counter-propagating pulses is too short-lived to lead to any substantial result. The calculations at different wavelength show that slowing down of pulses does not help to improve this situation. Only at high intensities, when the pulses are trapped very soon after launching, the traps (which are unstable in this case) seem to be sensitive to presence of the second pulse.
IV Conclusion
To sum it up, in this paper we have considered the interaction of many ultrashort pulses with the photonic crystal possessing relaxing cubic nonlinearity. As it is known from our previous investigations, there is possibility of pulse self-trapping in such a structure. First, we have analyzed the influence of trapped light on behavior of additional (probe) pulses. It is shown that the trap formed by the high-intensity (supercritical) pulse can absorb probe pulses with low-intensity, i.e. subcritical pulses which do not demonstrate self-trapping on their own account. This effect can serve as a peculiar absorber for low-intensity pulses. We have also studied the changes produced in the trap by incidence of many probe pulses.
The second topic of this paper concerns the induced trapping, i.e. the effect of light trapping as a result of collision of two subcritical pulses. We have shown that this phenomenon occurs in the case of two co-propagating pulses with different velocities: when one of them overtakes the other, their interaction leads to effective trapping of their energy. On the contrary, the collision of two counter-propagating pulses does not allow to observe induced trapping.
The results presented in this paper are of general character and therefore leave the question of their particular realization open. Here we briefly discuss some important issues. We have used the simple and well-known Debye model of relaxation, though the particular nonlinear media can relax according to different laws. This raises an interesting question of dependence of the results on the relaxation model, though it is likely that the particular model is not as important for the effects calculated as the presence of relaxation per se. The choice of model is perhaps closely associated with the choice of relaxation time. The relaxation times used in our research (up to fs) make another demand of appropriate materials. Such short are characteristic, for example, to the electronic mechanism and its combinations with other contributions to the Kerr nonlinearity. However, our analysis is purely phenomenological and does not include these important details.
Another important issue is connected with the value of light intensities necessary to obtain the effects reported, in particular self-trapping of the pulse. Obviously, intensities should be very large, putting a question of optimization of the system in order to reduce the field. According to this paper, one way to reach this is to use induced trapping of relatively low-intensity pulses instead of one high-intensity pulse. Another possible approach is the adjustment of the photonic structure aimed at lowering the requirements on the materials and pulse parameters. This work is still to be done as well as analysis of more general situations. Such situations include taking into account of absorption, spatial finiteness of the laser beam (we have considered only plane wave approximation yet), and other nonlinear contributions (for example, light frequency conversion).
Acknowledgements.
The work was supported by the Belarusian Foundation for Fundamental Research (Grant No. F11M-008). The author is grateful to the referees of J. Opt. for interesting and inspiring comments.References
- (1) S. A. Akhmanov, V. A. Vysloukh, and A. S. Chirkin, Optics of Femtosecond Laser Pulses (AIP Press, New York, 1992).
- (2) J. A. Fleck and P. L. Kelley, Appl. Phys. Lett. 15, 313 (1969).
- (3) V. A. Aleshkevich, S. A. Akhmanov, A. P. Sukhorukov, and A. M. Khachatryan, JETP Lett. 13 36 (1971).
- (4) E. G. Hanson, Y. R. Shen, and G. K. L. Wong, Appl. Phys. 14, 65 (1977).
- (5) J. A. Fleck and R. L. Carman, Appl. Phys. Lett. 20, 290 (1972).
- (6) S. Trillo, S. Wabnitz, G. I. Stegeman, and E. M. Wright, J. Opt. Soc. Am. B6, 889 (1989).
- (7) P. A. Apanasevich, A. A. Afanas’ev, N. B. Gubar, and A. I. Urbanovich, Laser Phys. 6, 1050 (1996).
- (8) M.-F. Shih, C.-C. Jeng, F.-W. Sheu, and C.-Y. Lin, Phys. Rev. Lett. 88, 133902 (2002).
- (9) I. Velchev, R. Pattnaik, and J. Toulouse, Phys. Rev. Lett. 91, 093905 (2003).
- (10) H. Leblond and C. Cambournac, J. Opt. A: Pure Appl. Opt. 6, 461 (2004).
- (11) L. Zhang, S. Wen, X. Fu, J. Deng, J. Zhang, and D. Fan, Opt. Commun. 283, 2251 (2010).
- (12) J. M. Soto-Crespo and E. W. Wright, Appl. Phys. Lett. 59, 2489 (1991).
- (13) C. Cambournac, H. Maillotte, E. Lantz, J. M. Dudley, and M. Chauvet, J. Opt. Soc. Am. B19, 574 (2002).
- (14) S. E. Skipetrov, Opt. Lett. 28, 646 (2003).
- (15) X. Liu, J. W. Haus, and S. M. Shahriar, Opt. Commun. 281, 2907 (2008).
- (16) C. Michel, B. Kibler, and A. Picozzi, Phys. Rev. A83, 023806 (2011).
- (17) A. Armaroli, S. Malaguti, G. Bellanca, S. Trillo, A. de Rossi, and S. Combrié, Phys. Rev. A84, 053816 (2011).
- (18) A. C. Ferreira, M. B. C. Costa, A. G. Coelho Jr., C. S. Sobrinho, J. L. S. Lima, J. W. M. Menezes, M. L. Lyra, and A. S. B. Sombra, Opt. Commun. 285, 1408 (2012).
- (19) R. A. Vlasov and A. G. Smirnov, Phys. Rev. E61, 5808 (2000).
- (20) D. V. Novitsky, Phys. Rev. A81, 053814 (2010).
- (21) D. V. Novitsky, Phys. Rev. A84, 053857 (2011).
- (22) D. V. Novitsky, J. Nonlin. Opt. Phys. Mater. 21, 1250010 (2012).
- (23) D. V. Novitsky, EPL 99, 44001 (2012).
- (24) Z.-M. Meng, F. Qin, and Z.-Y. Li, J. Opt. 14, 065003 (2012).
- (25) E. D. Palik (ed.), Handbook of Optical Constants of Solids (Academic Press, 1998).
- (26) M. J. Weber, Handbook of Optical Materials (CRC Press, 2003).