Roughening transition and universality of single step growth models in (2+1)-dimensions
Abstract
We study (2+1)-dimensional single step model (SSM) for crystal growth including both deposition and evaporation processes parametrized by a single control parameter . Using extensive numerical simulations with a relatively high statistics, we estimate various interface exponents such as roughness, growth and dynamic exponents as well as various geometric and distribution exponents of height clusters and their boundaries (or iso-height lines) as function of . We find that, in contrary to the general belief, there exists a critical value at which the model undergoes a roughening transition from a rough phase with in the Kardar-Parisi-Zhang (KPZ) universality to a smooth phase with , asymptotically in the Edwards-Wilkinson (EW) class. We validate our conclusion by estimating the effective roughness exponents and their extrapolation to the infinite-size limit.
I Introduction
Roughening transition from a smooth phase with finite width to a rough one with diverging width is one of the most interesting properties of nonequilibrium models for interfacial growth Marro and Dickman (2005); Hinrichsen and Ódor (1999). A class of nonequilibrium growth processes described by the Kardar-Parisi-Zhang (KPZ) equation Kardar et al. (1986), is known to be always rough in dimensions while exhibits a roughening transition for Schwartz and Perlsman (2012). The KPZ equation is given by
| (1) |
where the relaxation term is caused by a surface tension , and the nonlinear term is due to the lateral growth with strength . The noise is uncorrelated Gaussian white noise in both space and time with zero average i.e., and . The model produces a self-affine interface whose probability distribution function remains invariant under scale transformation ( means statistically the same) with roughness exponent . A possible way to classify various surface growth models is based on scaling behavior of surface width, where denotes spacial averaging. For a nonequilibrium growth surface, the width is expected Family and Vicsek (1985) to show the scaling form , in which the scaling function usually has the asymptotic form constant and . The time when the width first saturates has the scaling ansatz with the dynamic exponent . The universality class of a growing interface can then be given by two independent roughness and growth exponents. For KPZ equation, due to additional scaling relation , there remains only one independent exponent, say whose exact value is only known in Kardar et al. (1986) with . In , the exponent is available only by various simulations and theoretical approximations ranging from to Amar and Family (1990); Marinari et al. (2000); Miranda and Aarão Reis (2008). Some authors Saberi et al. (2010, 2008a, 2008b); Saberi and Rouhani (2009) have also argued that it is possible to apply Schramm-Loewner evolution (SLE) Schramm (2000) based on statistics and fractal properties of iso-height lines of saturated 2 surfaces to classify surface growth processes as well.
In , there exists a critical value for the nonlinearity coefficient in Eq. 1 which separates flat and rough surface phases Imbrie and Spencer (1988); Tang et al. (1990). In the weak coupling (flat) regime () the nonlinear term is irrelevant and the behavior is governed by the fixed point i.e., the linear Edwards-Wilkinson (EW) equation Edwards and Wilkinson (1982) whose exact solution is known: and . In the more challenging strong-coupling (rough) regime (), where the nonlinear term is relevant, the behavior of the KPZ equation is quite controversial and characterized by anomalous exponents. There is, however, a longstanding controversy (see e.g., Schwartz and Perlsman (2012) and Saberi (2013) and references therein) concerning the existence and the value of an upper critical dimension above which, regardless of the strength of the nonlinearity, the surface remains flat. The aim of this paper is to investigate the possibility of roughening transition and universality of 2 single step discrete growth model (SSM) which, to our best knowledge, has not been addressed before. A coarse-graining derivation of the SSM surface dynamics in (1+1)-dimensions has revealed Privman (2005) that it belongs to the KPZ universality class. Although there is no rigor theoretical support for this claim in higher dimensions, it is believed to be true in any spatial dimension as well. However, our study can shed light on the controversial relation between SSM and KPZ model as well as the roughening transition of the KPZ equation in (2+1)-dimensions.
Various discrete models have been suggested in the past to describe surface growth processes (see e.g., Barabási and Stanley (1995); Meakin (1997)). Among them, here we study the class of single step models (SSM) Meakin et al. (1986); Plischke et al. (1987); Liu and Plischke (1988); Kondev et al. (2000), a kind of solid on solid (SOS) models Kim and Kosterlitz (1989) which is defined as follows: the growth starts from an initial condition with and , on a square lattice of size . At each step one site is randomly chosen, if is a local minimum then it is increased by with probability (deposition process), and if it is a local maximum then its height is decreased by with probability (desorption or evaporation process). Such definition guarantees that at each step, the height difference between two neighboring sites would be exactly 1. Overhanging is not allowed in this model and the interface will not develop large slopes. Without loss of generality, we consider that leaves only one control parameter (up-down symmetry switches ) which is believed to play the same role as the nonlinearity coefficient in the KPZ equation 1 as .
This model has been investigated in the past, claiming that for and , it belongs to the EW and KPZ universality classes, respectively Plischke et al. (1987); Liu and Plischke (1988); Kondev et al. (2000). Plischke et al. Plischke et al. (1987) have shown that for in , this model is reversible and can be exactly solved by mapping to the kinetic Ising model. They have found and . Furthermore, for they have mapped the interface model onto the driven hard-core lattice gas, and focused on the average slope of the interface. In an approximate way, they have then shown that the equation of the average slope is in agreement with the Burgers’s equation Plischke et al. (1987), thus claiming that the universality class is that of KPZ equation for . They have also simulated this model for , and claimed that in the limit of large system sizes , the exponent converges to in 1. Simulations by the same authors on SSM in Liu and Plischke (1988), have provided the scaling exponents , for , and , for . Kondev et al. Kondev et al. (2000), have also simulated SSM on a square lattice of size , and confirmed that the model for and are consistent with the EW and KPZ classes, respectively. However, they found that consistently resembles , contrary to the claims in Plischke et al. (1987), and they attributed their finding to a slow crossover from initially Gaussian to asymptotic KPZ behavior. A generalized single step model has also been investigated in Gates (1988); Gates and Westcott (1988a, b) which exhibits a dynamical crossover characterized by a shift in the early-time scaling exponent from its KPZ value to the EW value. This has been first explained in Krug et al. (1992); Krug and Spohn (1990) by showing that this behavior is due to a change in the sign of the nonlinear parameter . It is also known that the (2+1)-dimensional anisotropic KPZ equation with lambdas of opposite sign does generate EW, rather than KPZ scaling behavior Halpin-Healy and Assdah (1992); Wolf (1991).
In this paper we are going to revisit the model in (2+1)-dimensions and present the results of extensive simulations with relatively large system sizes and higher precision. We will estimate various geometrical exponents as function of the control parameter in the two following sections II and III. We will estimate the roughness exponent by extrapolating the results to the infinite-size limit in Sec. IV and come to the conclusion in Sec. V that there exists a critical value at which SSM exhibits a roughening transition from a rough phase with to a smooth phase with .
II Interface exponents
In this section we present the first part of our results obtained from extensive simulations on a square lattice of size , in which the averages for are taken over more than independent runs. We estimate the roughness and dynamic exponents by examining the scaling laws i.e., (where is the saturated width) and , respectively. We use the system size to estimate the growth exponent by using the scaling ansatz for . To compute various geometric exponents of iso-height lines and height clusters in the next sections, the averages are taken over height configurations on a square lattice of size . To further justify our conclusion, we perform simulations on a rectangular geometry of size and with to measure the winding angle statistics of the iso-height lines and their fractal dimensions. One time step is defined as number of trials for particle deposition or evaporation.
To check the efficacy of our simulations, let us first estimate the roughness exponent from scale-dependent curvature in the saturation regime . The curvature at position on scale is defined as follows Kondev et al. (2000)
| (2) |
where the offset directions are a fixed set of vectors summing up to zero. In our case on a square lattice, are pointing along the type directions. For a self-affine surface, the curvature is expected to satisfy the following scaling relation Kondev et al. (2000):
| (3) |
where denotes spatial averaging. To check this relation, simulations are carried out on square lattice of size with more than number of height configurations for different values of . We apply periodic boundary conditions in both directions. The estimated rescaled exponents for three different values of are plotted in Fig. 1 as a function of the control parameter . We find that the three curves for and are independent of (within the error bars), confirming the self-affinity of the height profiles. Since the curvature vanishes at for , the point is excluded in the plot.
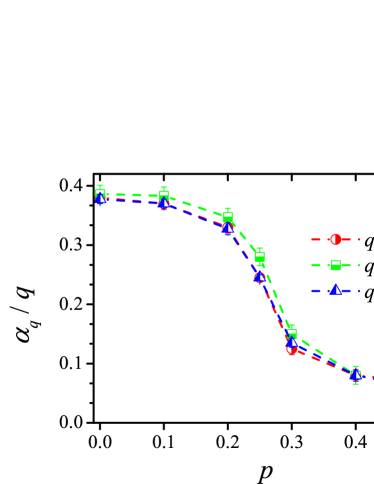
The other important feature observed in Fig. 1 is the crossover between two KPZ and EW universality classes with and , respectively. This is the main goal of the present study to clarify if there is a roughening transition at a critical control parameter in the sufficiently large system size limit in 2.
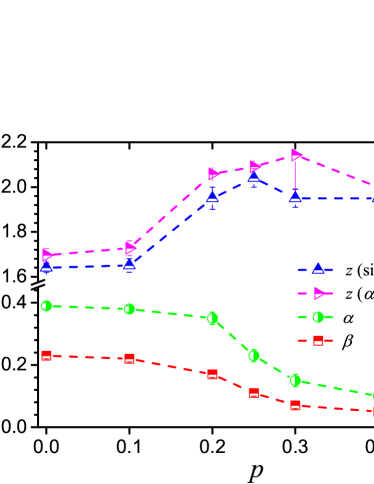
The interface exponents and as function of are shown in Fig. 2 (each exponent is measured independently). For the two limiting cases at and , the exponents are again in good agreement with those for KPZ and EW universality classes, respectively Amar and Family (1990); Marinari et al. (2000); Miranda and Aarão Reis (2008). However, we find that except for the intermediate values around , the plots suggest that the exponents are approximately equal within the two disjoint intervals and . This observation can be a benchmark of roughening transition at which calls for a more delicate analysis. In the following sections we present various observations of different geometric exponents as function of which confirm our observation. We will then justify our finding by estimating effective exponents and extrapolations to the infinite system size.
III Statistics of the height clusters and iso-height lines
In this section we present the results of our further analysis on the fractal properties of the height clusters and iso-height lines as well as the scaling properties of the distribution of the cluster size and their perimeter. We find that the corresponding exponents show characteristic behavior below and above , unraveling further information about the self-affinity of the interfaces Kondev et al. (2000); Kondev and Henley (1995).
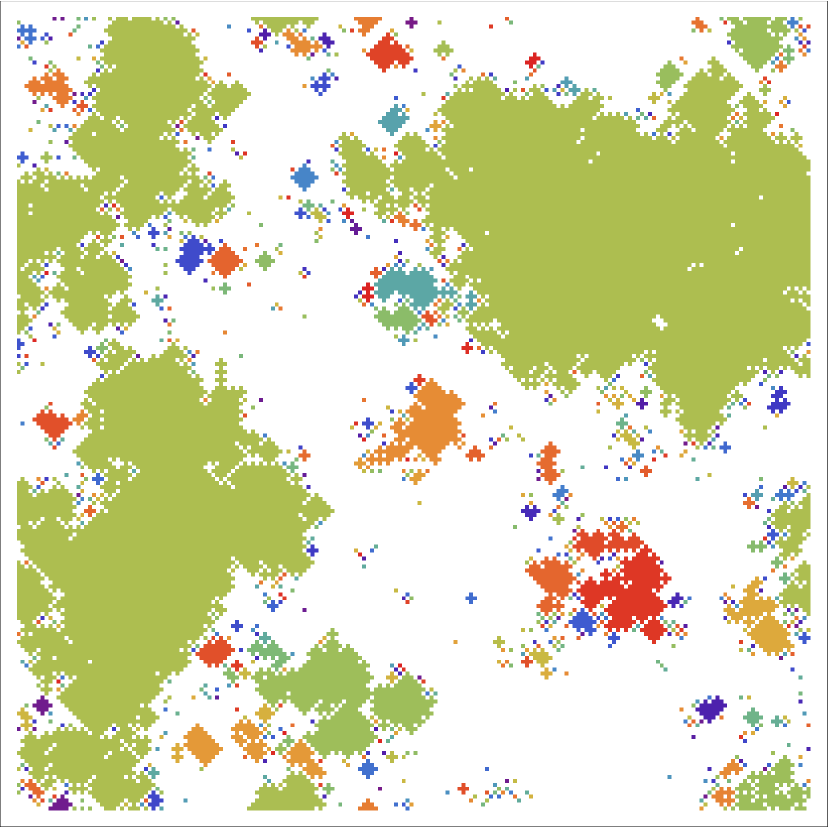
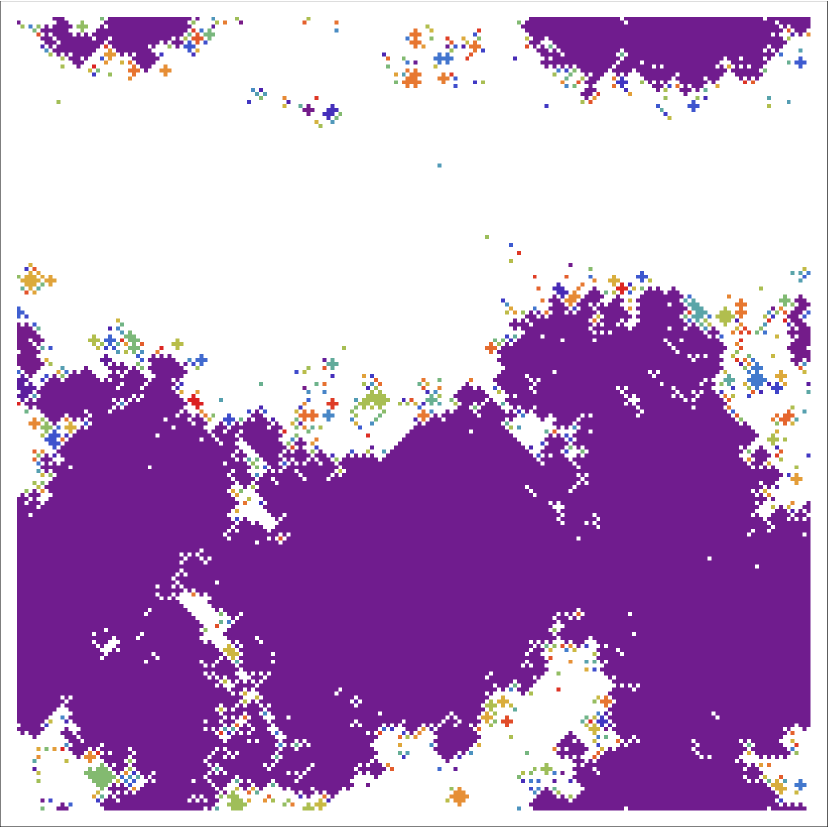
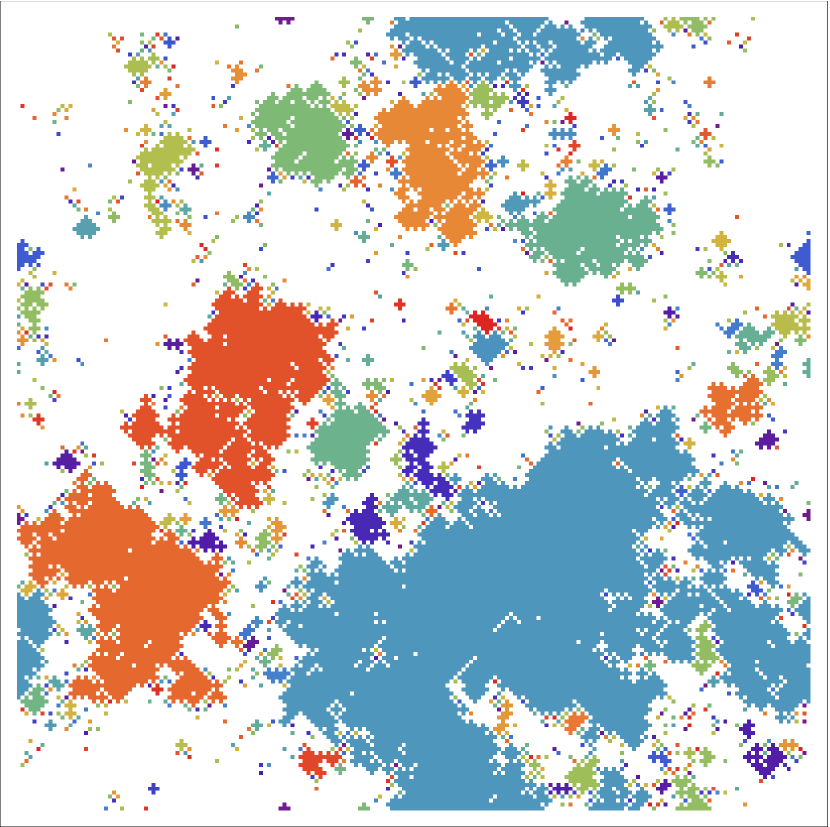
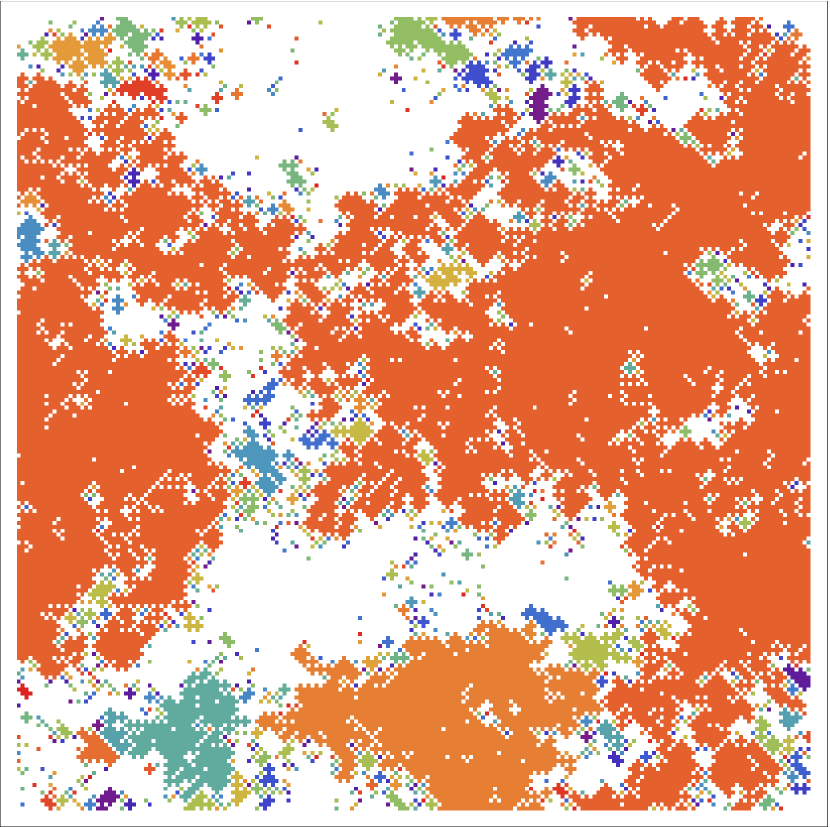
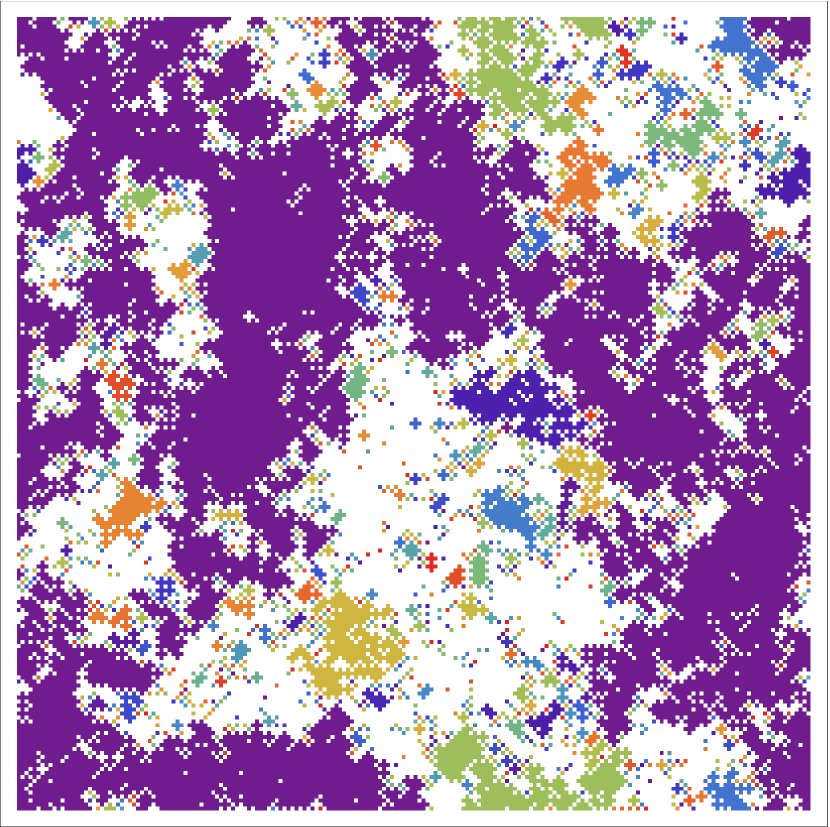
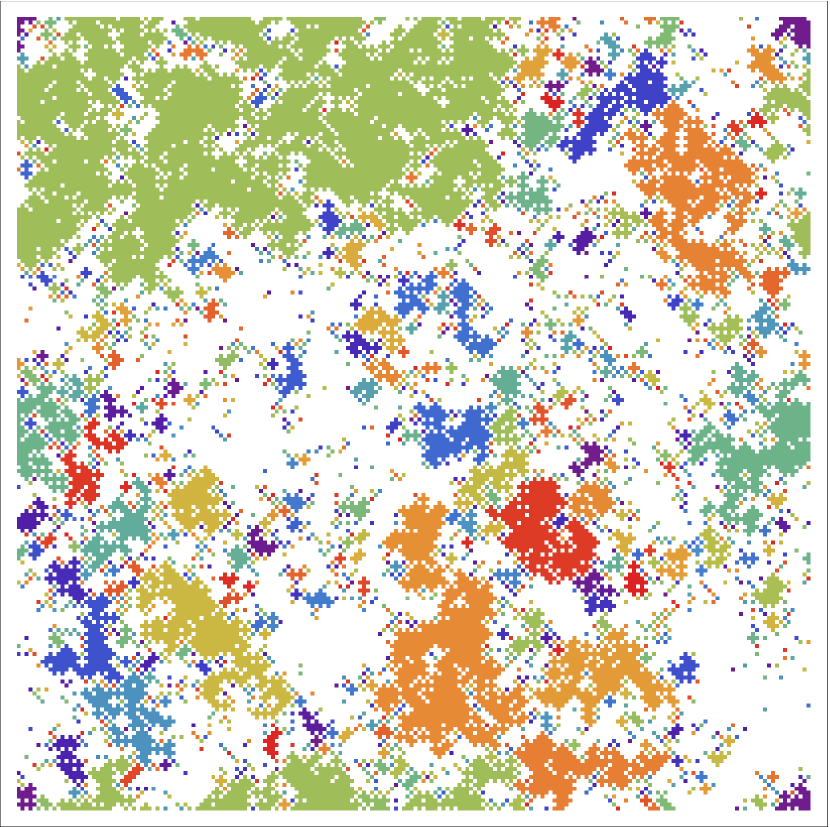
Consider an ensemble of height configurations in the saturated regime. For each configuration, a cut is made at a specific height , where is a small real number indicating the level of the cut. Each island (or cluster height) is defined as a set of nearest neighbor sites with positive height identified by the Hoshen-Kopelman algorithm Hoshen and Kopelman (1976). Let us first consider , i.e., the cut is made at the average height level. The iso-height lines (or loops) can be uniquely determined by the algorithm explained in Saberi (2009). In order to illustrate how islands behave as function of , the snapshots of the positive height clusters are shown in Fig. 3 for and . As it is evident in the figure, the islands are more compact for lower , and become more porous and scattered for larger . This picture is also in agreement with the cluster geometries previously observed Saberi et al. (2008a) for KPZ and EW models.
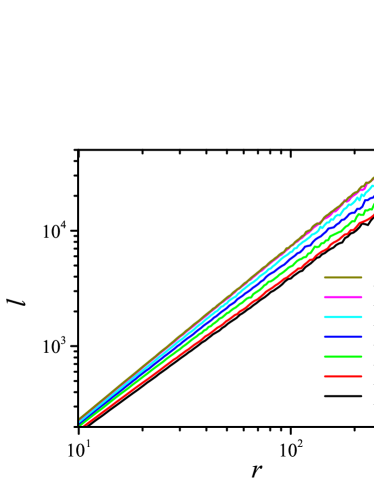
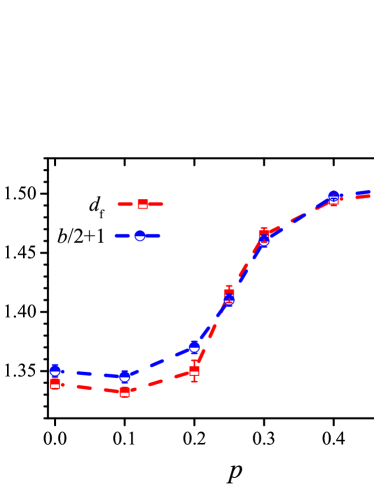
Fractal dimensions. Self-similarity of the clusters offers a scaling relation between the average mass of a cluster and its radius of gyration , i.e., , with being the fractal dimension of clusters. The average length of a cluster boundary also scales with it’s radius of gyration as Kondev et al. (2000); Kondev and Henley (1995). Moreover, the relation between the average area of a loop and it’s perimeter is given by where (for compact clusters). To estimate these fractal dimensions, we generate more than samples of height configurations on a square lattice of size . As an example, we present the data for the scaling of in Fig. 4 for various values of , whose slope in the log-log scale gives the corresponding fractal dimension. The estimated exponents are reported in Fig. 5.
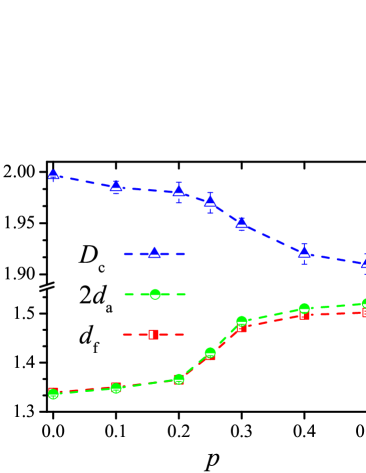
We find that all these fractal dimensions cross over between two limiting KPZ and EW classes Saberi et al. (2008a); Saberi and Rouhani (2009); schramm2010contour. We have also checked that the exponents do not depend on the level of the cut, although the range of scaling slightly does Saberi (2010). In order to see the finite-size effects, we have also measured the exponents by going to the larger sizes up to with a number of independent samples, and found similar results within the error bars.
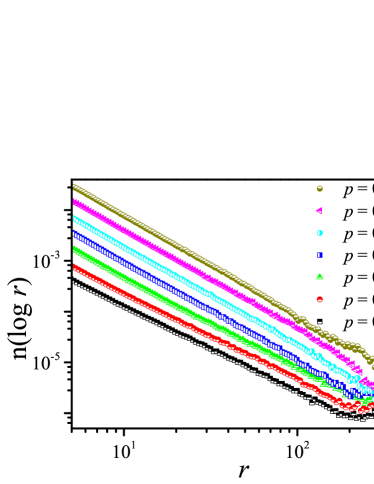
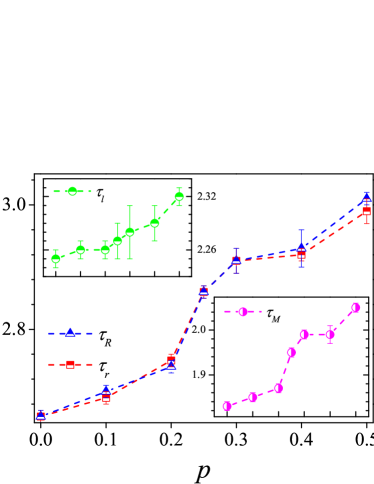
Distribution exponents. We now look at the distribution functions of different statistical observables of the height clusters and contours, such as the contour length distribution , cluster size distribution and distributions for the radius of gyration of the contours and clusters . We confirm that all these distributions follow the scaling forms i.e., , , and Kondev et al. (2000); Kondev and Henley (1995) (see Fig. 6 for an example). All distribution exponents are summarized in Fig. 7 for as function of which again confirm the crossover behavior. The exponents and coincide within the error bars. In the following, we investigate dependence of the distribution exponents on the level of the cut as previously noted by Olami et al. Olami and Zeitak (1996)
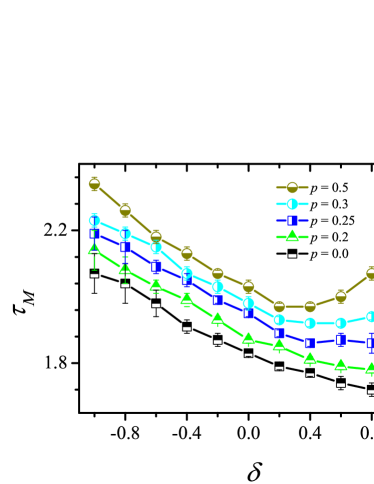
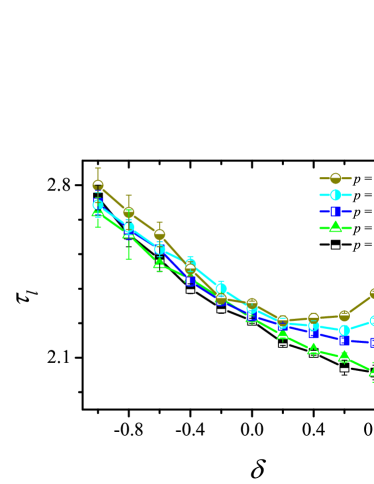
Dependence of the exponents on . All previous results were obtained at the mean height level i.e., at . Let us now examine their dependence on the level of the cut. Our analysis reveal that the fractal exponents such as fractal dimension of contours and clusters , do not depend on . Nevertheless, our results show that the distribution exponents do change with . As shown in figures 8 and 9, the exponents show a bowl-like functionality to for while for , they monotonically decrease with .
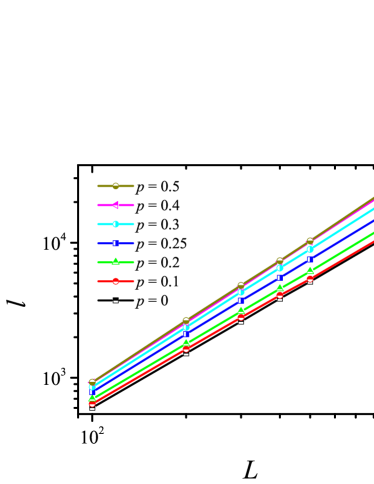
Winding angle statistics. Here we present the results of independent extensive simulations of SSM on a strip geometry of size with and . For each height configuration, we find all spanning clusters at level in direction, and assign corresponding coastlines that connect the lower boundary to the upper one. We consider and , and examine the scaling relation , to compute the fractal dimension of the spanning curves (Fig. 10). We could gather a number of spanning curves from an approximately independent saturated height profiles.
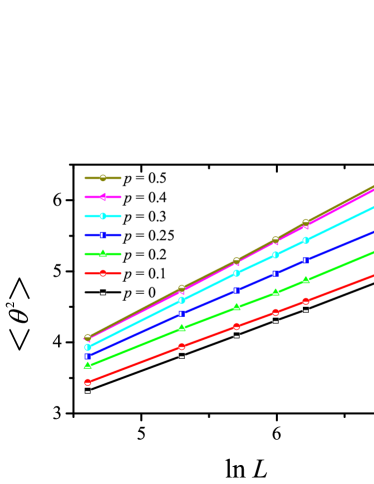
We compute the winding angle of the curves as defined by Wieland and Wilson Wieland and Wilson (2003). For each curve we attribute an arbitrary winding angle to the first edge (that is set to be zero). The winding angle for the next edge is then defined as the sum of the winding angle of the present edge and the turning angle to the new edge measured in radians. The variance of the winding angle is believed to behave like Wieland and Wilson (2003), where for conformal curves . We have computed the variance of the winding angle for an ensemble of spanning iso-height curves for different as function of lattice size , and confirmed that is linearly proportional to its logarithm with a universal coefficient which depends on (see Fig. 11). The two computed fractal dimensions from direct measurement () and , are plotted in Fig. 12 for a comparison. They almost coincide for but slightly deviate for . They both however present a crossover behavior around .
IV Effective Exponents
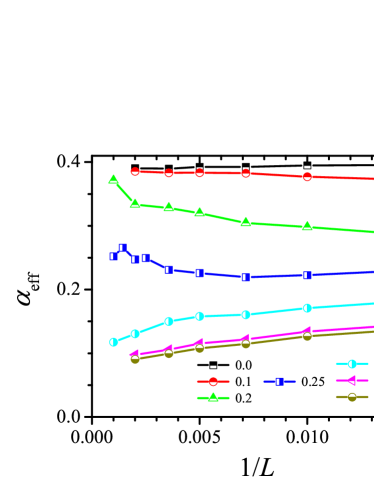
In the previous section we have shown that various geometric exponents have a crossover behavior between two limiting KPZ and EW classes which seems to approach a sharp step-like roughening transition around in the thermodynamic limit. Although we have used relatively large system sizes with adequate statistics in our computations, there may however exist systematic deviations from the true thermodynamic values. In order to eliminate the systematic errors, we compute size-dependent effective roughness exponent Jeong and Kim (2012) for various values of .
The effective roughness exponent , is defined by the successive slopes of the line segments connecting two neighboring points of and in which stands for the saturated width for an SSM grown interface on a square lattice of size averaged over more than independent runs,
| (4) |
It is plotted against in Fig. 13 to extrapolate the roughness exponent in the infinite-size limit. We find that the roughness exponents for converge to the known KPZ roughness exponent and for asymptotically converge to the EW value in the limit .
In order to further strengthen our conclusion on existence of a roughening transition around , let us now focus our attention on two boundary values i.e., and around . We follow the analysis presented in Pagnani and Parisi (2015) in which a careful finite-size scaling analysis of the critical exponents, and an accurate estimate of the first three moments of the height fluctuations, are used to estimate the roughness exponent of the Restricted Solid on Solid model in with a rather high accuracy. To this aim, we run independent extensive simulations of the SSM on square lattices of various linear size , , , , , , , , , , , for (which is a more challenging case), and also all sizes except , for . For each and we generate more than samples for averaging. Statistical sampling is adopted at steady state regime (). For a given sample at time , we measure the first three connected moments where and . Then we define the asymptotic (in time) estimate as for .
To appreciate more clearly the finite-size effects on , we evaluate the effective roughness exponent with a slight modification of Eq. 4 Pagnani and Parisi (2015) as
| (5) |
where . We also compute the cumulants of skewness and kurtosis . For the Gaussian (EW) surfaces these quantities are known to be and .
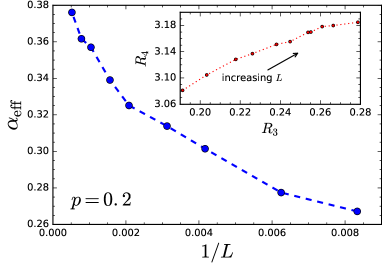
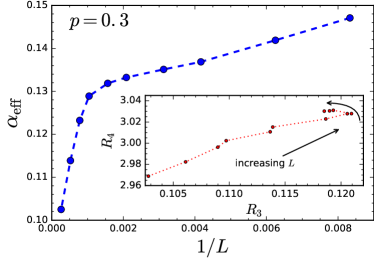
Figure 14 summarizes the results of our computations for (top) and (bottom).
For , clearly approaches to that of the KPZ universality class. The ratio of the cumulants versus is also plotted in the Insets of Fig. 14. For a significant departure from a normal distributed
fluctuation of the surface is observed.
In contrast to the observed behavior for , our data for strongly supports our previous conclusion that the SSM for belongs to the EW universality class, as displayed in Fig. 14 (bottom). The effective roughness exponent asymptotically converges to that of the EW class in the limit . As shown in the Inset, the ratio of the cumulants versus are more consistent with a normal distribution where we find . Although increases for small system sizes but it starts decreasing for larger (note the direction of arrows for the increasing system size).
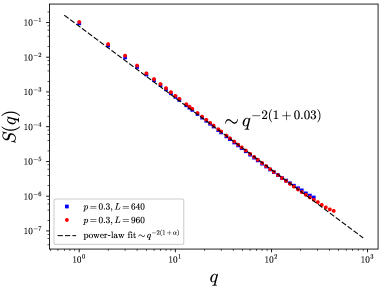
In the context of surface kinetic roughening, a very important quantity is the two-dimensional height structure factor i.e., , where is the space Fourier transform of . This function has many advantages over real-space correlation
functions, specially in the presence of crossover behavior and anomalous scaling Korutcheva (2004) where is frequently shown to be less affected by crossover effects. As a final and independent cross-check, we have carried out simulations for (which is more controversial) of sizes and to compute and estimate the corresponding roughness exponent from its scaling behavior i.e., Kondev et al. (2000).
As displayed in Fig. 15, we find the roughness exponent for which is, to a good extent, in agreement with the EW universality class.
Therefore, all our computations indicate that there is an unexpected roughening transition for single step growth models in (2+1)-dimensions around .
It is worth mentioning that in the context of the related problem of directed polymers in random media (DPRM), member of the KPZ universality class, Imbrie and Spencer Imbrie and Spencer (1988) have provided a rigorous mathematical proof that the model in (2+1)-dimensions, as in (1+1)-dimensions, is strictly strong-coupling and super-diffusive (), except at the isolated point of infinite temperature, where the wandering is simply entropic (i.e., ), analog of the EW stochastic growth behavior. For higher dimensions i.e., transverse substrate dimensions of , a finite-temperature roughening transition does exist, but for , there is a complicated multi-critical behavior involving very long, exponentially divergent time scales. This has been studied in an impressive series of works Tang et al. (1990); Forrest and Tang (1990); Tang et al. (1992) on ()-dimensional hypercubic-stacking (HCS) models with and , in which the authors show that a nonequilibrium surface-roughening transition occurs in , but in they have only observed a smooth crossover behavior rather than a true roughening transition. The reason for this discrepancy may be as follows. HCS model and SSM are identical only in , and for the microscopic growth rules are different since the height difference of neighboring columns in HCS model becomes and . This imposes additional up/down asymmetry in favor of the KPZ fixed point which delays the asymptotic convergence and thus the observation of a true roughening transition in the parameter space. It is intriguing that a more careful look at the presented data in Fig. 11 of Tang et al. (1992) for (2+1)-dimensional HCS simulations shows a real compression of the effective exponents for which may be the signature of a roughening transition in the asymptotic limit. In order to verify this postulated asymptotic convergence in SSM, we carried out new simulations to produce the same data as in the Fig. 11 of Tang et al. (1992) for SSM of rather large sizes up to for and for other values of . As shown in Fig. 16, our data confirms again the existence of a roughening transition around .
However, the discrepancy with Imbrie and Spencer (1988) which establishes the marginality of case, could arise from some peculiarity of the microscopic growth rules of these discrete growth models in (2+1)-dimensions whose delicate understanding will be the line of our future research.
There also exist some known results that can additionally be tested, which will be the purpose of our future work. Most notably, it is known that (2+1)-dimensional KPZ interfaces display one-point height fluctuations described by a (generalized) Tracy-Widom probability distribution function Halpin-Healy (2012); Oliveira et al. (2013); Halpin-Healy (2013), which should hold for and be falsified for .
V Conclusion
We have studied the single step model (SSM) for crystal growth in (2+1)-dimensions which admits both deposition and evaporation processes parametrized by a single control parameter . There is a general consensus that the model belongs to the KPZ universality class for and EW class for . However, various studies in the past have considered the control parameter proportional to the nonlinearity coefficient in the KPZ equation 1 and concluded that the model asymptotically belongs to the KPZ universality class for all .
In this paper we have presented the results of extensive simulations and obtained satisfactory evidence which rule out the previous claims. Extrapolations to the infinite-size limit reveal that there exists a critical value around which the model exhibits a roughening transition from a rough phase with in the KPZ universality to the asymptotically smooth phase with in the EW universality class.
Our study opens a new stimulating challenge in the field and calls for further theoretical investigations of the model. An interesting question arises concerning the upper critical dimension of the model and its relation to the same controversial problem in the KPZ model which is the main subject of our future work. However, according to the previous studies Halpin-Healy (1990) and Forrest and Tang (1990); Tang et al. (1992) on HCS model, the upper critical dimension should be .
Acknowledgement
A.A.S. would like to acknowledge supports from the Alexander von Humboldt Foundation, and partial financial supports by the research council of the University of Tehran.
References
- Marro and Dickman (2005) J. Marro and R. Dickman, Nonequilibrium phase transitions in lattice models (Cambridge University Press, 2005).
- Hinrichsen and Ódor (1999) H. Hinrichsen and G. Ódor, Phys. Rev. Lett. 82, 1205 (1999).
- Kardar et al. (1986) M. Kardar, G. Parisi, and Y. C. Zhang, Physical Review Letters 56, 889 (1986).
- Schwartz and Perlsman (2012) M. Schwartz and E. Perlsman, Phys. Rev. E 85, 050103 (2012).
- Family and Vicsek (1985) F. Family and T. Vicsek, Journal of Physics A: Mathematical and General 18, L75 (1985).
- Amar and Family (1990) J. G. Amar and F. Family, Physical Review A 41, 3399 (1990).
- Marinari et al. (2000) E. Marinari, A. Pagnani, and G. Parisi, Journal of Physics A: Mathematical and General 33, 8181 (2000).
- Miranda and Aarão Reis (2008) V. G. Miranda and F. D. A. Aarão Reis, Phys. Rev. E 77, 031134 (2008).
- Saberi et al. (2010) A. A. Saberi, H. Dashti-Naserabadi, and S. Rouhani, Physical Review E 82, 020101 (2010).
- Saberi et al. (2008a) A. A. Saberi, M. D. Niry, S. M. Fazeli, M. R. Rahimi Tabar, and S. Rouhani, Phys. Rev. E 77, 051607 (2008a).
- Saberi et al. (2008b) A. A. Saberi, M. A. Rajabpour, and S. Rouhani, Phys. Rev. Lett. 100, 044504 (2008b).
- Saberi and Rouhani (2009) A. A. Saberi and S. Rouhani, Physical Review E 79, 036102 (2009).
- Schramm (2000) O. Schramm, Israel Journal of Mathematics 118, 221 (2000).
- Imbrie and Spencer (1988) J. Z. Imbrie and T. Spencer, Journal of Statistical Physics 52, 609 (1988).
- Tang et al. (1990) L.-H. Tang, T. Nattermann, and B. M. Forrest, Phys. Rev. Lett. 65, 2422 (1990).
- Edwards and Wilkinson (1982) S. F. Edwards and D. R. Wilkinson, Proceedings of the Royal Society of London. A. Mathematical and Physical Sciences 381, 17 (1982).
- Saberi (2013) A. A. Saberi, Europhysics Letters 103, 10005 (2013).
- Privman (2005) V. Privman, Nonequilibrium statistical mechanics in one dimension (Cambridge University Press, 2005).
- Barabási and Stanley (1995) A. Barabási and H. Stanley, Fractal concepts in surface growth (Cambridge university press, 1995).
- Meakin (1997) P. Meakin, Fractals, scaling and growth far from equilibrium, Vol. 5 (Cambridge university press, 1997).
- Meakin et al. (1986) P. Meakin, P. Ramanlal, L. M. Sander, and R. C. Ball, Physical Review A 34, 5091 (1986).
- Plischke et al. (1987) M. Plischke, Z. Rácz, and D. Liu, Physical Review B 35, 3485 (1987).
- Liu and Plischke (1988) D. Liu and M. Plischke, Physical Review B 38, 4781 (1988).
- Kondev et al. (2000) J. Kondev, C. L. Henley, and D. G. Salinas, Physical Review E 61, 104 (2000), arXiv:9907229v1 [cond-mat] .
- Kim and Kosterlitz (1989) J. M. Kim and J. M. Kosterlitz, Physical review letters 62, 2289 (1989).
- Gates (1988) D. Gates, Journal of Statistical Physics 52, 245 (1988).
- Gates and Westcott (1988a) D. J. Gates and M. Westcott, Proceedings of the Royal Society of London A: Mathematical, Physical and Engineering Sciences 416, 443 (1988a).
- Gates and Westcott (1988b) D. J. Gates and M. Westcott, Proceedings of the Royal Society of London A: Mathematical, Physical and Engineering Sciences 416, 463 (1988b).
- Krug et al. (1992) J. Krug, P. Meakin, and T. Halpin-Healy, Phys. Rev. A 45, 638 (1992).
- Krug and Spohn (1990) J. Krug and H. Spohn, Phys. Rev. Lett. 64, 2332 (1990).
- Halpin-Healy and Assdah (1992) T. Halpin-Healy and A. Assdah, Phys. Rev. A 46, 3527 (1992).
- Wolf (1991) D. E. Wolf, Phys. Rev. Lett. 67, 1783 (1991).
- Kondev and Henley (1995) J. Kondev and C. L. Henley, Physical review letters 74, 4580 (1995).
- Hoshen and Kopelman (1976) J. Hoshen and R. Kopelman, Physical Review B 14, 3438 (1976).
- Saberi (2009) A. A. Saberi, Journal of Statistical Mechanics: Theory and Experiment 2009, P07030 (2009).
- Saberi (2010) A. A. Saberi, Applied Physics Letters 97, 154102 (2010).
- Olami and Zeitak (1996) Z. Olami and R. Zeitak, Phys. Rev. Lett. 76, 247 (1996).
- Wieland and Wilson (2003) B. Wieland and D. B. Wilson, Physical Review E 68, 056101 (2003).
- Jeong and Kim (2012) H. C. Jeong and J. M. Kim, Phys. Rev. E 85, 061118 (2012).
- Pagnani and Parisi (2015) A. Pagnani and G. Parisi, Phys. Rev. E 92, 010101 (2015).
- Korutcheva (2004) E. Korutcheva, Advances in condensed matter and statistical physics (Nova Publishers, 2004).
- Forrest and Tang (1990) B. M. Forrest and L.-H. Tang, Phys. Rev. Lett. 64, 1405 (1990).
- Tang et al. (1992) L.-H. Tang, B. M. Forrest, and D. E. Wolf, Phys. Rev. A 45, 7162 (1992).
- Halpin-Healy (2012) T. Halpin-Healy, Physical review letters 109, 170602 (2012).
- Oliveira et al. (2013) T. J. Oliveira, S. G. Alves, and S. C. Ferreira, Physical Review E 87, 040102 (2013).
- Halpin-Healy (2013) T. Halpin-Healy, Phys. Rev. E 88, 042118 (2013).
- Halpin-Healy (1990) T. Halpin-Healy, Phys. Rev. A 42, 711 (1990).