The Cross Spectral Time lags evolution along branches in XTE J1701-462
Abstract
We investigate the cross spectrum of XTE J1701-462 in various types of Neutron Star-Low Mass X-ray Binary subclasses, during its 2006-2007 outburst. We analyze the relation between the time lags and temporal variabilities. We find that the hard time lags accompany with the horizontal branch oscillations (HBOs) and the soft time lags dominate the noise in the low frequency range 0.1-10 Hz on HB. In the Cyg-like phase, the time lags decrease on the middle normal branch (NB) from HB/NB vertex to NB/FB vertex, whereas the time lags are roughly invariant in the Sco-like source. We discuss that the Compton upscattering by the corona introduces the soft lag in low frequency noise. We interpret that the variation of the Comptonization component from the disk emission lead to the HBOs’ time lags evolution along the Z tracks. We also report the rms amplitude spectrum and phase lag spectrum for the NBO. The phase lag is found. We present that the rms amplitude of both the Cyg-like and the Sco-like NBO linearly increase with the photon energy in low energy bands, and it will drop in the highest energy band.
1 Introduction
The Low mass X-ray binaries (LMXBs) are binary systems which contain a Neutron Star accreting material from a low mass companion star (see van der Klis (2006) for review). Based on the correlated X-ray spectral and timing properties, they can be divided into two subclasses, the Z sources with near Eddington luminosity () and the atoll sources with much lower luminosity (). The Color-Color Diagram (CD) and Hardness-Intensity Diagram (HID) of Z source have three branches, from top to bottom, which are so-called the horizontal branch (HB), the normal branch (NB) and the flare Branch (FB) (Hasinger & van der Klis, 1989), respectively. However, the CDs/HIDs of atoll sources are obviously different from those of the Z sources. A CD/HID of atoll sources also have three branches, the extreme island state, the island state, and the banana state. Usually, a complete track of the Z sources last from hours to days, whereas atoll sources last from weeks to months.
In terms of the orientation of branches, the Z sources are classified into the Cyg-like Z sources (Cyg X-2, GX 5-1 (catalog ), and GX 340+0 (catalog )) with a horizontal HB (“Z”-shaped tracks) and the Sco-like Z sources (Sco X-1 (catalog ), GX 17+2 (catalog ), and GX 349+2 (catalog )) with a vertical HB (“”-shaped tracks). The Fast Fourier Transform (FFT) algorithm was applied in order to obtain the power density spectra (PDS) of LMXBs. In some Z sources (Cyg X-2 (catalog ),GX 5-1 (catalog ), GX 340+0 (catalog ), GX 17+2 (catalog ), and so on), the HB Quasi-periodic oscillation (QPO) signals, which vary with frequencies in range from 13 Hz to 55 Hz, are observed in the power spectra. Almost all Z sources have 5-7 Hz QPO on NB and few of them have Hz QPO on FB. The radiation hydrodynamic model (Lamb, 1989; Fortner et al., 1989; Miller & Lamb, 1992) was proposed to explain the 6 Hz NBOs. In this model, the NBOs of Z sources arise from the optical depth oscillation of in-flowing medium near the neutron star scatting by the outgoing X-ray flux. This model also explained a minimum in the NBO rms amplitude spectrum when the phase lag spectrum showed phase jump. In Cyg X-2 (catalog ), a phase jump was observed around 6 keV, which was defined as pivot energy (Mitsuda & Dotani, 1989; Dieters et al., 2000). Moreover, the same phase jump was observed around 3.5 keV in GX 5-1 (catalog ). Both of these two Cyg-like sources displayed a minimum around pivot energy in the NBO rms amplitude spectrum. However, the Sco X-1 (catalog ) which belongs to Sco-like Z sources did not emerge a phase jump on the NB. The near- phase jumps observed in Cyg X-2 (catalog ) and GX 5-1 (catalog ) but not in Sco X-1 (catalog ) are consist with the classification of Z sources.
Two kinds of time lags were observed in LMXBs. Firstly, Lei et al. (2008) applied the cross correlation function to Cyg X-2 (catalog ) during its low-intensity states, and detected both anticorrelation and positive correlation with hectosecond soft and hard time lags. The anticorrelation and time lags were also observed in HB and upper NB of GX 5-1 (catalog ) (Sriram et al., 2012) which implied a truncated accretion disk in LMXBs. Secondly, van der Klis et al. (1987) used the Fourier cross spectrum technique to study the Cyg X-2 (catalog ) and GX 5-1 (catalog ). They found tens of milliseconds hard time lags, i.e., the hard photons lag the soft photons in HBOs and NBOs, and soft lags in low-frequency noise. Kaaret et al. (1999) discovered millisecond soft lags in the atoll source 4U 1636-536 (catalog ). Qu et al. (2001) found that Cir X-1 (catalog ) presents a hard lag on the HB and a soft lag on the NB and FB. In order to explain both soft lags and hard lags in LMXBs, several mechanisms, including a shot model (Vaughan et al., 1994), a uniform Comptonization model (Cui et al., 1997a), a two-layer corona model (Nobili et al., 2001; Qu et al., 2001) and a disk propagation model (Uttley et al., 2011), had been proposed.
The XTE J1701-462 (catalog ) is a unique LMXB source observed by Rossi X-ray Timing Explorer (RXTE) during its outburst in 2006-2007 (Remillard, 2006). At high luminosity, the XTE J1701-462 (catalog ) switched between a Cyg-like Z source and a Sco-like Z source and at low luminosity the transition from Z source to atoll source was observed (Homan et al., 2007; Lin et al., 2009; Homan et al., 2010). During these states, the shape of CDs/HIDs, the X-ray timing behavior and the X-ray spectra also changed. It provides us a great opportunity to understand the NBO behaviour, the time lag spectrum and the rms amplitude spectrum, between Cyg-like phase and Sco-like phase. We also utilize the cross spectrum to study the time lags evolution along with branches from Z source to atoll source.
In Section 2, we describe the observations and analysis techniques and our results are reported in Section 3. In Section 4 and 5, we present the discussion and conclusions.
2 Observations
We analysed all 866 observations of the LMXB XTE J1701-462 (catalog ) from its 2006-2007 outburst collected with the Proportional Counter Array (PCA) instrument on board of RXTE. During the outburst, the source showed X-ray spectral and timing behaviours of the Z source and the atoll source.
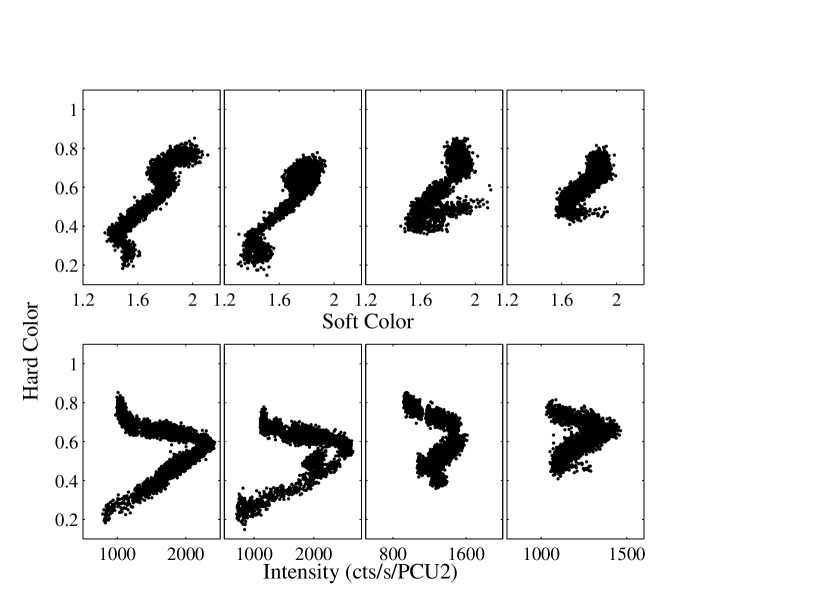
For all observations, we employed the following standard data selection criteria, a source elevation of , a pointing offset of and a SAA exclusion time of 30 minutes. We utilized the Heasoft 6.12 to extract background-subtracted light curves with a 16 s time resolution from the “Standard 2” mode data and no dead-time correction was applied. Only data from PCU 2 were used. In order to obtain the CDs/HIDs from the light curves, we define the soft color as 4.5-7.4 keV/2.9-4.1 keV (channels 10-17/6-9) count rates ratio, while the hard color as 10.2-18.1 keV/7.8-9.8 keV (channels 24-43/18-23) count rates ratio, then defined the intensity as count rates covering the energy range 2.9-18.1 keV (channels 6-43). Our data selection is listed in Table 1 and the CDs/HIDs are displayed in Fig. 1. The interval I and II belong to the Cyg-like source, Interval III and IV belong to the Sco-like source.
We used the single-bit and science event model data with 32 s segments and s time bin to created power density spectra (PDS) in frequency range 1/32 Hz-128 Hz. We studied the HBOs in energy range keV and the NBOs in energy range keV, because the NBOs were more apparent in keV than in keV (Homan et al., 2007). No background-subtracted and no dead time correction were applied. We employed the power spectral normalization of Miyamoto et al. (1991). And then, we fitted the power spectral using a multi-Lorentzian function (Nowak, 2000; Belloni et al., 2002) for the Interval I-IV. All parameters were set free (Pottschmidt et al., 2003; van Straaten et al., 2005). We obtained the centroid frequency , the full width half-maximum (, FWHM) and the fractional root-mean-squared (rms) of HBO. We plotted the power spectra in the power times frequency representation (, in units of ), where each power spectral density is multiplied by its Fourier frequency .
We also extracted five energy bands, i.e., 2.06 - 4.49 keV (channels 0-10, CH1), 4.9 - 7 keV (channels 11-16, CH2), 7.4 -9.4 keV (channels 17-22, CH3), 9.8 - 14.8 keV (channels 23-35, CH4), 15 - 65 keV (channels 36-149, CH5), to compute cross spectra. The cross spectrum (Nowak et al., 1999) is defined as , where and are the measured complex Fourier coefficients at a given frequency for soft and hard energy bands, respectively. The phase lag between two energy bands light curves is the Fourier phase . The time lag is constructed from by dividing by , i.e., . A positive time lag indicates that the hard photons lag the soft photons. The cross spectra of XTE J1701-462 (catalog ) show that the phase lag above 100 Hz are consistent with . This is dead time effect which should be corrected by subtracting a cross vector, averaged over 100 to 128 Hz (van der Klis et al., 1987; Vaughan et al., 1999). Hectohertz QPOs and kHz QPOs were observed in XTE J1701-462 (catalog ) (Homan et al., 2010; Sanna et al., 2010), the subtracted cross vector might be combined with the white noise and signal. However, the signal above 100 Hz can be dismissed compared with the noise amplitude. We computed the time lags of CH2 - CH5 relative to CH1 of NBO and investigated the time lags evolution along with HB between 9.8 - 14.8 keV and 2 - 4.5 keV.
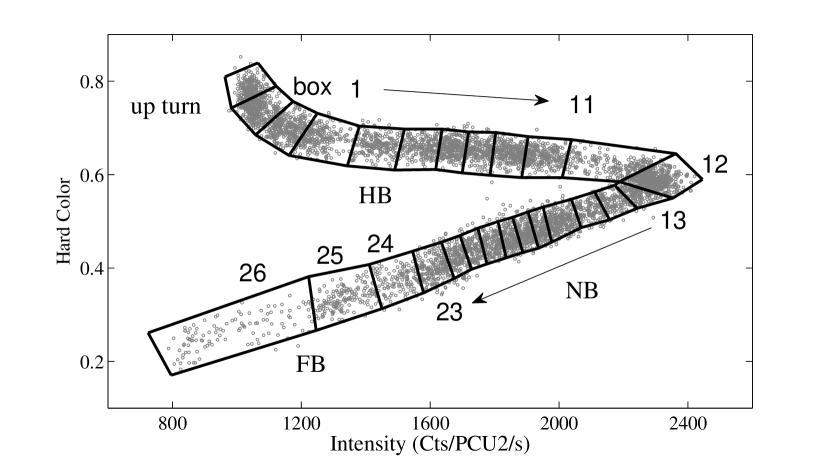
To investigate the correlation between the data position in the HID and the temporal properties, we introduce a rank number defined by Hasinger et al. (1990). In Fig. 2, we set the of box 12 and 24 as 1 and 2, respectively. The rank numbers of other boxes are decided by spline interpolation (Dieters & van der Klis, 2000; Lin et al., 2012).
3 Results
3.1 Time lags evolution along HB in the Cyg-like phase
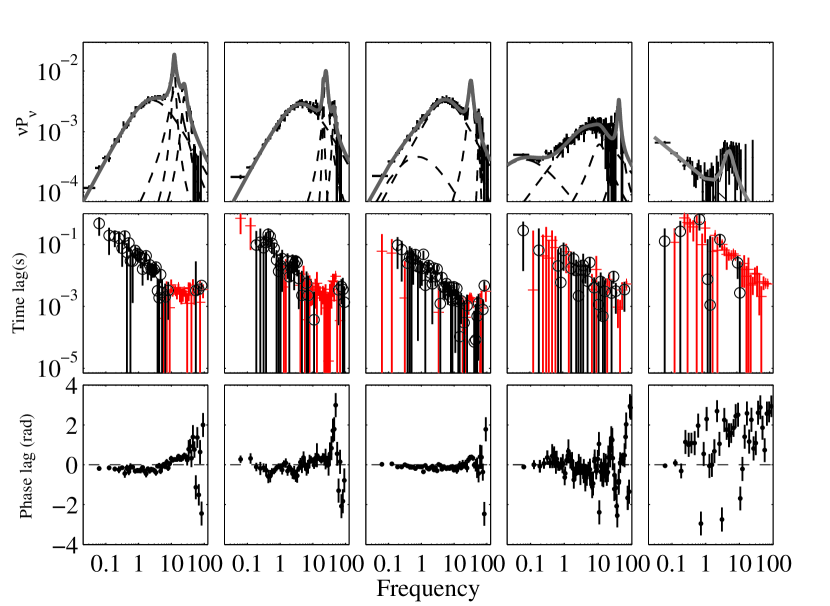
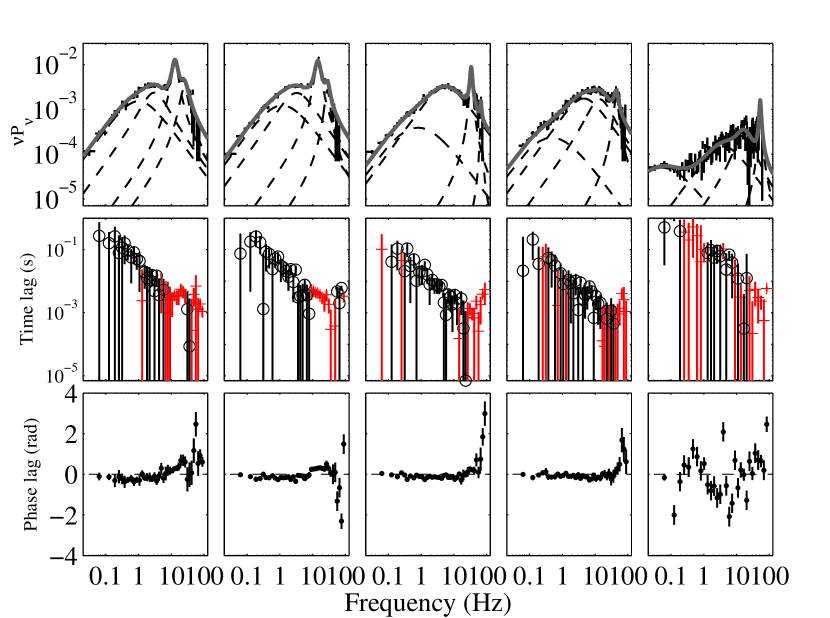
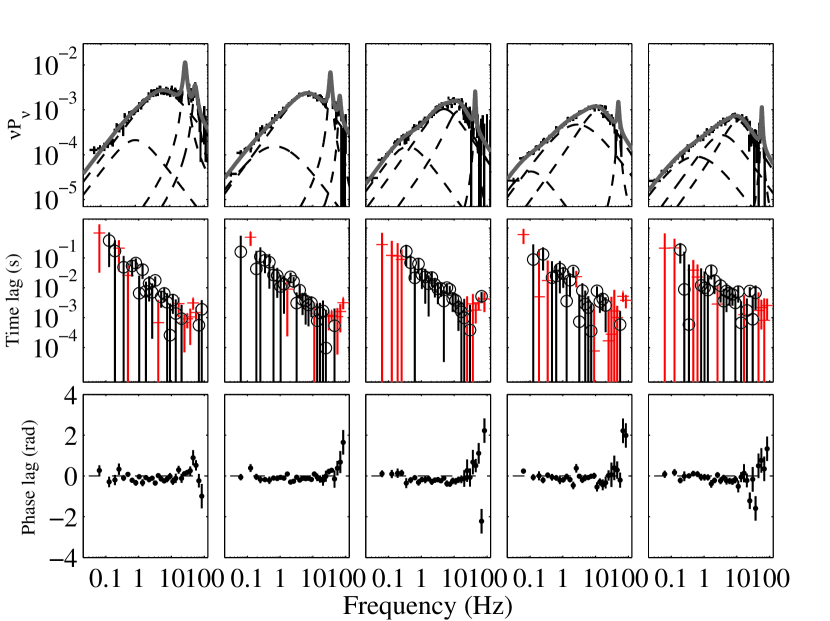
We calculate the PDSs and average cross spectra for XTE J1701-462 (catalog ) in the Cyg-like Z phase (Fig. 3 and Fig. 4) and in the Sco-like Z phase (Fig. 5). Positive lags indicate that the hard photons (9.8-14.8 keV) lag the soft photons (2-4.5 keV). In Fig. 3, the cross spectra of Interval I show hard lags (red ‘+’) during QPOs’ frequency range on HB. The red noises below 10 Hz display soft time lags (black ‘o’) on HB. The time lags of NB are dominated by hard lags. In Fig. 4, the HBOs and cross spectra of Interval II are present. The time lags on HB of Interval II and Interval I have similar behaviours. In Fig. 5, the hard lags are accompanied by QPOs and the soft lags are observed less than 10 Hz on HB. Meanwhile, we plot the phase lag versus frequency in Fig. 3-5, which clearly show the intrinsic phase lag couple with QPO appearing.
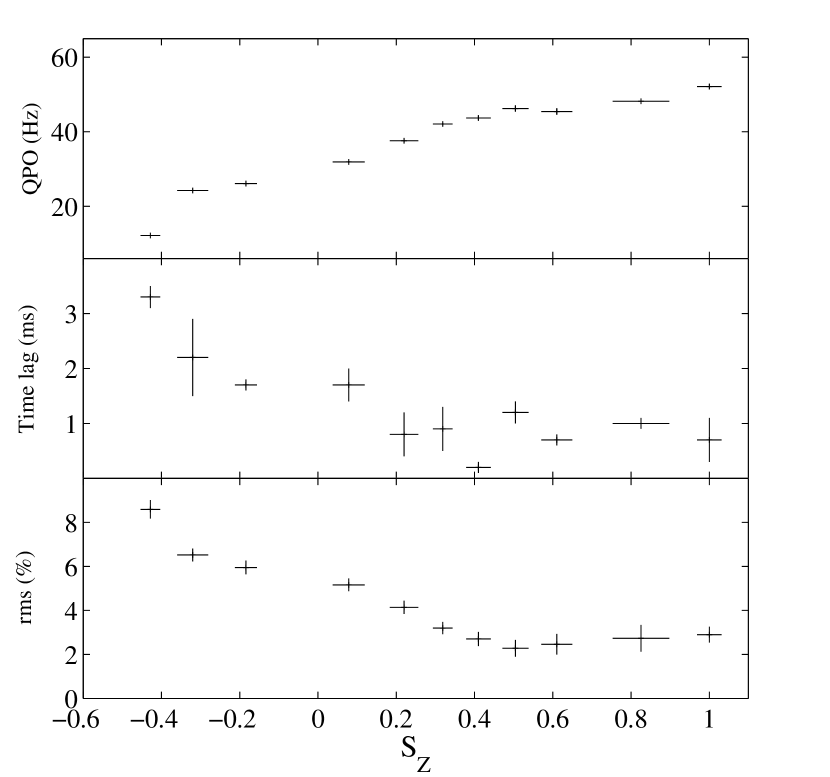
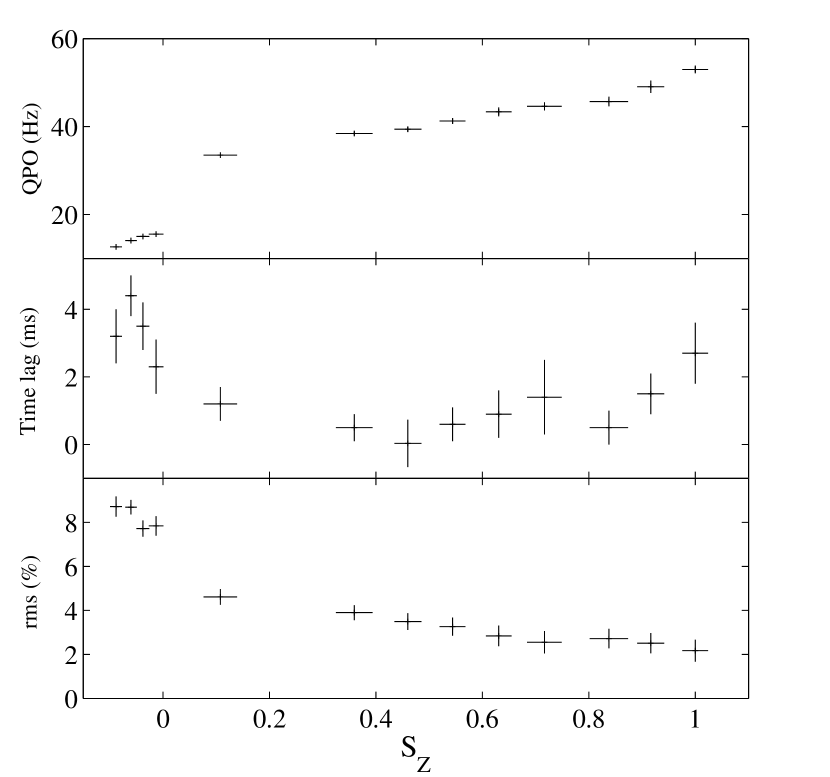
In order to investigate the correlation between and temporal variabilities, we average the time lags of QPOs over the frequency between and . In Fig. 6, we display the QPO centroid frequencies, the time lags and rms of the HBOs as a function of in Interval I. The centroid frequencies of HBO increase from Hz to Hz, but the time lags and rms of HBO decrease when is below 0.5, then remain constant when is larger than 0.5. As a contrast, we provide the same temporal variabilities of Interval II in Fig. 7. We notice that the centroid frequencies and the rms of HBOs are similar with interval I. However, The time lags rapidly decrease when less than 0.5, then the time lags slowly increase with . All time lags are hard lags with several milliseconds.
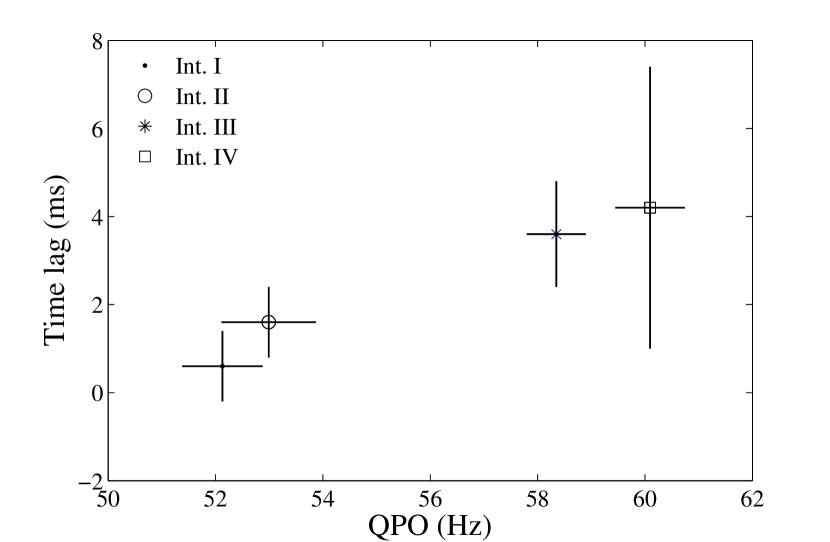
For different HIDs, the intensity of the HB/NB vertex and the NB/FB vertex were considered as reference value for the accretion rate . In order to study the time lag - accretion rate connection, we also calculate the time lag between 7.4 - 9.4 keV and 2 - 4.5 keV in the HB/NB vertex region of Interval I-IV. In Fig. 8, the QPO centroid frequency positively correlates with the time lag. Both of them are followed by source intensity decreasing, that is the accretion rate decreasing (Lin et al., 2009). We should notice that the source intensity difference between Interval I and Interval II are small (upper panel in Fig. 1) and the time lags are extremely close too.
3.2 Time lags evolution of the Z phase on NB
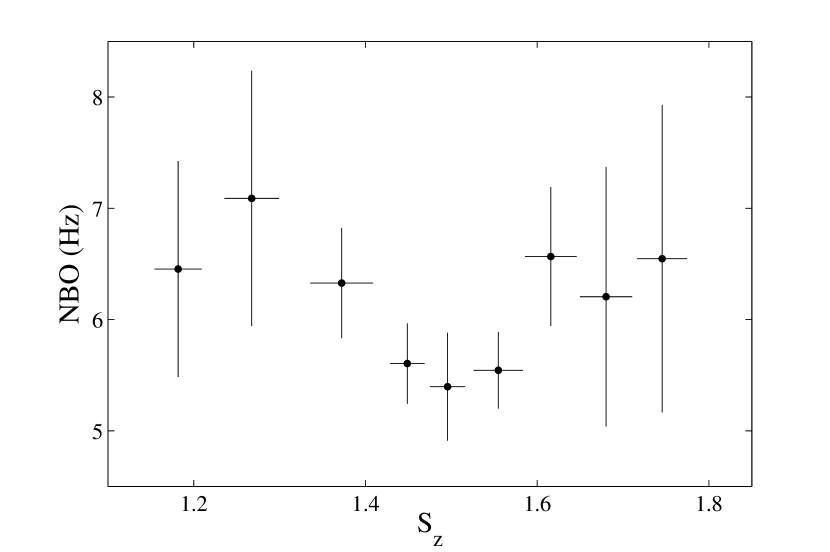
In Fig. 9, we show the variation of NBO in Interval I. The centroid frequencies of NBO are around 6 Hz which consist with other Z sources. In order to study the time lags along NB, we average the time lags with a fixed frequency range 62 Hz, between 7.4 - 9.4 keV and 2 - 4.5 keV.
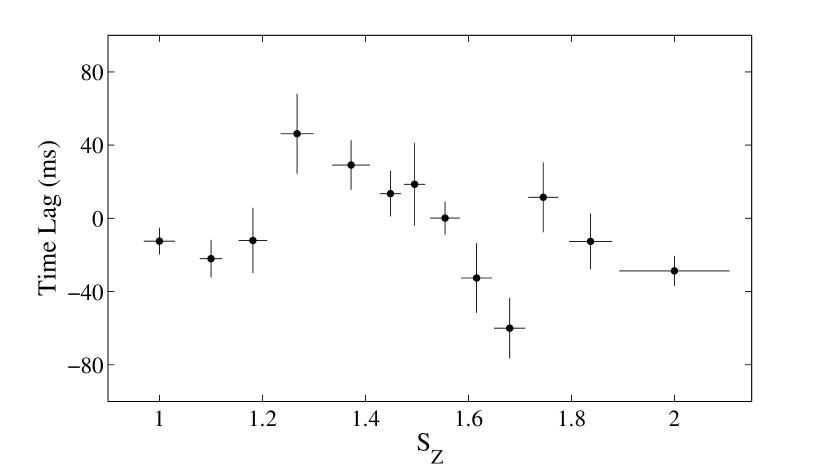
In Fig. 10, we display the time lags evolution from HB/NB vertex to NB/FB vertex of Interval I. The time lags are nearly constant on upper NB () and lower NB (), and reduce from ms to ms on middle NB ().
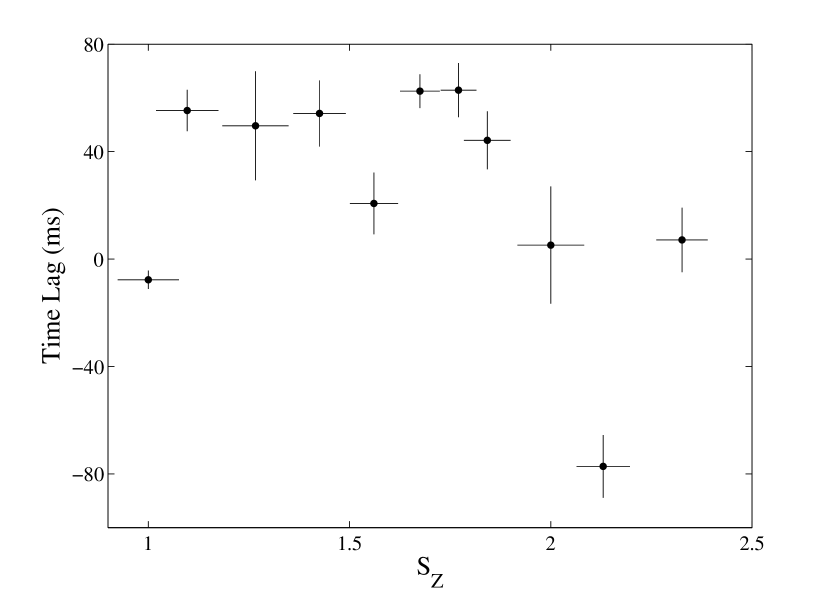
In Fig. 11, the time lags as a function of on NB and FB of Interval III are reported. Between HB/NB vertex and NB/FB vertex, the time lags averaged over 4-8 Hz are nearly constant around 50 ms.
3.3 The time lags spectrum and rms amplitude spectrum of NBOs in the Cyg-like phase and the Sco-like phase
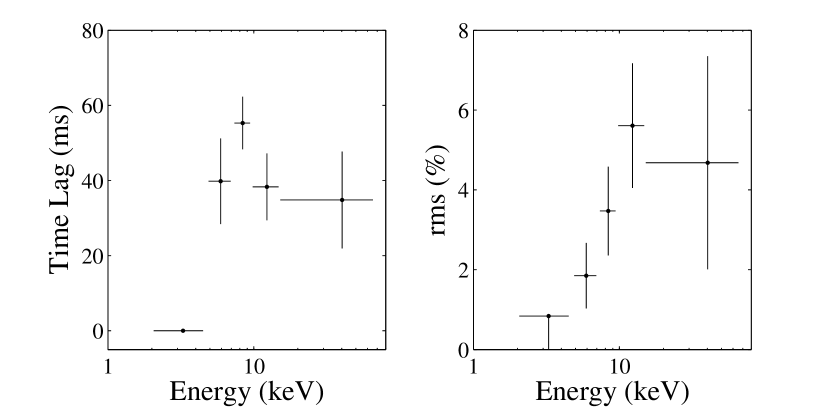
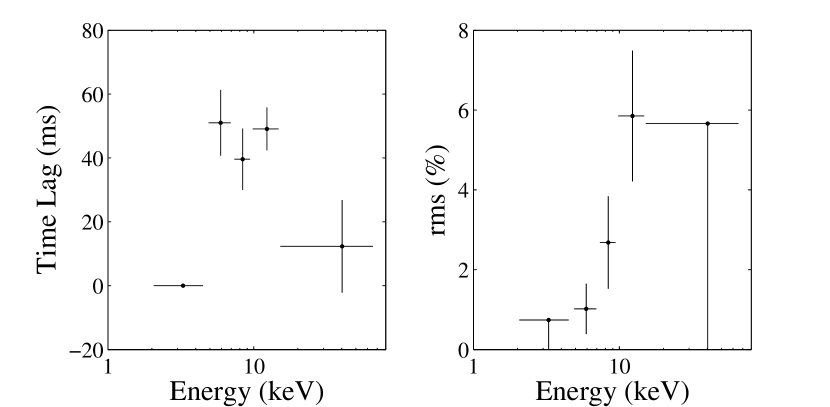
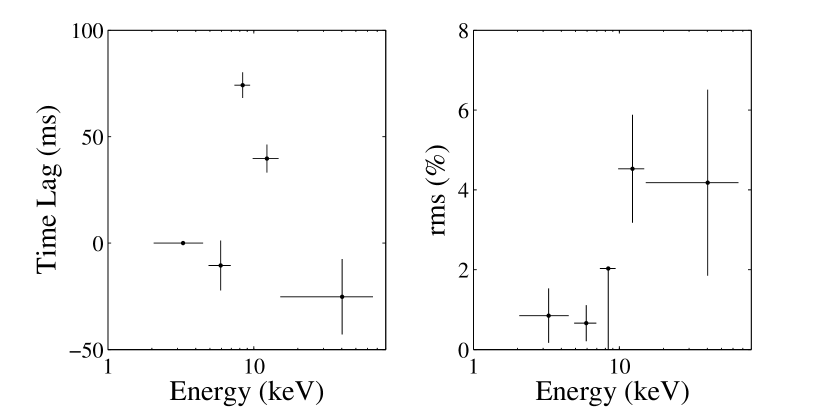
We extracted the the Cyg-like phase and the Sco-like phase NBOs with five energy bands light curves, 2.06 - 4.49 keV (channels 0-10, CH1), 4.9 - 7 keV (channels 11-16, CH2), 7.4 -9.4 keV (channels 17-22, CH3), 9.8 - 14.8 keV (channels 23-35, CH4), 15 - 65 keV (channels 36-149, CH5), respectively. The NBOs’ time lags of CH2 - CH5 against CH1 are computed. For each energy band, the rms of NBO is obtained by fitting the relative PDS with a fixed centroid frequency and FWHM. We defined the time lags as a function of energy “time lag (or phase lag) spectrum” and the rms as a function of energy “ rms amplitude spectrum”.
In Fig. 12, we notice that the maximum time/phase lag on the lower NBO is 557 ms or in Interval I, respectively. On the lower NB of Interval III , the time/phase lag is 496 ms or (Fig. 13). On the lower NB of Interval IV, the time/phase lag are slightly larger than Interval I and III, i.e., 7416 ms or (Fig. 14). The near- phase jumps occur around 10 keV in both the Cyg-like phase and the Sco-like phase.
Regardless of CH5, the rms amplitude of NBOs linearly correlate with energy in the range 2 - 15 keV (i.e., the signal strength of QPOs are proportional to the photon energy.) of Interval I and III (right panels in Fig. 12 and Fig. 13). The rms energy dependence was also observed in Sco X-1 (catalog ) (Wang et al., 2012). Because of low count rates and low signal-to-noise in the highest energy band, the rms of NBOs have large error bars. The drop of the rms amplitude in the highest band was appeared. A pivot energy in 4.9-7 keV appears in the rms amplitude spectrum of Interval IV (right panel in Fig. 14) but with a weak tendency.
4 Discussion
The LMXB source XTE J1701-462 (catalog ) transited from a Z source into an atoll source during its outburst. We used the FFT to compute the PDS of XTE J1701-462 (catalog ). For the Cyg-like observations (Interval I & II), the centroid frequencies of HBO increase from 12 Hz to 53 Hz, while the amplitude of HBO becomes weaker. The cross spectra of HBO were computed as well. In Fig. 3 and Fig. 4, we found that the time lags of low frequency noise less than 10 Hz are dominated by soft lags. Moreover, the soft lag increases towards low frequency. When QPOs appeared, the XTE J1701-462 (catalog ) showed hard lags, i.e., high energy photons lag soft photons. For the NB observations of the Cyg-like phases and the Sco-like phases, the hard lags were also observed during NBOs’ frequency range. These also appeared in other Z sources (van der Klis et al., 1987; Vaughan et al., 1994; Qu et al., 2001, 2004). We also study the time lags evolution along NB in the Z sources. In Interval I, the time lags averaged between 4 Hz and 8 Hz decrease on middle NB as a function of rank number (Fig. 10). This could be the centroid frequency and rms amplitude variation of the NBO (Fig. 9). In interval III, the time lags of NBO nearly remained 50 ms (Fig. 11). For the HB/NB vertex regions in the Z sources, the time lag increased with the source intensity decreased, which is the trend of accretion rate decreased.
In order to explain the observed time lag in compact star system(e.g., BH-, NS-LMXBs, AGNs, and so on), many models are proposed, including the shot model (Vaughan et al., 1994), the propagation of accretion fluctuations model (Uttley et al., 2011), and the Comptonization models (Cui et al., 1997b; Kazanas et al., 1997). The shot model mathematically explained the observed power spectra in LMXBs (Alpar & Shaham, 1985), the soft lag in the low frequency noise (Shibazaki et al., 1987) and the hard lag in the HBO simultaneously (Vaughan et al., 1994). It regarded the HBO as the signature of intensity modulation and the low frequency noise as the power spectral signature of shots, when the accretion matter fall onto the Neutron Star surface. The observed soft lag of low frequency noise could be interpreted if the shot envelopes in the soft energy band lag those in the hard energy band. Meanwhile, the hard lag in the HBO may originate from a particular delaying of the QPO production in high energy band without distinctly interfering by low frequency noise.
The time lag in the hard state of BH-LMXBs which displays hard lag in low frequency noise shows the exactly opposite to our results (Nowak et al., 1999; Pottschmidt et al., 2003; Uttley et al., 2011). Nowak et al. (1999) investigated the hard state time lag in the Cyg X-1 and found that the energy dependence of hard lag in low frequency noise as well as the hard lag increase with decreasing low Fourier frequency. It seems contradictory to the uniform and compact Comptonization corona model. Uttley et al. (2011) pointed out that the observed hard lag in GX 339-4 corresponds to the viscous propagation of mass accretion instabilities through the disk. The emission of BH-LMXBs contains two parts, the power law dominant in the high energy band and the disk black body dominant in the low energy band. When the mass accretion fluctuations happened, the variabilities of disk black body emission lead to the power law emission variations on time scales of seconds. If the low frequency noise comes from these two components variations, then the hard lag appears. For the soft lag, it may be responsible by the power law illuminating the black body on time scales of milliseconds, where the the power law emission regions locate about tens of to the disk.
However, XTE J1701-462 shows more complicated emission mechanism than BH-LMXBs (Lin et al., 2009; Ding et al., 2011). On the HB, the energy spectral of XTE J1701-462 is composed of the multi-color black body from the disk, the black body from the NS surface and the cutoff power law from the corona above the disk, which dominate the emission in several keV, tens of keV and the hard tail respectively. On the NB and FB, the cutoff power law component becomes too faint to be detected. We indicate that there exist three possible lag mechanisms, the Compton upscattering by the corona (Kotov et al., 2001; Arvalo & Uttley, 2006), the propagation of the accretion rate instabilities in the disk (Uttley et al., 2011) and the disk illuminating by the black body from the NS surface in XTE J1701-462. However, the soft lag introduced by the NS X-ray illuminating is likely the time scale of light travel from the NS to the disk, which is too low () compared to our calculations. The propagation of the accretion rate instabilities in the disk only produce hard lag in low frequency noise which is not conform to the soft lag in XTE J1701-462.
The uniform Comptonization models (Payne, 1980; Kazanas et al., 1997) can not interpret the energy dependence of hard time lag and soft time lags in LMXBs. In order to explain soft lags and time lags evolution of QPOs, a Comptonization model with two-layer corona was proposed (Nobili et al., 2001; Qu et al., 2001). When photons pass through the two-layer corona, the photons encounter the inverse Compton scattering by hot electrons and gain energy. If the inner layer is hot and optical depth is , the hard photons are scattering more than the soft photons and the hard time lags observed. If the inner layer is optical thick, the photons are efficiently upscattered. When the harder photons pass through the out part corona with lower temperature, they will lose energy and the soft lags appear.
Qu et al. (2001) explained that the accretion rate changing along branches leads to the Cir X-1 (catalog ) time lag evolution. From multiwavelength campaigns of Cyg X-2, the monotonically increasing in from the HB, via the NB, to the FB was reported (Hasinger et al., 1990; Vrtilek et al., 1990). If the accretion rate of XTE J1701-462 arise from the HB to the NB, the hot electrons in the inner layer corona are cooled by photons from the disk. This process will shrink the inner lay corona and the observed HBO time lags become smaller. Lin and co-workers (Lin et al., 2009; Homan et al., 2010; Lin et al., 2012) concluded that the accretion rate did not vary significantly along the Z tracks but did along secular change, i.e. decrease from the Z source to an atoll source. The time lag - QPO relation of the HB/NB vertex could be explained by the accretion rate decreasing (Fig. 8). However, for the time lags evolution on the HB of XTE J1701-462, when the source intensity increased, the disk luminosity which was mainly contributed by Comptonization ascended simultaneously (see Fig. 20 in Lin et al. (2009)). When the luminosity of the disk component increases from the up turn to the HB/NB vertex, the temperature of the inner layer corona cool down through Compton emission and then lead to a smaller radius layer. Because the photons contributing to the HBO came from the disk, the time lags of HBO decrease as a function of was also observed. In a Z track, the time lag of HBO increasing towards high source intensity can be explained by the accretion rate increasing and the Comptonization component variations. Jackson et al. (2009) and Church et al. (2010) suggested an opposite accretion rate increasing direction, i.e., from the NB to the HB, which could not reasonably explain the time lags evolution of XTE J1701-462.
The near-180∘ phase lag and the dip in rms amplitude spectrum were observed in Cyg X-2 (catalog ) and GX 5-1 (catalog ), but did not show in Sco X-1 (catalog ). Dieters et al. (2000) provided two explanations for the NBOs behavior for Cyg X-2 (catalog ) and GX 5-1 (catalog ) and Sco X-1 (catalog ). Firstly, they may have different viewing angle. Secondly, with the radiation-hydrodynamic model for the QPOs, the QPO of GX 5-1 (catalog ) and Sco X-1 (catalog ) are determined by optical depth oscillations while the QPOs of GX 5-1 (catalog ) are determined by luminosity variation, where the NS of GX 5-1 (catalog ) has a weaker magnetic field. XTE J1701-462 (catalog ) changes from a Cyg-like Z source, via a Sco-like Z source, to an atoll source in two years. The binary inclination and the strength of the NS magnetic field are invariant on such a short timescale (Kuulers et al., 1994; Psaltis et al., 1995). The accretion rate dominates the whole processes. We found near-160∘ phase lag of NBOs both in Cyg-like phase and Sco-like phase which are consistent with Cyg X-2 (catalog ) and GX 5-1 (catalog ). However, no pivot energy in rms amplitude spectrum was observed in the Cyg-like phase. This can not be explained by the radiation-hydrodynamic model (Fortner et al., 1989). Wang et al. (2012) interpreted that the NBO and the rms energy dependence in Sco X-1 originate from the transition layer. The similar behaviors of time lag spectrum and rms amplitude spectrum between the Cyg-like sources and the Sco-like sources indicate that the NBOs are irrelevant to the luminosity variation in XTE J1701-462 (catalog ).
5 Conclusions
We investigated the cross sprctral and the QPOs for the Cyg-like phase and the Sco-like phase of XTE J1701-462. The QPOs increase from 12 Hz to 53 Hz on the HB and remain Hz on the NB. These consist with other Z sources. We also computed the time lags and HBOs for the HB/NB vertexes (Interval I-IV). The two-layer corona Comptonization model can explain the soft lag in low frequency noise and hard lag in HBO respectively. Both the accretion increasing and the Comptonization component variation can produce the HBOs’ time lag evolution. For a NS-LMXB, we could not deduce its accretion rate increasing direction along branches in the HID only from the time lag variation. The spectral states should be analyzed simultaneously. This will be discussed in our future work.
References
- Alpar & Shaham (1985) Alpar, M.A., & Shaham, J., 1985, Nature, 316, 239
- Arvalo & Uttley (2006) Arvalo P., Uttley, P., 2006, MNRAS, 367, 801
- Belloni et al. (2002) Belloni, T., Psaltis, D., & van der Klis, M. 2002, ApJ, 572, 392
- Böttcher & Liang (1999) Böttcher, M. & Liang, E. P. 1999, ApJ, 511, L37
- Church et al. (2010) Church et al., 2010, A&A, 529, A9
- Cui et al. (1997a) Cui, W., et al., 1997, ApJ, 474, L57
- Cui et al. (1997b) Cui, W., Zhang, S.N., Focke, W., & Swank, J.H., 1997b, ApJ, 484, 383
- Ding et al. (2011) Ding, G. Q., Zhang, S. N., Wang, N., Qu, J. L., & Yan, S. P. 2011,ApJ, 142, 34
- Dieters et al. (2000) Dieters, S., Vaughan, B., Kuulkers, E., Lamb, F., & van der Klis 2000, A&A, 353, 203
- Dieters & van der Klis (2000) Dieters, S., & van der Klis 2000, MNRAS, 311, 201
- Fortner et al. (1989) Fortner, B., Lamb, F. K.,& Miller, G. S. 1989, Nature, 342, 775
- Hasinger et al. (1989) Hasinger, G., Priedhorsky, W. C., & Middleditch, J. 1989, ApJ, 337, 843
- Hasinger & van der Klis (1989) Hasinger, G., & van der Klis, M. 1989, A&A, 225, 79
- Hasinger et al. (1990) Hasinger G., van der Klis M., Ebisawa K., Dotani T., & Mitsuda K., 1990, A&A235, 131
- Homan et al. (2007) Homan, J., et al. 2007 ,ApJ,656, 420
- Homan et al. (2010) Homan, J. et al., 2010, ApJ, 719, 201
- Jackson et al. (2009) Jackson, N. K., Church, M. J., Church, M. B., 2009, A&A, 1059, 1071
- Kazanas et al. (1997) Kazanas, D., Hua, X. M., & Titarchuk, L. 1997, ApJ, 480, 735
- Kaaret et al. (1999) Kaaret, P.; Piraino, S., Ford, E. C., & Santangelo, A. 1999, ApJ, 514, L31
- Kotov et al. (2001) Kotov O., Churazov E., & Gilfanov M., 2001, MNRAS, 327, 799
- Kuulers et al. (1994) Kuulers, E., et al., 1994, A&A, 289, 795
- Lamb (1989) Lamb F.K., 1989 in: Two Topics in X-ray Astronomy, 23rd ESLAB Symp., J. Hunt, B. Battrick (eds.) 1989, ESA SP-296, v1, p. 215
- Lei et al. (2008) Lei, Y. J., Qu, J. L., Song, L. M., Zhang, C. M., Zhang, S., Zhang, F., Wang, J. M., & Zhang, G. B. 2008, ApJ, 677, 461
- Lin et al. (2009) Lin, D. C., Remillard, R. A., Homan, J. 2009, ApJ, 696, 1277
- Lin et al. (2012) Lin et al. 2012, arXiv, 1207.1107v1
- Miller & Lamb (1992) Miller G.S., & Lamb F.K., 1992, ApJ, 388, 541
- Mitsuda & Dotani (1989) Mitsuda K. & Dotani T., 1989, PASJ, 41, 557
- Miyamoto et al. (1991) Miyamoto, S., et al., 1991, ApJ, 383, 784
- Nobili et al. (2001) Nobili, L., Turolla, R. & Zampieri, L. 2001, ApJ, 538, L137
- Nowak et al. (1999) Nowak, M. A., Vaughan, B. A., Wilms, J., Dove, J. B., & Begelman, M. C. 1999, ApJ, 510, 847
- Nowak (2000) Nowak, M. A., 2000, MNRAS, 318, 361
- Payne (1980) Payne, D. G. 1980, ApJ, 237, 951
- Pottschmidt et al. (2003) Pottschmidt, K., et al. 2003, A&A, 407, 1039
- Psaltis et al. (1995) Psaltis, D., Lamb, F. K., & Miller, G. S. 1995, ApJ, 454, L137
- Qu et al. (2001) Qu, J. L., Yu, W., & Li, T., P. 2001, ApJ, 555,7
- Qu et al. (2004) Qu, J. L., Chen, Y., Wu, M., Chen, L., & Song, L. M. 2004, Ap&SS, 293, 411
- Reig et al. (2000) Reig, P., Belloni, T., & van der Klis, M. 2000, ApJ, 541, 883
- Remillard (2006) Remillard, R. A., & Lin, D., The ASM Team at MIT and NASA/GSFC 2006, Astron. Tel., 696
- Sanna et al. (2010) Sanna, A., et al., 2010, MNRAS, 408, 622
- Shibazaki et al. (1987) Shibazaki, N., et al., 1988, ApJ, 331, 247
- Sriram et al. (2012) Sriram, K., Choi, C. S., & Rao, R. A. 2012, ApJS, 200, 16
- Stella & Vietri (1998) Stella, L. & Vietri, M. 1998, ApJ, 492, L59
- Uttley et al. (2011) Uttley, P., Wilkinson, T., Cassatella P., Wilms J., Pottschmidt K., & Hanke M., 2011, MNRAS, 414, L60
- van der Klis et al. (1987) van der Klis, M., Hasinger, G., Stella, L., Langmeier, A., van Paradijs, J., Lewin, & W. H. G. 1987, ApJ, 319, L13
- van der Klis (2006) van der Klis, M. 2006, in Compact Stellar X-ray Sources (eds. W. Lewin & M. van der Klis, Cambridge University Press)
- van Straaten et al. (2005) van Straaten, S., van der Klis, M., & Wijnands, R., 2005, ApJ, 619
- Vaughan et al. (1994) Vaughan, M., van der Klis, M. and Wijers, R. 1994, ApJ421,738
- Vaughan et al. (1999) Vaughan, M. et al., 1999, A&A, 343, 197
- Vrtilek et al. (1990) Vrtilek, S. D., et al. 1990, A&A, 235, 162
- Wang et al. (2012) Wang, J., Chang, H. K. & Liu, C. Y. 2012, arXiv:1207.3407v1
| Interval | Begin of date | Begin of Obs. | End of date | End of Obs. | Source Type |
|---|---|---|---|---|---|
| (DD/MM/YY) | (DD/MM/YY) | ||||
| I | 21/01/06 | 91106-01-04-00 | 31/01/06 | 91106-02-02-10 | Cyg-like |
| II | 02/02/06 | 91106-02-02-14 | 12/02/06 | 91442-01-01-02 | Cyg-like |
| III | 17/02/06 | 91442-01-07-02 | 25/02/06 | 91442-01-03-03 | Sco-like |
| IV | 08/03/06 | 92405-01-01-05 | 15/03/06 | 92405-01-02-05 | Sco-like |