Gamma-ray observations of Cygnus X-1 above 100 in the hard and soft states
Abstract
We present the results of multi-year gamma-ray observations by the AGILE satellite of the black hole binary system Cygnus X-1. In a previous investigation we focused on gamma-ray observations of Cygnus X-1 in the hard state during the period mid-2007/2009. Here we present the results of the gamma-ray monitoring of Cygnus X-1 during the period 2010/mid-2012 which includes a remarkably prolonged ‘soft state’ phase (June 2010 – May 2011). Previous 1–10 observations of Cyg X-1 in this state hinted at a possible existence of a non-thermal particle component with substantial modifications of the Comptonized emission from the inner accretion disk. Our AGILE data, averaged over the mid-2010/mid-2011 soft state of Cygnus X-1, provide a significant upper limit for gamma-ray emission above 100 of , excluding the existence of prominent non-thermal emission above 100 during the soft state of Cygnus X-1. We discuss theoretical implications of our findings in the context of high-energy emission models of black hole accretion.We also discuss possible gamma-ray flares detected by AGILE. In addition to a previously reported episode observed by AGILE in October 2009 during the hard state, we report a weak but important candidate for enhanced emission which occurred at the end of June 2010 (2010-06-30 10:00 - 2010-07-02 10:00 UT) exactly in coincidence with a hard-to-soft state transition and before an anomalous radio flare. An appendix summarizes all previous high-energy observations and possible detections of Cygnus X-1 above 1 .
Subject headings:
gamma rays: observations — stars: individual (Cygnus X-1) — stars: winds, outflows — X-rays: binaries1. Introduction
Cygnus X-1 (Cyg X-1) is the archetypal black hole binary system in our Galaxy. It is composed of a compact object and a O9.7 Iab supergiant star companion with a mass estimate ranging between , filling 97 of its Roche Lobe (Gierlinski et al., 1999; Caballero-Nieves et al., 2009). The measurements of the mass for the compact object range from 4.8 to 14.8 (Herrero et al., 1995; Shaposhnikov & Titarchuk, 2007; Orosz et al., 2011), suggesting identification with a black hole. Being one of the brightest sources in the X-ray sky and having a persistent emission, the literature on the system is extremely rich and extensive monitoring in radio, IR, UV and X-rays has been carried out (Mirabel et al., 1996; Pooley et al., 1999; Fender et al., 2000; McConnell et al., 2002; Gallo et al., 2003; Pandey et al., 2006; Del Monte et al., 2010; Rahoui et al., 2011; Jourdain et al., 2012), leading to interesting correlations and being of great importance for understanding the process of accretion onto black holes in general.
Typical X-ray spectral states of Cyg X-1 have been classified into the ‘hard/low’ and ‘soft/high’ states, which are defined according to the spectral behaviour at X-ray energies ( ). The source usually spends 90 of its time in the low/hard spectral state whose spectral energy distribution is well described by a power-law (E-γ) with photon index 1.7, a very prominent broad emission peak of the power spectral energy density () near 100 , and a high-energy cutoff at 150 . The less common soft state is characterized by the absence of the prominent peak near 100 , a strong blackbody component with kT 0.5 , and a soft power-law tail with usually ranging between 2 and 3. Intermediate spectral states also exist (see, e.g., Belloni et al., 1996) and a number of different spectral shapes have been reported in the literature (e.g., INTEGRAL observations, Del Santo et al., 2013 and references therein).
The different spectral states are usually described by the interplay of a relatively cool accretion disk and a hot optically thick corona surrounding the central source. In the hard state, the spectral energy distribution can be modeled by Comptonization of abundant soft blackbody photons from the inner accretion disk which scatter off the energetic electrons of the optically thick corona (e.g., Coppi 1999, 2006; Zdziarski et al. 2002, 2004, 2011, 2012). A crucial property of this corona, energized by the accretion process onto the black hole, is its ability to add a non-thermal tail to an otherwise thermal distribution of electrons, possibly extending to the gamma-ray energy range. This process of non-thermal energization of coronal electrons is strongly constrained in the Cyg X-1 hard states by the apparent cutoff observed above 150 (Gierlinski et al., 1997; McConnell et al., 2002) and by the absence of detectable gamma-ray emission above 100 (Sabatini et al., 2010a). In the transition to the soft state, the Comptonizing corona shrinks, the cool disk moves inwards (possibly very close to the last stable orbit), and non-thermal processes, if existing, can be revealed by emission above the disc blackbody component, in particular with the detection of prominent power-law components above the energy range in the soft spectral state.
For many years, the only available information on the spectral states of Cyg X-1 above energies was the data collected by the COMPTEL instrument on board of the CGRO (Collmar, 2003). Cyg X-1 remained in the hard state for most of the CGRO observations, as monitored by the hard X-ray instrument BATSE (McConnell et al., 2002). However, during the CGRO lifetime, two transitions to Cyg X-1 soft states were studied by the combined effort of the OSSE, COMPTEL and EGRET instruments (see the Appendix for more details of these important observations). Cyg X-1 transitions to the soft state are relatively rare (e.g., Zhang et al., 1997a), and not well understood theoretically. A very significant non-thermal emission episode was detected by COMPTEL in one case111 In the following, we are going to take the COMPTEL detection of Cyg X-1 in the soft state reported by McConnell et al. (2002) as a typical soft-state emission by a non-thermal component. with a maximum photon energy recorded at 5–10 (McConnell et al.1997; 2002). This detection was for many years the only indication of a possible non-thermal component in the soft state spectrum of Cyg X-1, and stimulated many investigations and speculations about its nature (Gierlinski et al., 1999; Zdziarski et al., 2002). In particular, the detection of emission up to 100 and beyond would test hybrid Comptonization spectral models of black hole emission. As a result, there has been great interest in new gamma-ray data from Cyg X-1 in a soft state by the current generation of gamma-ray space instruments (AGILE and Fermi).
In a previous paper we reported on the gamma-ray observations of Cyg X-1 by the AGILE satellite that were obtained during the period 2007–2009, during which the source was in a prolonged hard state (Sabatini et al., 2010a). Here we present the results of the AGILE gamma-ray monitoring of Cyg X-1 during the 2010/mid-2012 period. This period includes the June 2010 event during which the system underwent a clear spectral transition from the hard to the soft state and unusually remained in the soft state for almost a year. This gave us the unprecedented opportunity to carry out a long term monitoring of the soft spectral state of Cyg X-1 at gamma-ray energies and investigate on the possible existence of prominent emission above 100 .
Gamma-ray data in the Cyg X-1 soft state are of crucial importance for theoretical modeling because they constrain the high energy part of the spectrum, most likely dominated by non-thermal emission. Of particular interest are observations that can determine a clear cutoff in the spectra at high energies, since the cutoff energy is a function of the compactness of the inner source region.
For a proper evaluation of the physical properties of Cyg X-1 in different accretion states, it is important to consider also radio and X-ray emission in addition to gamma-ray data above 50 . In particular, for many years Cyg X-1 has been monitored in search of non-thermal radio jets. Radio emission is observed to be persistent with a modulation related to the orbital period of the system (Zhang et al., 1997b; Stirling et al., 2001) during the hard states and presents a strong decrease during soft states (see e.g., Zdziarski et al., 2011). Definitive evidence for a resolved extendend relativistic radio jet was provided by Stirling et al. (2001) using VLBA and MERLIN data. Fender et al. (2001) estimated an angle of 30∘ between the jet axis and the line of sight, assuming the jet to be perpendicular to the disk. A more recent estimate for the angle of inclination of the orbital plane to our line of sight is (Orosz et al., 2011). A jet bulk Lorentz factor of , and a jet kinetic power have been determined in the hard state from the large scale optical emission of a nebula most likely energized by the Cyg X-1 jet (Gallo et al., 2005; Russell et al., 2007; see also Gleissner et al., 2004; Malzac et al. 2009; and the discussion in Zdziarski et al. 2012).
Cyg X-1 has been repeatedly observed in X-rays both in the hard and in soft states. Of particular interest are the INTEGRAL observations of Cyg X-1 that cover the energy range 20 – 1 (see the recent review and discussion by Zdziarski et al. (2012) who also reconsider the spectral data of Laurent et al., 2011). An important aspect of high-energy emission from Cyg X-1 is its variability. Variability in the X-ray band has been observed on several different timescales (Brocksopp et al., 1999; Pottschimidt et al., 2003; Ling et al., 1997; Golenetskii et al., 2003). Several outburst episodes in both the hard and soft states at various orbital phases were also reported by Golenetskii et al. (2003) using the Interplanetry Network in the 15–300 band and by Gierlinski & Zdziarski (2003) in the RXTE/PCA 3–30 data. Variability of the high-energy emission from Cyg X-1 is indeed a crucial issue. More recently very fast transient activity (on the order of hours) was also detected at the TeV energy range by the MAGIC telescope (Albert et al., 2007), and in the radio frequency by the MERLIN and Ryle telescopes (Fender et al., 2006).
For a black hole mass , both the total X-ray emission and jet kinetic power in the hard state indicate sub-Eddington accretion conditions. Data in the soft state of Cyg X-1 show that the X-ray luminosity can be similar or typically higher and a low-level jet activity can be present during this radio quenched state (Rushton et al. 2011; 2012; see also below and the Appendix, sec A.1). In general, we can distinguish two types of gamma-ray emission from a black hole system such as Cyg X-1: (1) ‘accretion-driven emission’, with X-rays and possibly gamma-rays originating from the inner accretion disk and/or Comptonizing corona; (2) ‘jet emission’ originating in the accelerating flow of the jet222Interaction of a non-thermal relativistic jet with the ambient photon fields from the accretion disk, the corona and the companion star wind contributing to the high energy band of the spectrum (hard X-rays -rays), can be modeled both in hadronic (Romero et al. 2003, Perucho & Boch-Ramon 2008) or leptonic scenarios (Perucho & Bosch-Ramon 2008; Piano et al., 2012; Zdziarski et al., 2012; Zdziarski, 2012).. The interpretation of the 1–10 emission and above plays a crucial role. This spectral component, detected both in the hard and in the soft states of Cyg X-1 (see below) can be attributed to hybrid Comptonization of accretion-driven emission or to a synchrotron tail of jet emission (e.g. Zdziarski et al., 2012). In this paper we focus especially on the gamma-ray emission of the Cyg X-1 soft state during which jet activity is in general subdued compared to the hard state (see e.g. Fender et al., 2004). We therefore aim here at constraining the possible existence of an accelerated population of electrons/positrons for the accretion-driven scenario.
Section 2 reviews the AGILE gamma-ray observations of Cyg X-1 in the hard state as well as during the recent prolonged (almost 1-year long) soft state period. We present in Section 3 the theoretical implications of our upper limits to the emission above 100 . Section 4 presents a general discussion of the accretion-driven high-energy emission from Cyg X-1. We find it useful to summarize all relevant previous gamma-ray observations and detections of Cyg X-1 above 1 in the Appendix. We also present there two transient episodes of gamma-ray emission from Cyg X-1, that at the moment constitute noticeable exceptions to the standard low-intensity gamma-ray state. In particular, we present data on a new relatively low-intensity/low-significance episode of emission that occurred just prior to a major X-ray and radio flaring transition on June 30 to July 2 2010.
2. AGILE observations and results
The AGILE gamma-ray astrophysics mission has been operating since 2007 April (Tavani et al., 2008). The AGILE scientific instrument is very compact and is characterized by two co-aligned imaging detectors operating in the energy ranges 30 – 30 (the imaging gamma-ray detector - GRID; Barbiellini et al., 2002; Prest et al., 2003; Bulgarelli et al., 2010) and 18–60 (the hard X-ray detector Super-AGILE; Feroci et al., 2007). An anticoincidence system (Perotti et al., 2006) and a calorimeter sensitive in the 0.4–100 energy range (Labanti et al., 2006) complete the instrument. AGILE’s performance is characterized by large fields of view (2.5 and 1 sr for the gamma-ray and hard X-ray bands, respectively), good sensitivity in pointing mode333AGILE operated in pointing mode during the first phase of operations (July 2007 – mid Oct 2009). Since January 2010 the satellite has been operating in ‘spinning’ mode, observing a large fraction of the sky continuously with somewhat reduced sensitivity per unit time but much increased overall sky coverage. near 100 (the on-axis effective area is about 400 cm2 at 100 ), and state-of-the-art angular resolution (68 containment radius PSF deg at 100 and PSF deg at 400 ).
Flux sensitivity for a typical 1-week observation in pointing mode can reach the level of above 100 depending on off-axis angles and pointing directions (see Tavani et al. (2008) for details about the mission and main instrument performance).
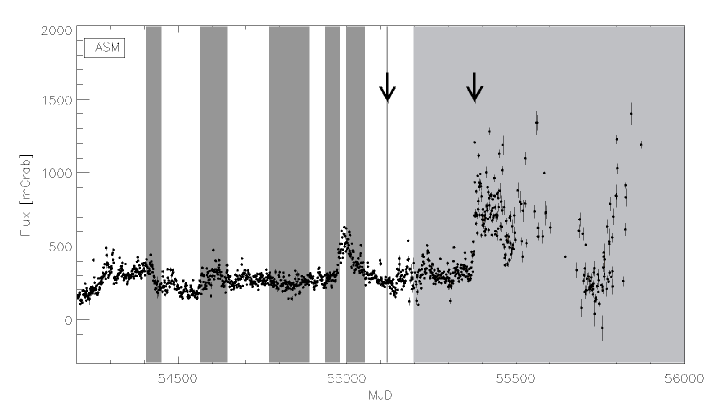
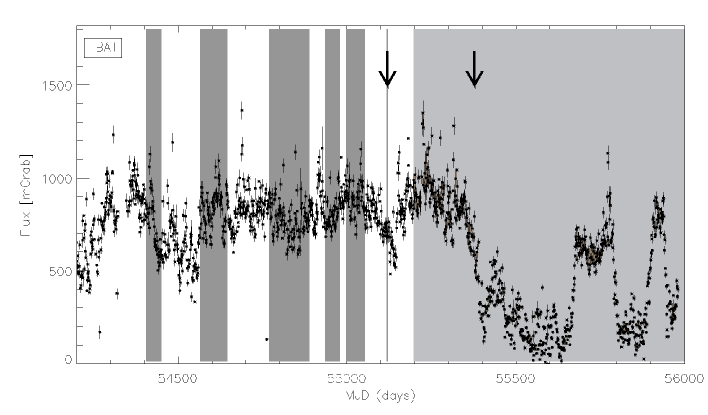
AGILE observed the Cygnus region in the Galactic plane several times during the period 2007 July – 2011 May (Sabatini et al., 2010a; Chen et al., 2011; Piano et al., 2012). Fig 1 shows the daily monitoring in the soft (ASM 1.3–12.2 ) and hard (Swift-BAT 15–50 ) X-ray range. AGILE observation intervals of the Cygnus region in pointing (dark gray) and spinning (light gray) mode are shown. The transition to (and persistence in) the soft state starting around MJD 55380 is evident. In the first paper (Sabatini et al., 2010) we analyzed our pointing mode data up to the end of 2009 (MJD 55120). Here we focus on the 2010 Jun – 2011 May period, during which Cyg X-1 was entirely in the soft state.
The analysis of the gamma-ray data presented in this paper was carried out with the standard AGILE-GRID FM3.119 filterI0010 B20 calibrated filter with a gamma-ray event selection that takes into account South Atlantic Anomaly event cuts and 80 degree Earth albedo filtering. Throughout the paper, statistical significance and source flux were determinated using the standard AGILE multi-source likelihood analysis software (Bulgarelli et al., 2012a). The statistical significance is expressed in terms of a Test Statistic (TS) (Mattox et al., 1996) and asymptotically distributed as a for 3 degrees of freedom (). We assessed the pre- and post-trial significance using multiple Monte Carlo simulations of the sensitivity of the gamma-ray instrument to point-like source emission (Bulgarelli et al., 2012).
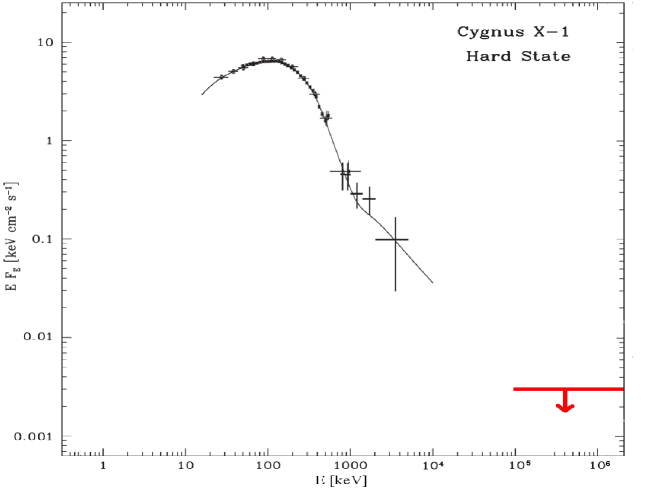
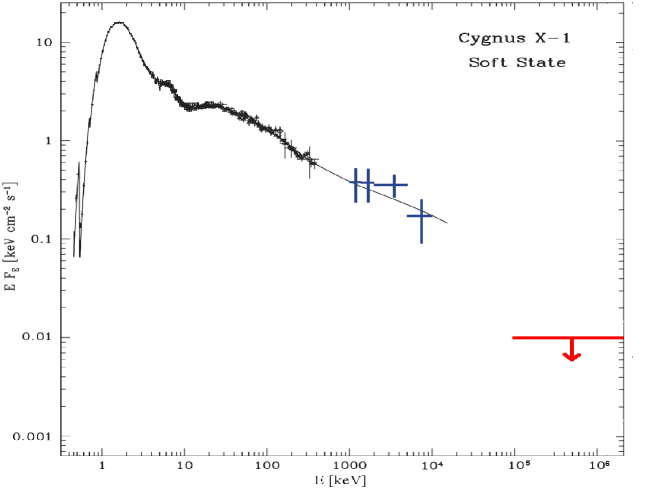
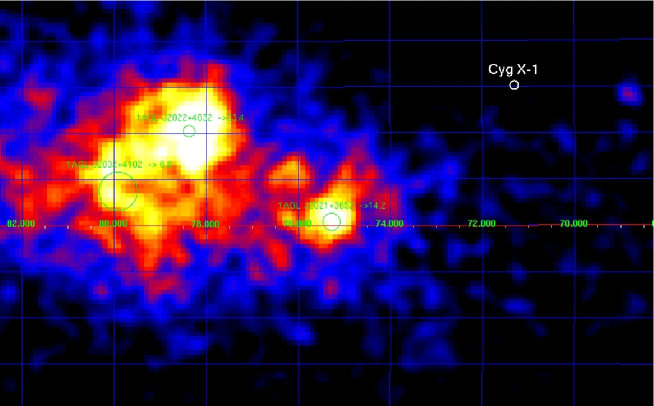
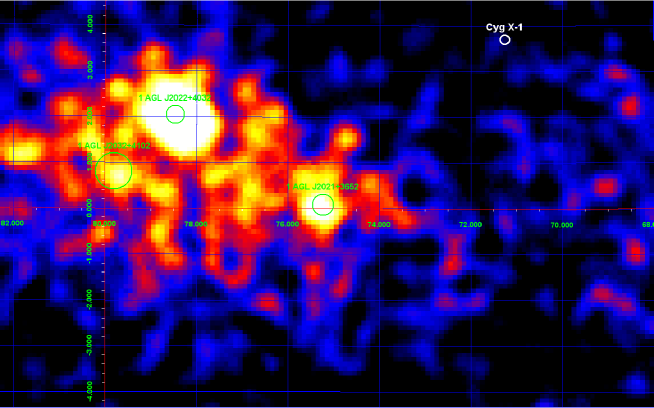
Fig. 2 shows the AGILE deep gamma-ray integrations of the Cygnus region above 100 during the periods 2007 July – 2010 Oct (MJD: 54406 – 55121) and 2010 June – 2011 May (MJD: 55378 – 55647), covering the hard and the soft spectral state respectively. No gamma-ray persistent emission from Cyg X-1 was detected by AGILE during either spectral states of the source for these deep integrations. A multi-source likelihood analysis, including all known gamma-ray sources of the region, provides a 2 upper limit for the energy 100 of for the hard state (Sabatini et al., 2010a) and for the soft state. Fig. 3 shows typical hard and soft spectral states from the literature (e.g., McConnell et al., 2002) together with the AGILE upper limits (plotted in red). For the soft state, we also plot in Fig. 3 (bottom panel) the soft gamma-ray emission detected on one occasion by COMPTEL (McConnell et al., 2002; see also the discussion in the Appendix).
The AGILE gamma-ray upper limit in the soft state is quite important, and excludes a simple power-law extrapolation of the soft gamma-ray emission detected by COMPTEL. Both measurements, obtained with AGILE data after many months of observations, confirm that Cyg X-1 is not a steady gamma-ray emitter above 100 at levels comparable to those detected from the other prominent micro-quasar Cygnus X-3 (Tavani et al., 2009; Abdo et al., 2009; Bulgarelli et al., 2012b; Corbel et al., 2012; Piano et al., 2012) . These findings have important theoretical implications that we discuss in the next section.
3. RXTE PCA/HEXTE data
Nineteen pointed observations were performed by RXTE PCA/HEXTE during the period 2010 June 19 – 2010 July 31, for a net exposure time of about 68.5 ks, catching the source across the whole transition from the hard to the soft state. The change of state can be described by a change in the Power Density Spectra (PDS) as shown in Fig. 9 in the Appendix and here we adopt Shaposhnikov & Titarchuk (2006) nomenclature for the classification of spectral states. The fractional RMS dropped to about 4% on 2010 July 4, which clearly shows that the source had finally reached the soft state. Fig.4 shows RXTE PCA/HEXTE data of the 4 and 22 of July, when the source was respectively in the soft and super-soft state , during the AGILE monitoring .
4. Results and Discussion
The lack of detectable gamma-ray flux above 100 from Cyg X-1 in the soft state leads to important theoretical constraints. Cyg X-1 has been considered as a crucial test case for the modeling of radiation mechanisms of accreting black holes in the literature (Coppi et al., 1999; Gierlinski et al., 1999; Zdziarski et al., 2012 and ref. therein). From the properties of the soft X-ray and hard X-ray emission and the well defined pattern of spectral state changes, Comptonization models have been successfully applied to describe the high-energy emission from Cyg X-1 (e.g., Coppi et al., 1999; Poutanen et al., 1998; Zdziarski et al. 2002, 2012). In this approach, different spectral states of the source are interpreted in relation to the interplay between the emission from an optically thick, cold accretion disc and a geometrically thin/optically thick corona above the disc. In the simplest versions of this model, the high energy emission of the soft state is expected to be steady and possibly to extend up to gamma-ray energies above 1 depending on the details of the thermal vs. non-thermal electron/positron component in the Comptonized corona. The disk contributes typically to the soft photon emission with a thermal distribution of temperature and luminosity . The corona is a much more complex and dynamical system where non-thermal particle acceleration, electron/positron pair formation and annihilation, optically thick Comptonization of thickness , and inverse Compton scattering occur. It is customary to define a ‘hard luminosity’ that takes into account the emission originating from these processes. Comptonization modeling using EQPAIR numerical code (Coppi 1999) treats self-consistently these processes, and can be used for the interpretation of Cyg X-1 observations. The system ‘compactness parameter’ defined as plays a crucial role, where is the luminosity of interest (‘soft’ or ‘hard’), is the Thomson cross section, is the typical radius of interest (either the inner disk and/or the corona) the electron’s mass, and the speed of light. Depending on the choice of or (and in principle of the corresponding emitting radius ) we can define the ‘soft’ () and ‘hard’ () compactness parameters. Constraining these values for the typical emission of Cyg X-1 is a long-standing theoretical problem.
TABLE 1
model-1
0.43
(10)
0.56
(0.99)
(2.7)
0.6
model-2
0.65
(10)
0.57
(0.99)
(2.7)
0.3
0.3
model-3
0.37
3.2
0.17
0.68
2.6
0.11
1.3
Comptonization Model Parameters (EQPAIR) for the soft spectral states shown in Fig.
4 and Fig. 9. Parameters among brakets are frozen in the fit;
free paramenter errors are given at the 90 confidence level.
: disc blackbody
temperature; : soft photon compactness; : ratio of hard-to-soft
compactness; : ratio of non-thermal-to-total hard compactness; :
injection index of electron power-law distribution;
: optical depth; : Compton reflection.
Model-1 refers to a fit to the RXTE PCA/HEXTE data of the soft state of the 4th of July 2010
(green solid line in Fig. 4) ;
model-2 is for the super-soft state of the 22nd of July 2010
(blu solid line in Fig. 4); model-3 reports McConnell et al.
(2002) parameters as a reference (black dashed line in Fig. 4).
The soft component of the spectrum is modeled by blackbody disc emission with related to the power supplied in the form of soft seed photons, while the hard tail is attributed to the corona, where photons from the disc repeatedly Compton scatter off electrons with a hybrid thermal/non-thermal distribution. Electron contributions are then parametrized by the compactness parameters for thermal () and non-thermal () electrons, and we can define a compactness parameter for the total power supplied to the electrons, . Typically, the corona non-thermal compactness has a comparable value in both hard and soft Cyg X-1 spectral states (; Malzac et al., 2010); on the contrary, most of the difference between the two spectral states is expected to be due to a change in the soft photon compactness, (Malzac et al., 2010).
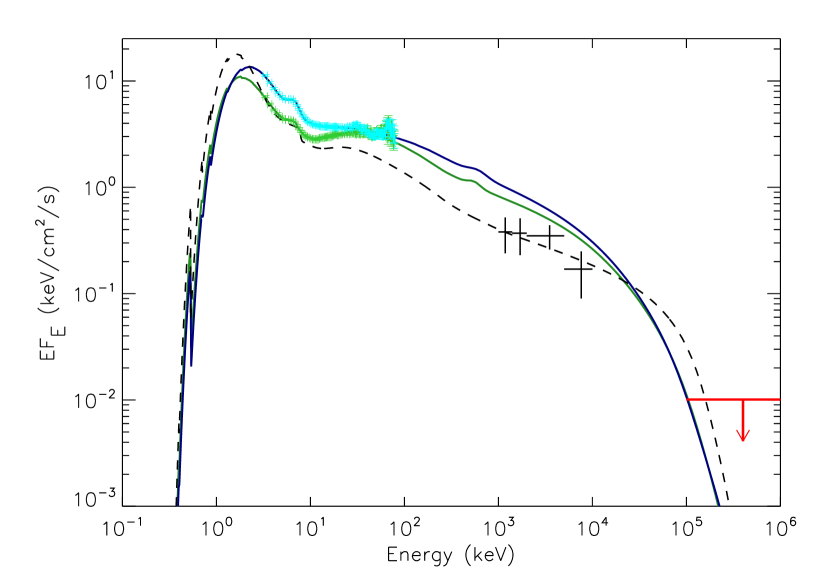
For our analysis of the soft state, we considered a class of hybrid Comptonization models, and fitted the available data with EQPAIR, exploring how the relevant physical parameters (most importantly, the soft compactness and the non-thermal to thermal compactness ratio ), affect the spectral energy distribution. Our first goal is to determine a model with ‘extreme’ parameters that lead to a high energy emission just consistent with our upper limit above 100 . In all fits a power-law distribution of accelerated/IC-cooled electron/positron pairs is assumed () with an injection index and minimum and maximum electron/positron Lorentz factors and fixed to the values of 1.3 and respectively, according to the well established literature (Gierlisnki et al., 1999; Frontera et al., 2001; Del Santo et al., 2013 and ref. therein). The non-thermal to total hard compactness ratio is set of order of unity in order to maximize the non-thermal component. We have explored varying values of in the range 1-10, letting , , and as free parameters. This analysis in general produces spectra incompatible with the whole set of data for , predicting a persistent high energy component incompatible with AGILE upper limit. Our constraints to the parameter space lead to a lower limit for the soft compactness, that is constrained to be in the range in order to be simultaneously consistent with both RXTE data and AGILE upper limit, given the adopted value for 444Note that for a value of the injection index of , higher values of would have negligible effects on the results, since only a small power is injected at this energy. The maximum allowed value of is however not completely consistent with AGILE upper limit, producing some power around 100 . . We therefore proceeded by freezing the soft inner disk component to in order to determine the parameters reported in table 1. We show in Fig. 4 the spectral energy distributions and in Tab. 1 the results of the fitting procedure for the two data sets. AGILE upper limit obtained during the soft state is in red. Superimposed to the models are the RXTE PCA/HEXTE data after the spectral transition (green-colored data are for the model-1 soft state of 4th of July, and cyan-colored data are for the model-2 super-soft state of July 22nd, 2010). We also show, for comparison, in black color, the historical COMPTEL gamma-ray data points for the Cyg X-1 soft state detection555Note that this detection constitutes a single (and so far unique) episode of emission above 1 , and that another observation by COMPTEL in the soft state during January 1994 did not detect any emission from Cyg X-1. during June 1996, and the model by McConnell et al. (2002) for these data with a black dashed line.
We notice that both ‘extreme’ models tend to predict higher gamma-ray fluxes in the range 1–30 than what measured in the historical COMPTEL detection. We notice however that a more realistic modelling would require more broad band data to better constrain the values for , and .
Our model-1 is in qualitative agreement with model parameters explored in Gierlinski et al. 1999 for the soft state. We add the crucial information of the non-existence of a strong non-thermal component of accelerated electrons/positrons with a power-law index harder than . The ratio of / is well constrained to values , as for typical soft states. From the constraints to the soft compactness we can therefore extrapolate a range of possible values for the hard compactness (and consequently the non-thermal and thermal compactness), obtaining .
5. Conclusions
The prolonged soft state of Cyg X-1 in mid-2010/mid-2011 offered an unprecedented opportunity to verify the existence of a prominent non-thermal tail in the gamma-ray spectrum of a black hole system in accretion above 10 (i.e. COMPTEL data). Our AGILE observations exclude the existence of such a tail. This result, combined with previous observations of Cyg X-1, confirms the physical picture of this state based on soft thermal X-ray emission emanating from the inner disk and partial reprocessing and scattering by a corona. It is interesting to note that whereas the ratio parameters / and are similar to previous Cyg X-1 soft states detected 1994 and 1996 (e.g., Gierlinski et al. 1999), we find a quite well constrained value for the compactness, related to feeding soft seed photon luminosity . We believe that our measurements, exploring and combining data in energy ranges much broader than in past analyses, constitute the most accurate constraints on the underlying physical processes thus far.
By considering both hard and soft state upper limits to the emission from Cyg X-1, we can put our measurements in perspective. Cyg X-1 spends most of its time in a sub-Eddington optically thick hard state. Occasionally, the accreting system dramatically changes its configuration to the soft state. The overall (mostly soft X-ray) luminosity increases by a factor up to 3 in magnitude (Zdziarski et al., 2002) getting closer to the Eddington luminosity. In this state, the coronal processes can be revealed more easily because of the optical thinness of the corona. We find that there are no major variations, on the average, of the conditions that lead to the energization of a non-thermal population of electrons/positrons compared to the hard state. The average emission properties of Cyg X-1 at energies above 1–10 appear to be quite stable.
We notice that this behavior of Cyg X-1 is in contrast with even the average properties of the other prominent Galactic micro-quasar Cygnus X-3 (Tavani et al., 2009; Abdo et al., 2009). In the case of Cygnus X-3, gamma-ray emission above 100 is clearly transient and originates in states with a relatively low hard X-ray flux. With the exception of two episodes of transient gamma-ray emission detected by AGILE from Cyg X-1 and reported in the Appendix, such an activity of recurrent and very active transient emission is not the norm in Cyg X-1.
Transient gamma-ray emission from Cyg X-1 originating from physical processes different from those of a ‘steady’ diskcorona can be difficult to detect. The very short (less than 2 hours) TeV emission detected by MAGIC from Cyg X-1, if confirmed, is quite remarkable. The current gamma-ray missions AGILE and Fermi can detect gamma-ray variability at the level of hours only for very intense events. In the Appendix, we report one of these candidate transient events from Cyg X-1 , which was detected by AGILE during the transition from hard to soft state on June 30th to July 2nd 2010. If confirmed, this class of transient gamma-ray emission would open a new window into the physical processes around accreting black holes, allowing the possibility of jet or ‘pre-jet’ launching activity of these transient events. Cyg X-1 transient gamma-ray activity could occur on short timescales (of order of the day or shorter) and with a typical gamma-ray flux of . Such events would be difficult to be detected by the current generation of gamma-ray telescopes (AGILE, Fermi). Future instruments with an improved exposure will allow us to investigate these issues in much more detail.
Acknowledgements
We thank the anonymous referee for his/her careful reading and for the important suggestions that considerably improved the quality of the manuscript. Research partially supported by the ASI grants nos. I/042/10/0 and I/028/12/0. MDS acknowledges financial support from the agreement ASI-INAF I/009/10/0 and from PRIN-INAF 2009 (PI: L. Sidoli).
References
- Abdo et al. (2009) Abdo A.A. et al., 2009, Science, 326, 1512
- Albert et al. (2007) Albert J. et al., 2007, ApJ, 665, L51
- Belloni et al. (1996) Belloni T., Mendez M., van der Klis M., Hasinger G., Lewin W.H.G. & van Paradijis J., 1996, ApJ, 472, L107
-
Bodaghee (2012)
Bodaghee A., 2012,
- Bulgarelli et al. (2010) Bulgarelli A. et al., 2010, Nucl. Instr. NIM A Meth. A, 614, 213
- Bulgarelli et al. (2012) Bulgarelli A., Chen A.W., Tavani M., Gianotti F., Trifoglio M. & Contessi T., 2012a, A&A, 540, 79
- Bulgarelli et al. (2012) Bulgarelli A., et al., 2012b, A&A, 538, 63
- Brocksopp et al. (1999) Brocksopp C., Fender R.P., Larionov V., Lyuty V.M., Tarasov A.E., Pooley G.G., Paciesas W.S. & Roche P., 1999, MNRAS, 309, 1063
- Cadolle Bel et al. (2006) Cadolle Bel M. et al., 2006, A&A, 446, 591
- Collmar et al. (2003) Collmar W., 2003, in X-Ray and Gamma-Ray Astrophysics of Galactic Source, 4th AGILE Science Workshop, ISBN 88-7999-811-0
- Chen A. et al. (2011) Chen A. et al., 2011, A&A, 525, 33
- Coppi P. (1999) Coppi P.S., 1999, ASPC, 161, 375
- Coppi P. (2006) Coppi P.S., 2006, AIPC, 714, 79
- Corbel S. et al. (2012) Corbel S. et al., 2012, MNRAS, 421, 2947
- Del Monte et al. (2010) Del Monte E. et al., 2010, A&A, 520, 67
- Del Santo et al. (2012) Del Santo M., Malzac J., Belmont R., Bouchet L. & De Cesare G., 2013, MNRAS in press, arXiv: 1212.2040
- Evangelista et al. (2010) Evangelista Y. et al., 2010, Astron. Telegram, 2724, 1
- Fender et al. (2000) Fender R.P., Pooley G.G., Durouchoux P., Tilanus R.P.J. & Brocksopp C., 2000, MNRAS, 312, 853
- Fender et al. (2001) Fender R.P., 2001, MNRAS, 322, 31
- Fender et al. (2004) Fender R.P., Belloni T.M. & Gallo E., 2004, MNRAS, 355, 1105
- Fender et al., (2006) Fender R.P., Stirling A.M., Spencer R.E., Brown I., Pooley G.G., Muxlow T.W.B., Miller-Jones J.C.A., 2006, MNRAS, 369, 603
- Feroci et al. (2007) Feroci M., et al., 2007, Nucl. Instr. NIM A Meth. A, 581, 728
- Frontera et al. (2001) Frontera F., Palazzi E., Zdziarski A. A., Haardt F., Perola G. C., Chiappetti L., Cusumano G., Dal Fiume D. et al., 2001, ApJ, 546, 1027
- Gallo et al. (2003) Gallo E., Fender R.P. & Pooley G.G., 2003, MNRAS, 344, 60
- Gallo et al. (2005) Gallo E., Fender R.P., Kaiser C., Russell D., Morganti R., Oosterloo T. & Heinz S., 2005, Nature, 436, 819
- Gies & Bolton (1986) Gies D.R. & Bolton C.T., 1986, ApJ, 304, 371
- Gierlinski et al. (1997) Gierlinski M., Zdziarski A.A., Done C., Johnson W.N., Ebisawa K., Ueda Y., Haardt F. & Phlips B.F., 1997, MNRAS, 288, 958
- Gierlinski et al. (1999) Gierlinski M., Zdziarski A.A., Poutanen J., Coppi P.S., Ebisawa K. & Johnson W.N., 1999, MNRAS, 309, 496
- Gierlinski & Zdziarski (2003) Gierlinski M. & Zdziarski A.A., 2003, MNRAS,343, 84
- Gleissner et al. (2004) Gleissner T., Wilms J., Pooley G.G., Nowak M.A., Pottschmidt K., Markoff S., Heinz S., Klein-Wolt M., Fender R.P. & Staubert R., 2004, A&A, 425, 1061
- Golenetskii et al. (2003) Golenetskii S., Aptekar R., Frederiks D., Mazets E., Palshin V., Hurley K., Cline T. & Stern B., 2003, ApJ, 596, 1113
- Grinberg et al. (2011) Grinberg V. et al., 2011, Astron. Telegram, 3307, 1
- Hartman et al. (1999) Hartman R.C. et al., 1999, ApJS, 123, 79
- Jourdain et al. (2012) Jourdain E., Roques J.P., Malzac J., 2012, ApJ, 744, 64
- Labanti et al. (2006) Labanti C., Marisaldi M., Fuschino F., Galli M., Argan A., Bulgarelli A., Costa E., Di Cocco G., Gianotti F., Tavani M. & Trifoglio M., 2006, proc SPIE, 6266, 110
- Ling et al. (1997) Ling J.C., Wheaton W.A., Wallyn P., Mahoney W.A., Paciesas W.S., Harmon B.A., Fishman G.J., Zhang S.N. & Hua X.M., 1997, ApJ, 484, 375
- Malzac et al., (2008) Malzac J., Lubinski P., Zdziarski A.A., Cadolle Bel M., Türler M. & Laurent P., 2008, A&A, 492, 527
- Malzac et al. (2009) Malzac J., Belmont R. & Fabian A.C., 2009, MNRAS, 400, 1512
- Malzac et al. (2010) Malzac J. & Renaud B., 2010, International Journal of Modern Physics D, 19, 369
- McConnell et al. (1997) McConnell M.L. et al., 1997, AIPC, 410, 829
- McConnell et al. (2000) McConnell M.L. et al., 2000, ApJ, 543, 928
- McConnell et al. (2002) McConnell M.L. et al., 2002, ApJ, 572, 984
- Mirabel et al. (1996) Mirabel I.F., Claret A., Cesarsky C.J., Boulade O., Cesarsky D.A., 1996, A&A, 315, L113
- Negoro et al., (2010) Negoro H. et al., 2010, Astron. Telegram, 2711, 1
- Nowak et al., (2011) Nowak M.A., Wilms J., Pottschmidt K., Markoff S., 2011, Mem S.A.It., arXiv 1107:2391v1
- Orosz et al., (2011) Orosz J.A. McClintock J.E., Aufdenberg J.P., Remillard R.A., Reid M.J.; Narayan R.; Gou L., 2011, ApJ 742, 84
- Pandey et al., (2006) Pandey M., Rao A.P., Pooley G.G., Durouchoux P., Manchanda R.K., Ishwara-Chandra C.H., 2006, A&A 447, 525
- Pittori et al. (2009) Pittori C., et al., 2009, A&A 506, 1563
- Perotti et al. (2006) Perrotti F., Fiorini M., Incorvaia S., Mattaini E., Sant’Ambrogio E, 2006, Nucl. Instr. NIM A Meth. A, 556, 228
- Perucho & Bosch-Ramon et al., (2008) Perucho M. & Bosch-Ramon V. et al., 2008, A&A, 482, 917
- Phlips et al., (1996) Phlips B. et al., 1996, 1996, 465, 907
- Piano et al., (2012) Piano G. et al., 2012, A&A, 545, 110
- Pottschmidt et al., (2003) Pottschmidt K., Wilms J., Nowak M.A., Pooley G.G., Gleissner T., Heindl W.A., Smith D.M., Remillard R., Staubert R., 2003, A&A, 407, 1039
- Pooley et al., (1999) Pooley G.G., Fender R.P. & Brocksopp C. 1999, MNRAS, 302, L1
- Poutanen et al., (1998) Poutanen J. & Coppi P.S., 1998, Physica Scipta, T77, 57
- Rahoui et al., (2011) Rahoui F., Lee J.C., Heinz S., Hines D.C., Pottschmidt K., Wilms J., Grinberg V., 2011, ApJ, 763, 63
- Romero et al., (2003) Romero G.E., Torres, D. F., Kaufman Bernadó M. M., Mirabel I. F., 2003, A&A, 410, L1
- (58) Rushton A. et al., 2010a, Astron. Telegram, 2714, 1
- (59) Rushton A. et al., 2010b, Astron. Telegram, 2734, 1
- Rushton et al., (2011) Rushton A. et al., 2011, PoS, arXiv:1101.3322v1
- Rushton et al., (2012) Rushton A. et al., 2012, MNRAS, 419, 3194
- Russell et al., (2007) Russell D.M., Fender R.P., Gallo E., Kaiser C., 2007, MNRAS, 376, 1341
- (63) Sabatini S. et al., 2010a, ApJ, 712, 10
- (64) Sabatini S. et al., 2010b, Astron. Telegram, 2715, 1
- Shaposhnikov & Titarchuk, (2006) Shaposhnikov N. & Titarchuk L., 2006, ApJ, 643, 1098
- Shaposhnikov & Titarchuk, (2007) Shaposhnikov N. & Titarchuk L., 2007, ApJ, 663, 445
- Stirling et al., (2001) Stirling A.M., Spencer R.E., de la Force C.J., Garrett M.A., Fender R.P., Ogley R.N., 2001, MNRAS, 327, 1273
- Tavani et al. (2008) Tavani M. et al. 2008, A&A, 502, 995
- Tavani et al., (2009) Tavani M. et al. 2009, Nature, 462, 620
- Tudose et al., (2010) Tudose V. et al., 2010, Astron. Telegram, 2755, 1
- Wilson-Hodge et al. (2010) Wilson-Hodge C. et al., 2010, Astron. Telegram, 2721, 1
- Zdziarski et al., (2002) Zdziarski A.A., Poutanen J., Paciesas W.S., Wen L., 2002, ApJ, 578, 357
- Zdziarski et al., (2004) Zdziarski A.A. & Gierlinski M., 2004, Prog. Theor. Phys. Suppl., 155, 99
- Zdziarski et al., (2011) Zdziarski A.A, Skinner G.K., Pooley G.G., Lubinski P., 2011, MNRAS, 416, 1324
- Zdziarski, (2012) Zdziarski A.A., Lubinski P., Sikora M., 2012, MNRAS, 423, 663
- Zdziarski et al., (2012) Zdziarski A.A., 2012, MNRAS, 422, 1750
- Zhang et al., (1997) Zhang S.N., Cui W., Harmon B.A., Paciesas W.S., Remillard R.E., van Paradijs J., 1997a, ApJ 477, L95
- Zhang et al., (1997) Zhang S.N., Mirabel I.F., Harmon B.A., Kroeger R.A., Rodriguez L.F., Hjellming R.M. & Rupen M.P., 1997b, AIP Conf. Proceedings, 410, 141
Appendix A A review of gamma-ray observations of Cygnus X-1 above 1
We summarize in this Appendix all relevant observations and possible detections of Cyg X-1 above 1 . We briefly describe the (so far) unique high-significance COMPTEL detection of Cyg X-1 up to 5–10 in June 1996. A short (less than 2 hours) episode of emission at TeV energies was detected by MAGIC in 2007. Finally, we discuss the gamma-ray event above 100 detected by AGILE in pointing mode in October 2009 (Sabatini et al., 2012a), and focus on a new possible event detected by AGILE in spinning mode in early July 2010 in coincidence with a dramatic spectral change from hard to soft states.
A.1. Gamma-ray observations of Cygnus X-1 in the Soft State in 1994 and 1996: COMPTEL data.
Observations of Cyg X-1 during the soft state in the gamma-rays are scarce in the literature, also due to its intrinsic behavior: the source spent 90 out of its time in the hard state during the last years. During the operational period of the Compton Gamma-Ray Observatory, CGRO (1991-2000) the instruments onboard (BATSE, OSSE, COMPTEL, EGRET) observed several times the Cygnus region. Cyg X-1 was in a clear soft state in only two occasions: in January 1994 and in May 1996. In both cases, CGRO pointed at the source with a ToO following the announcement of the hard-to-soft state transition. For the 1994 event (VP 318.1) all four CGRO instruments collected data, while for the 1996 one (VP 522.5) EGRET was switched off. Fig. 5 shows the BATSE long term lightcurve for the 1994 soft state and the CGRO ToO time period (marked by vertical dashed lines). No simultaneous soft X-ray monitoring was available at that time. COMPTEL did not detect any emission from Cyg X-1 for this period, and the upper limit was consistent with the power law measured by both BATSE (Ling et al., 1997) and OSSE (Phlips et al., 1996).


Another interesting soft state episode occurred in June-July 1996. Fig. 6 shows the BATSE and simultaneous ASM long-term data around the 1996 Cyg X-1 soft state; the CGRO ToO viewing period is marked with vertical dashed lines. This observation, with a more favourable angle in the Field of View, resulted in the first gamma-ray detection above of Cyg X-1. The hard X-ray spectral index was similar to that of the 1994 event (). The overall intensity was also measured by OSSE to be higher than before of about a factor 2 (McConnell et al., 2002). This particular episode has been considered the ’canonical’ soft spectral state for a long time. The expectation from the model is that part of the emission should also appear at energies , while AGILE shows that no emission is detected in this energy range, with an upper limit of 0.01 (see Fig. 4).
A.2. Transient gamma-ray episode of Cyg X-1 in the hard state: MAGIC observations
The Cyg X-1 hard state is described by a power law of typical spectral index 1.7 in the hard X-ray range, and a sharp energy cut-off around 150 . Therefore, significant gamma-ray emission is not expected in this spectral state. Until recently the higher energy data available in the literature were those of COMPTEL (McConnell et al., 2000; McConnell et al., 2002), in agreement with this picture. EGRET provided only an upper limit for the source in the hard state (Hartman et al., 1999).
MAGIC reported for the first time an episode of transient TeV emission from Cyg X-1 in 2007 (Albert et al., 2007). The spectral state during this observation was a typical hard state spectrum and no unusual feature in the X-ray light curve and spectrum was noted. Quasi-simultaneous observations were carried out by INTEGRAL: the TeV detection coincides with the peak of a small X-ray flare just after a very fast rise in hard X-ray flux, but no obvious correlation between the X-ray and TeV emission was found (Malzac et al., 2008).
A.3. Transient gamma-ray episode of Cygnus X-1 in the hard state: AGILE observations
As reported in Sabatini et al 2010a, also AGILE detected above 100 a fast (day) transient event from Cyg X-1 in October 2009 during a hard state period. Although not simultaneous with the MAGIC event, the AGILE detection of a gamma-ray flare during a hard state, of the duration of the day or shorter, further suggests that additional non-thermal components may appear also in states previously believed to be characterized by a cut-off above a few . The AGILE map of the October 2009 gamma-ray event is shown in Fig 7. Here we also shows the multi-wavelength ( AMI-LA, MAXI and Swift-BAT) daily monitoring of Cyg X-1 during the gamma-ray flare detected by AGILE: as for the MAGIC flare, there is no evidence of detectable spectral changes or unusual features on the day timescale. It is however interesting to point out that a blind search analysis carried out in about 4 years of Fermi data shows that some low significance activity is present in the gamma-ray data above 100 during the periods of this gamma-ray flare (and the one discussed in sec. A.4.1) reported by the AGILE Team for Cyg X-1. The analysis was supported by a statistical treatment of spurious detections and other periods of gamma-ray activity outside this ones and the one in sec A.4.1 reported by AGILE are probably spurious (Bodaghee, private communication; see also Bodaghee, 2012).

A.4. The hard-to-soft state transition of June-July 2010: RXTE PCA data and AGILE observations
After having spent a long period from 2006 to mid 2010 in an extraordinary hard state (Nowak et al., 2011), on the 28th of June 2010 Cyg X-1 entered in a transitional state, passing from the hard to the soft state. A gradual spectral softening of the black hole during the period 10th of June - 1st of July 2010 was announced by MAXI/GSC (Negoro et al., 2010) and the subsequent soft X-ray increasing emission was also reported by RXTE/ASM (Rushton et al., 2010a), confirming the transition of the source from the hard to the soft spectral state. The rapid fall in hard X-rays around June 29 - July 01 2010 was also reported by Fermi-GBM (Wilson-Hodge et al., 2010). A multi-wavelength campaign was triggered by the transition episode, providing a wealth of data from gamma-rays to radio (MAXI, Negoro et al., 2010; RXTE/ASM, Rushton et al., 2010a; AGILE, Sabatini et al. 2010b; Fermi-GBM, Wilson-Hodge et al., 2010; SWIFT, Evangelista et al., 2010; MERLIN, Rushton et al., 2010b; WRST, Tudose et al., 2010). All observations showed the source to be in a intermediate-soft state (Belloni et al, 1996). The source was detected to be in the soft state on the 11th of July 2010 (Rushton et al., 2010b), and remained in this state until the end of April 2011 (Grinberg et al., 2011). Fig. 8 shows a multi-wavelength long-term monitoring of the 2010-2011 soft state in the hard X-rays (BAT 15-50 ), soft X-rays (MAXI 2-4 ) and radio (AMI-LA 15 ). The vertical dotted-dashed lines show the duration of a candidate episode of enhanced gamma-ray emission detected by AGILE during the remarkable hard-to-soft transition of July 2010.
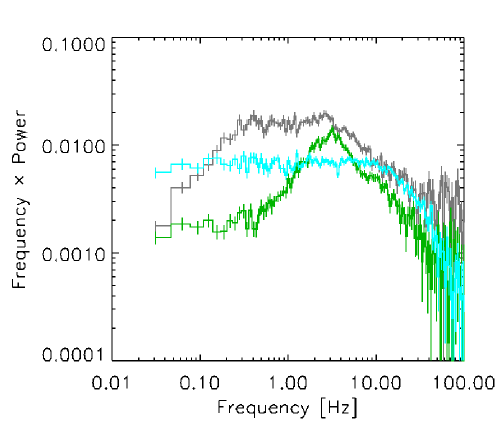
As reported in the main text, nineteen pointed observations were performed by RXTE-PCA during the period 2010 June 19 - 2010 July 31, for a net exposure time of about 68.5 ks, catching the source across the whole transition from the hard to the soft state. The observations were carried out in the binned data mode (B-2ms-8B-0-35-Q), with 1.95 ms bin size in the energy band 2.1-14.8 . In Fig. 9 we plotted the X-ray power spectrum (normalized to units of fractional squared RMS) of the RXTE-PCA observation 95121-01-13-00 (2461 s net exposure) carried out on 2010-06-19 with T UT (black line), for the observation 95121-01-14-00 (1730 s net exposure) performed on 2010-07-04 with T UT (red line) and for the observation 95121-01-13-00 of the 2010-07-22 with T UT. The RXTE-PCA data clearly show a variation in the noise components of the power spectra (PDS), with a decrease in the RMS variability during the state change. The fractional RMS was 8% on the 19 of June 2010, with a power spectrum showing band-limited noise between 0.3 and 10 (Fig. 9, grey line) consistent with an intermediate state (see, e.g., Shaposhnikov & Titarchuk, 2006). The fractional RMS then dropped to about 4% on 2010 July 4, with a narrower noise component in the PSD which peaks at 3 (Fig9, left panel, green line), thus showing that the source had finally reached the soft state. We also plot in cyan the PDS of the 22nd of July, clearly showing a super-soft state, as an example of the intrinsic variability present in the soft state period monitored by AGILE. Although not simultaneous with the AGILE candidate flaring event (see next section), these observations are of particular interest to the gamma-ray data because they are few days before and just after the gamma-ray possible detection, suggesting the coupling of transitional states with gamma-ray emission.

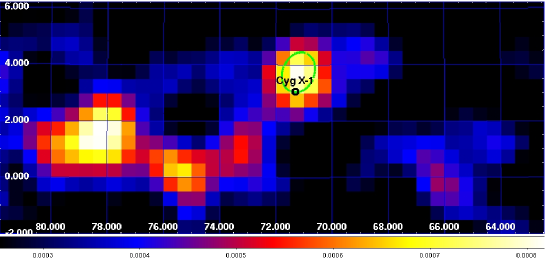
A.4.1 An AGILE possible detection of Cygnus X-1 at the hard-to-soft transition in July 2010
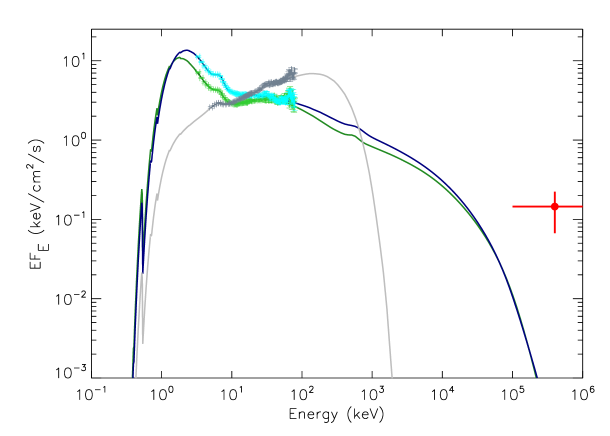
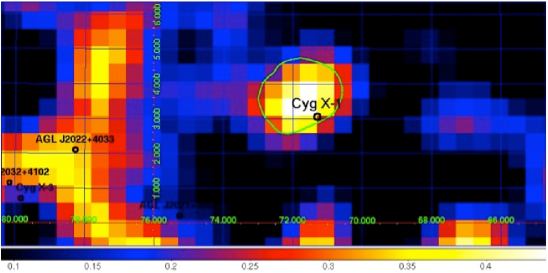

We carried out an automatic search for transient gamma-ray emission in AGILE data during the whole 2010–2011 period, and found evidence of gamma-ray activity during the 2010 hard-to-soft spectral transition. Based on previous claims of gamma-ray detections of Cyg X-1 on short timescales by MAGIC (Albert et al., 2007) and AGILE (Sabatini et al., 2010a), we searched for events occurring on short time scale (2-days). A relatively weak, i.e. low statistical significance, but interesting gamma-ray enhancement occurs exactly at the hard-to-soft transition at the end of June 2010. Integrating from 2010-06-30 10:00 UT to 2010-07-02 10:00 UT, the maximum likelihood analysis yields a flux excess above 100 of with a 3 statistical significance. Fig. 10 shows the AGILE gamma-ray intensity map of the Cygnus region above 100 for this period. Although not simultaneous, we think it is interesting to show in Fig. 9 the AGILE data point for the candidate flare with the extreme models (model-1 and model-2) discussed in the main text. For comparison, we also show in grey the RXTE PCA/HEXTE data for the ToO observation of the 19th of June 2010, i.e. 10 days before the AGILE candidate flare, when Cyg X-1 was in a hard/intermediate state (we plot a representative model with for this case).
Although the statistical significance of the gamma-ray enhancement detected by AGILE is low (because of the poor statistics obtainable for short events by AGILE in spinning mode), it is interesting to discuss this candidate event in a multi-wavelength perspective. Fig. 8 shows a long-term monitoring in hard X-rays (Swift-BAT, upper panel), soft X-rays (MAXI in the 2–4 band, middle panel ) and radio (AMI-LA 15 band, lower panel); the dashed lines show the AGILE detection. Interestingly, the gamma-ray flare happens to be simultaneous with the definitive transition to the soft state, and anticipates by about 2 days an ‘anomalous’ intense radio flare detected well in the soft state (Rushton et al., 2012), occurring therefore when shocks are possibly predicted to be formed within the jet (Fender et al., 2004). As already mentioned in sec. A.3, a blind search analysis supported by a statistical treatment of spurious detections shows that some low significance activity is present also in the Fermi gamma-ray data during the period of this gamma-ray flare (Bodaghee, private communication; see also Bodaghee, 2012).
Fig. 11 shows the detailed transition as detected in the hard X-rays (BAT), 2–4 X-rays (MAXI), and radio (AMI-LA). The time period of enhanced gamma-ray emission above 100 possibly detected by AGILE is marked by vertical dashed lines.
We also searched for gamma-ray activity from Cyg X-1 in coincidence with other interesting spectral transitions as shown in Fig. 8. However there is no evidence of enhanced emission in the data ( for 2-days integration). Fig. 12 shows the detail of the other recent hard-to-soft transition which occurred in January 2011 and led to another prolonged soft state ( MJD: 55800 – 55890). We note that in this case the hard-to-soft transition occurs on a timescale of several days, i.e., much longer than the sharp transition recorded in July 2010 in coincidence with the AGILE candidate event.
