Cell-type-specific microarray data and the Allen atlas: quantitative analysis of brain-wide patterns of correlation and density
Abstract
The Allen Atlas of the adult mouse brain is used to estimate the region-specificity of 64 cell types whose transcriptional profile in the mouse brain has been measured in microarray experiments. We systematically analyze the preliminary results presented in [arXiv:1111.6217], using the techniques implemented in the Brain Gene Expression Analysis toolbox. In particular, for each cell-type-specific sample in the study, we compute a brain-wide correlation profile to the Allen Atlas, and estimate a brain-wide density profile by solving a quadratic optimization problem at each voxel in the mouse brain. We characterize the neuroanatomical properties of the correlation and density profiles by ranking the regions of the left hemisphere delineated in the Allen Reference Atlas. We compare these rankings to prior biological knowledge of the brain region from which the cell-type-specific sample was extracted.
1 Introduction and background
Neuroanatomy is experiencing a renaissance thanks to molecular biology and computational imaging [1]. The Allen Brain Atlas (ABA), the first Web-based, genome-wide atlas of gene expression in the adult mouse brain (eight-week old C57BL/6J male mouse brain), was obtained using an unified automated experimental pipeline [2, 3, 4, 5, 6, 7, 8]. The resulting data set consists of in situ hybridization (ISH) digitized image series for thousands of genes. These image series are co-registered to the Allen Reference Atlas (ARA) [9], which allows to compare ISH data to classical neuroanatomy.
The gene expression data were aggregated into a volumetric grid: The reference mouse brain is partitioned into cubic voxels of side 200 microns. For a voxel , the expression energy of the gene labeled is defined [10] as a weighted sum of the greyscale-value intensities of pixels intersecting the voxel:
| (1) |
where is the intensity image and is a Boolean mask,
worked out in the image-processing pipeline,
with value 1 if the pixel is expressing the gene of interest.
The ABA has led to the development of software for data exploration
and analysis such as the Web-based Neuroblast [11] and
Anatomic Gene Expression Atlas (AGEA) [10]. NeuroBlast
allows users to explore the correlation structure between genes, while the AGEA
is based on spatial correlation between voxels.
More recently, we developed the Brain Gene Expression Analysis (BGEA)
MATLAB toolbox [12, 13], which
allows to manipulate the gene-expression energies of the
brain-wide ABA on the desktop as matrices [14, 15]. In particular,
data corresponding to different ISH experiments (i.e. different genes)
can be combined for computational analysis, and used to study
other data sets.
A complementary (cell-based) approach to the study of gene-expression
energy in the brain uses microarray
experiments to study co-expression patterns in a small set of brain
cells of the same type. We studied cell-type-specific microarray gathered from
different studies
[16, 17, 18, 19, 20, 21, 22, 23],
already analyzed in [24], for cell
types111The studies differ in the way cells are
visually-identified are separated from their environments. The
methods are laser-capture microdissection (LCM)
[20, 17], translating ribosome affinity
purification (TRAP) [19, 22],
fluorescence-activated cell-sorting (FACS) [21],
immuno panning (PAN) [18], and manual sorting
[16, 23]. See Tables
62 and 63 for references to
the study from which each of the cell-type-specific samples was drawn..
Each of these cell types is characterized by
the expression of genes.
The region specificity of the transcriptional profiles of cell types is an open problem (preliminary results were presented in [25], without a systematic anatomical analysis). Given a cell type extracted from a given brain region, it is hard to know where else in the brain cells with a similar transcriptional profile can be found. We computed brain-wide correlation profiles between each of the cell-type-specific samples and the Allen Atlas. Moreover, we propose a linear model decomposing the gene-expression energy of the collection of all genes in the Allen Atlas over the set of cell-type-specific data. The model provides an estimate of the brain-wide density of the cell types. For each cell type, brain regions are then ranked according to the average value of correlation, and to their contribution to the total density of the cell type.
2 Methods
We determined the set of genes that are represented in both data sets (there are such genes). We extracted the columns of the matrices and corresponding to these genes, and rearranged them to reflect the same order in each data set. is assumed to be a voxel-by-gene matrix denoted by (with rows and columns), and type-by-gene matrix denoted by (with rows and columns). The columns of both matrices corresponding to the same set of genes, ordered in the same way:
| (2) |
| (3) |
The computational analysis of these two data sets
was undertaken using the Brain Gene Expression Atlas MATLAB toolbox (BGEA)
we developed in MATLAB [13].
The present analysis is focused on 4,104 genes for which experiments
conducted using both sagittal and coronal sections were available at
the time of analysis. To minimize reproducibility issues, we computed
the correlation coefficients between sagittal and coronal data volumes
(see [14] for a plot of values) and selected the
genes in the top-three quartiles of correlation (3,041 genes) for
further analysis.
2.1 Correlations between cell-type-specific microarray data and the Allen Atlas
For a fixed cell type labeled , the -th row of the type-by-gene matrix defined in equation 3 corresponds to a vector in a -dimensional gene space. On the other hand, for a fixed voxel labeled in the mouse brain, the -th row of the the voxel-by-gene matrix defined in equation 2 gives rise to another vector in the same gene space. We computed the correlation between voxel labeled and cell type labeled :
| (4) |
| (5) |
| (6) |
For a cell type labeled , the correlation values defined across all voxels in the ABA, as defined in Equations 4, 5 and 6 give rise to a brain-wide correlation profile between this cell type and the Allen Atlas, with all genes taken into account, since the genes are summed over in Equation 4. The correlation at each voxel reflects a measure of similarity between the expression profile of the cell type and the gene expression profile defined within a local cube of side 200 microns in the ABA. See Tables 40–50 for maximum-intensity projection images and images of individual sections of these volumetric profiles for each of the cell types in this study. The next section contains an analysis of the brain-wide correlation profiles, based on the average correlation across brain regions defined by the ARA.
2.2 A linear model relating cell-type-specific microarray data to the Allen Atlas
The above-defined analysis of correlations between the ABA and cell-type-specific
data is not a decomposition of the signal into
cell-type-specific components. In this section, we propose a linear model
to attempt such a decomposition, using the cell-type-specific samples
as a base of gene space.
Let us denote by the vector in gene space
obtained by taking the -th
row of the type-by-gene matrix defined in equation 3:
| (7) |
To decompose the gene expression at a voxel of the mouse brain into its cell-type-specific components, let us introduce the positive quantity denoting the contribution of cell-type at voxel , and propose the following linear model:
| (8) |
Both sides are estimators of the amount of mRNA for gene at voxel
. The residual term in Equation 8 reflects the
fact that cell types are not sufficient to sample the whole
diversity of cell types in the mouse brain, as well as noise in the
measurements, reproducibility issues, and non-linearities in the
relations between numbers of mRNAs, expression energies and microarray
data [26].
To find the parameters that provide the best fit of the model 8, we have to minimize the residual term by solving the following problem:
| (9) |
where
| (10) |
The right-hand side of Equation 10 is a sum of positive quadratic functions of , one per voxel . The minimization problem 9 can therefore be solved voxel by voxel. For each voxel we have to minimize a quadratic function of a vector with positive components:
| (11) |
We solved these quadratic optimization problems (one per voxel),
using the CVX toolbox for convex optimization [27, 28].
For each cell type , the coefficients yield an estimated brain-wide density profile for this cell
type. See Tables 51–61 for
maximum-intensity projection images and individual image sections of
these density profiles for all the cell types in this study. The next
section contains an analysis of results related to the anatomical
brain regions defined by the ARA.
3 Results
3.1 Rankings of brain regions induced by correlation and density profiles
To analyze the neuroanatomical properties of the results, we made use of two non-hierarchical systems of annotation, available for the left hemisphere at a resolution of 200 microns. We will refer to them as:
-
•
the ’big12’ annotation, consisting of 12 regions of the left hemisphere (together with a more patchy group of voxels termed ’basic cell groups of regions’) whose names, sizes and shapes are shown in Table 1.
-
•
the ’fine’annotation, a refinement of ’big12’ into 94 regions, reflecting structures further down the ARA hierarchy.
| Brain region | Symbol | Percentage of hemisphere | Profile of region (maximal-intensity projection) |
|---|---|---|---|
| Basic cell groups and regions | Brain | 4.6 |
|
| Cerebral cortex | CTX | 29.5 |
|
| Olfactory areas | OLF | 9.2 |
|
| Hippocampal region | HIP | 4.3 |
|
| Retrohippocampal region | RHP | 4 |
|
| Striatum | STR | 8.6 |
|
| Pallidum | PAL | 1.9 |
|
| Thalamus | TH | 4.3 |
|
| Hypothalamus | HY | 3.5 |
|
| Midbrain | MB | 7.8 |
|
| Pons | P | 4.6 |
|
| Medulla | MY | 6.2 |
|
| Cerebellum | CB | 11.5 |
|
For each cell-type-specific sample in this study, anatomical
metadata specify the brain region from which the sample was extracted
(see Tables 64 and
65). For
each brain-wide quantity computed (i.e., correlation and density
profiles, defined in Equations 4 and 8), we
can determine how these quantities vary across brain
regions. Specifically, these profiles can be used to produce
rankings of brain regions in the Allen Reference Atlas.
We have to choose a non-hierarchical partition of the brain according to
the ARA, with regions, available in a digitized form,
co-registered with the voxel-based gene-expression energies (for
definiteness and ease of presentation we consider the ’big12’ annotation of the ARA, Table 1). Let
denote the set of voxels belonging to region labeled in this
partition.
3.1.1 Ranking brain regions by correlation profile
For a cell type labeled , we can compute the average correlation with the Allen Atlas in each region (labeled ) of the ARA:
| (12) |
For each cell type, the brain regions in the ARA can be ranked by
decreasing values of the average correlation
defined in Equation
12. The region with highest average correlation is
called the top region by correlation for the cell type
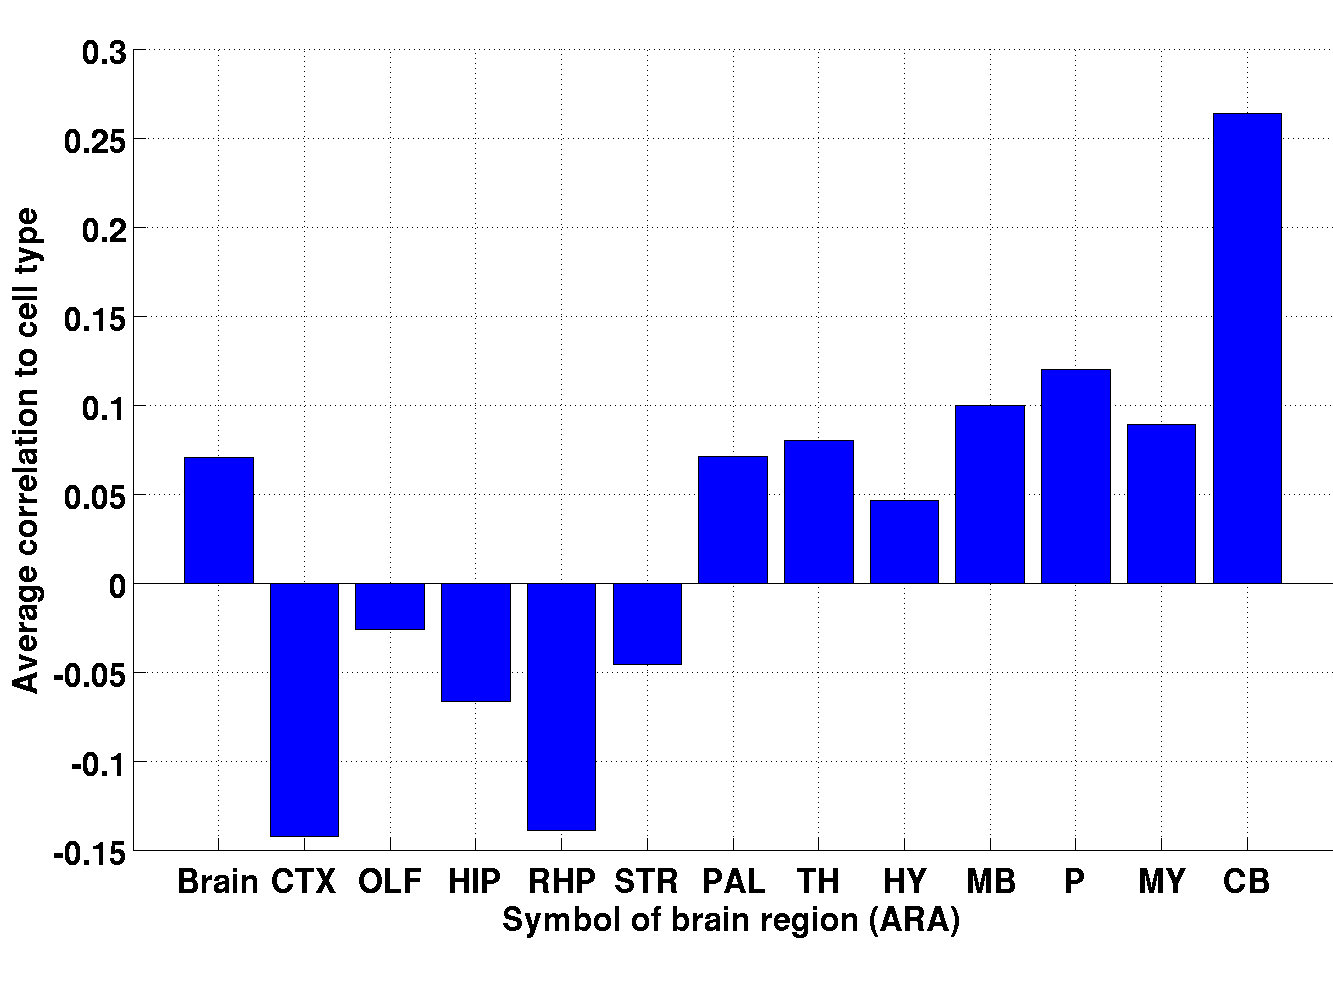
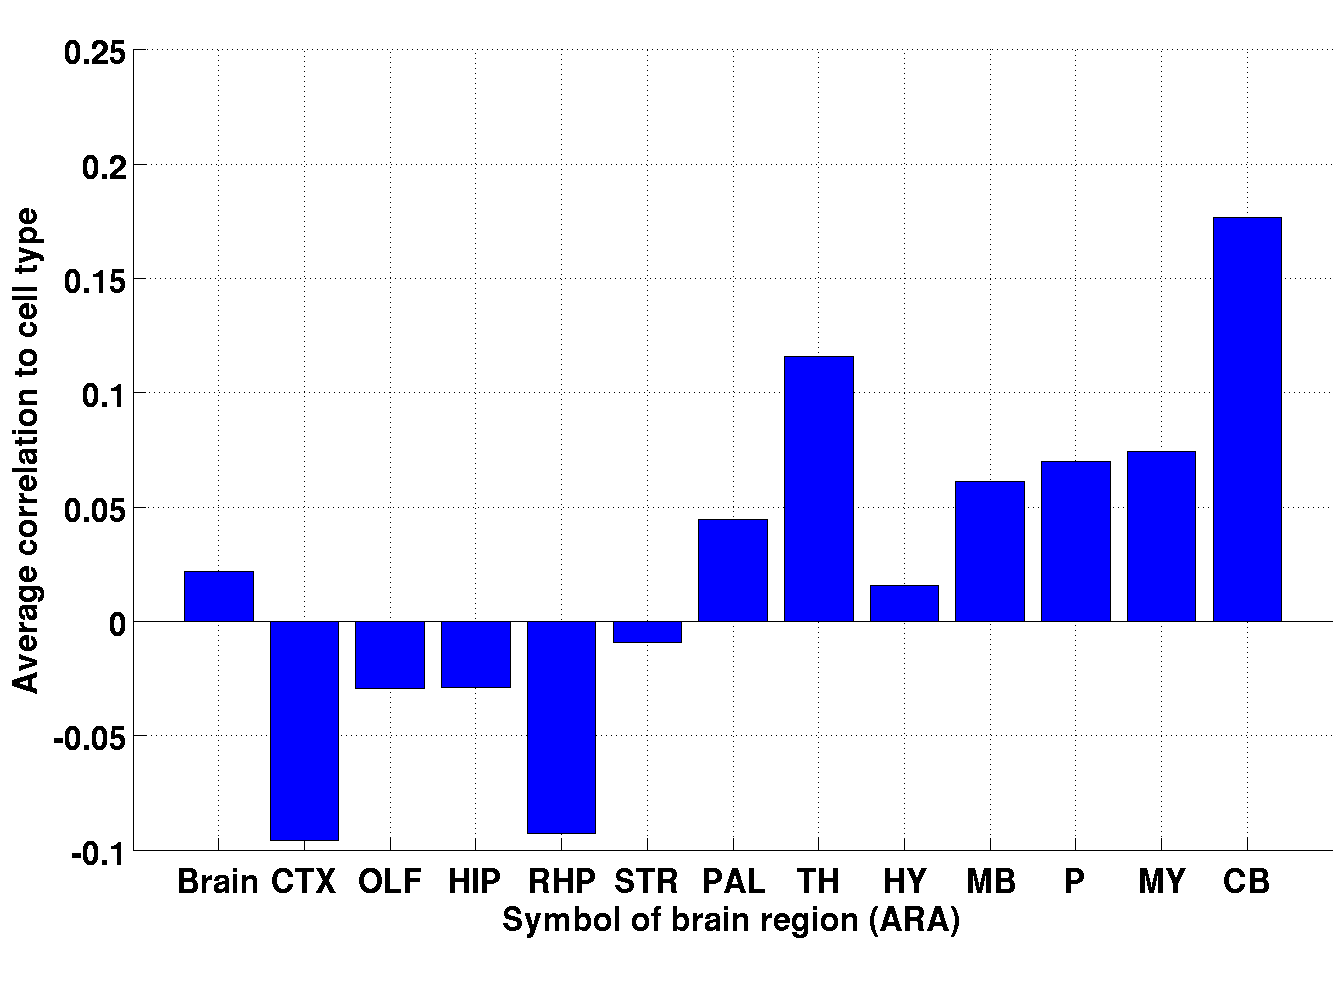
labeled . A bar diagram of the average correlations between
granule cells (index =20, illustrated in Figure 2(a) of the main
text), and the regions of the ’big12’ annotation, is
shown on Figure 1 (the symbols of the brain
regions can be found in Table 1). The top
region by correlation for granule cells is the cerebellum.
In the figures derived from the brain-wide correlation
profiles (Tables 40–50),
the maximal-intensity projections of each
correlation profile are supplemented by a section
through the top region by correlation.
3.1.2 Ranking brain regions by density profile
For a cell type labeled , we can compute the fraction of the total brain-wide density density contributed by voxels of each region labeled in the ARA:
| (13) |
where Brain Annotation is the set of voxels included in the annotation (for the ’big12’ annotation this set consists of the left hemisphere, as can be seen from the projections in Table 1). The brain regions in the ARA are ranked according to the fractions of density defined in Equation 18. For each cell type , the fractional densities supported by the brain regions sum to 1:
| (14) |
The region with highest fraction of density for a given cell type
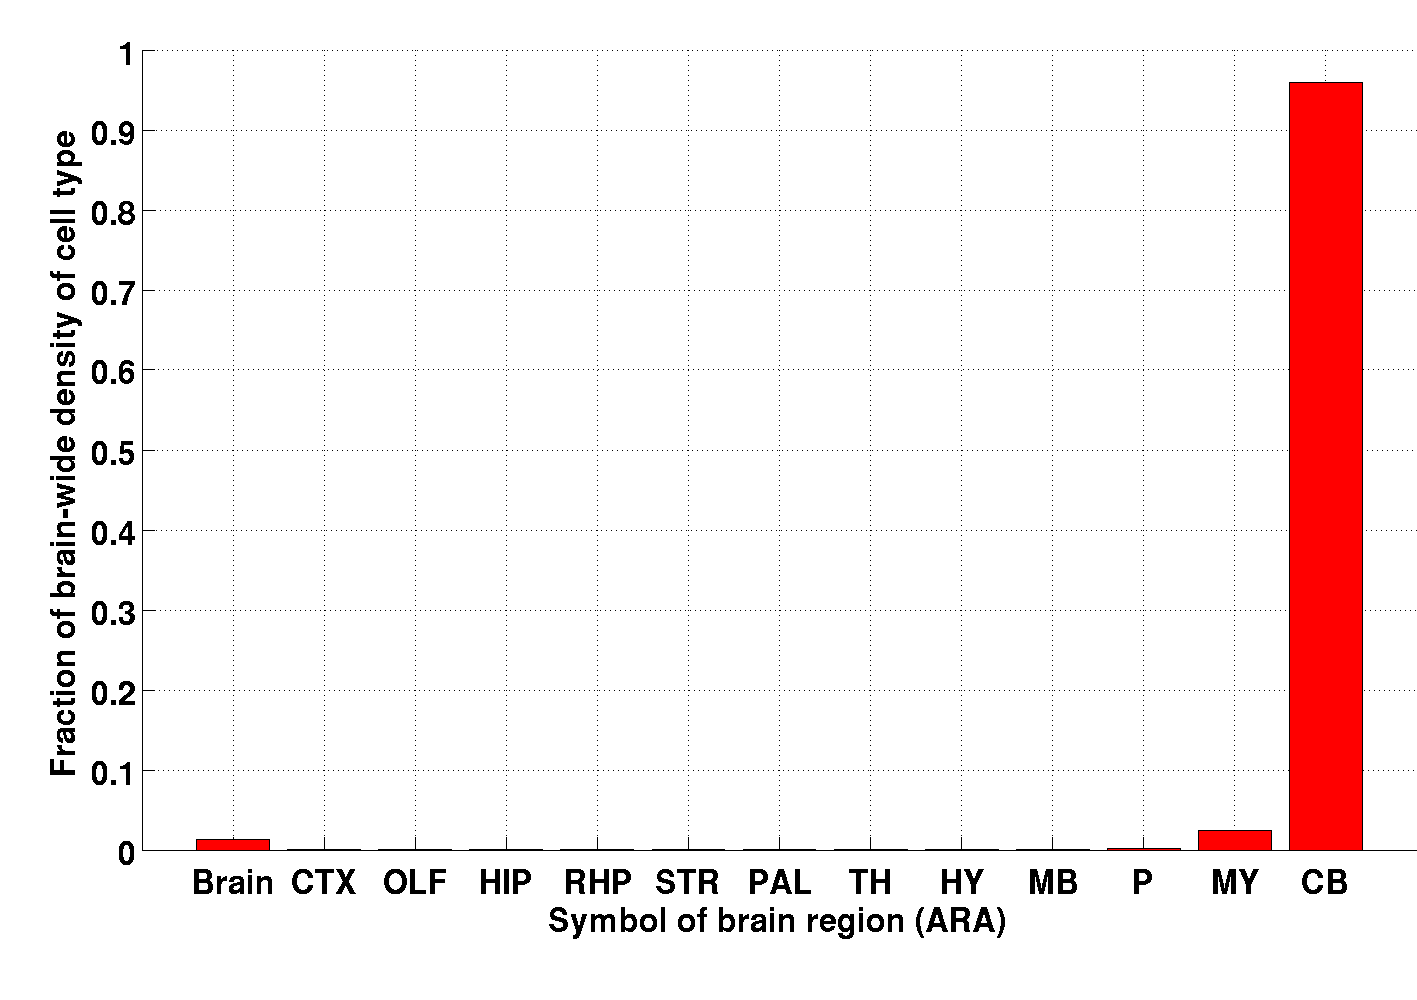
is called the top region by density for this type. A
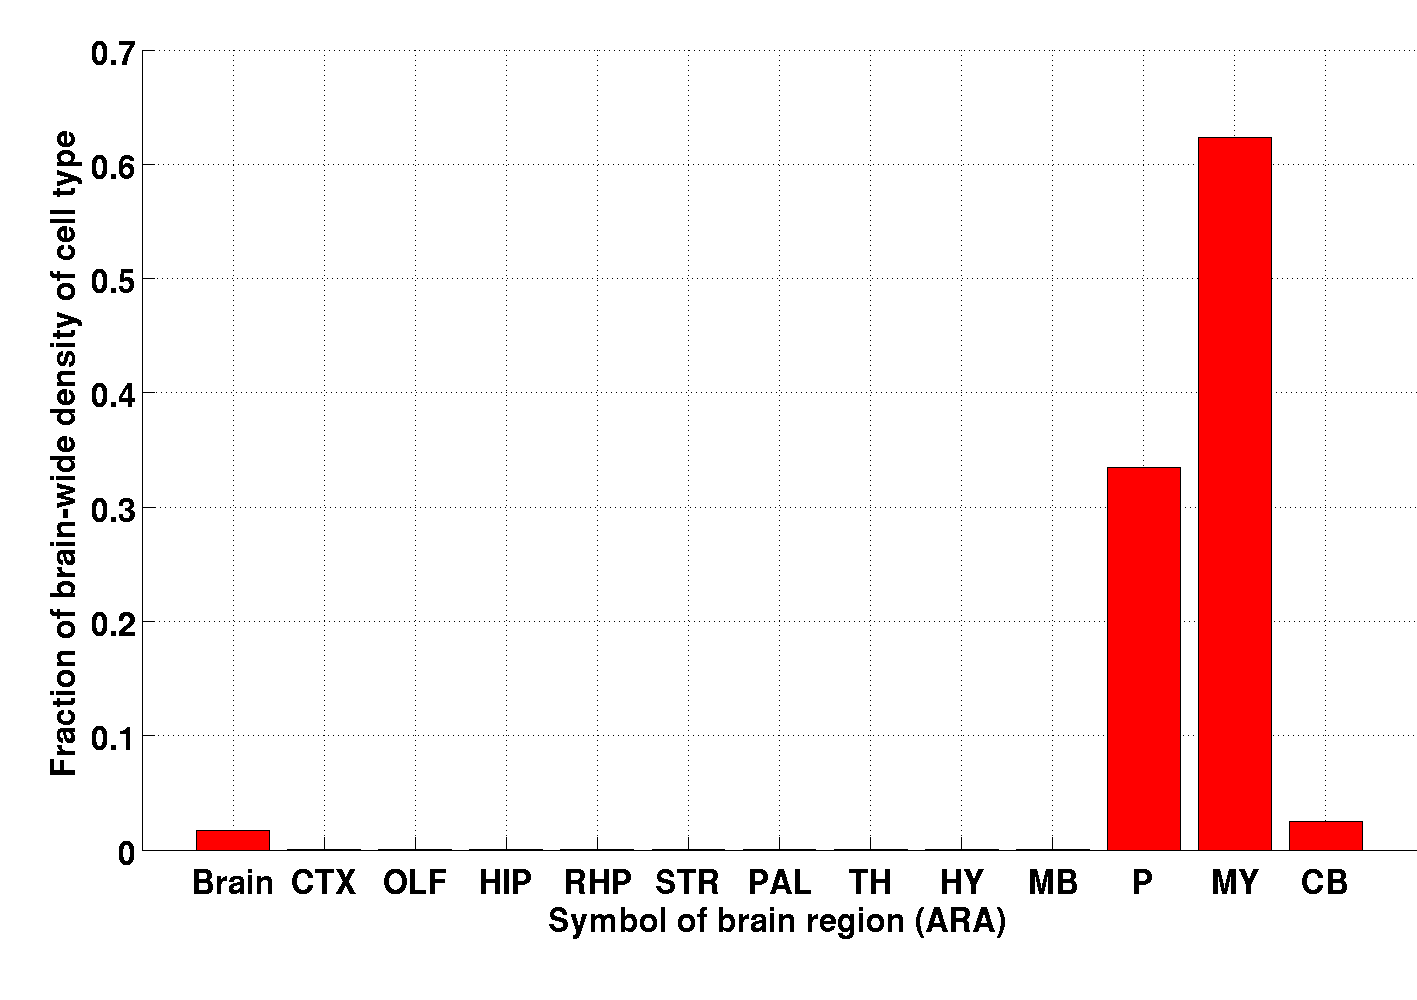
bar diagram of the fractions of the density profile for granule cells
(cell type index =20),
is shown on Figure 2. The top region by density
for granule cells is the cerebellum.
In the figures derived from the brain-wide correlation density
profiles (Tables 51–61),
the maximal-intensity projections of each
density profile are supplemented by a section
through the top region by density.
3.2 Anatomical data for cell-type-specific samples
For each of the cell-type-specific samples in this study,
anatomical metadata indicate the brain region from which the sample
was extracted (see Tables 64 and
65). Eight of the twelve regions of the
coarsest version of the Allen Reference Atlas (the ’big12’ annotation) are represented in this data set (see Table
2), with an over-representation of the cerebral
cortex (41 of the 64 samples come from the cerebral cortex, whereas
the region occupies 29.5 percent of the volume of the brain, see
Table 1). The cerebellum is the only other
brain region in the ’big12’ annotation to be
over-represented by cell-type-specific samples compared to the volume
of the brain it occupies. The regions that are not represented are the
olfactory areas, the retrohippocampal region and the hypothalamus. The
group of voxels labeled ’Basic cell groups of regions’, which includes
the white matter, is also unrepresented.
| Brain region | Number of cell-type-specific samples | List of sample indices in the list of 64 samples in this study |
|---|---|---|
| Basic cell groups and regions | 0 | |
| Cerebral cortex | 41 | |
| Olfactory areas | 0 | |
| Hippocampal region | 2 | |
| Retrohippocampal region | 0 | |
| Striatum | 3 | |
| Pallidum | 1 | |
| Thalamus | 1 | |
| Hypothalamus | 0 | |
| Midbrain | 3 | |
| Pons | 1 | |
| Medulla | 1 | |
| Cerebellum | 11 |
For each of the cell-type-specific samples, we computed the ranks of the brain regions in the ARA according to correlation and density profiles, as defined in Equations 12 and 18. It is interesting to compare the computed top region by density and the top region by correlation to the brain region from which the cell-type-specific sample was extracted (listed in Tables in S9). In the rest of this section, we group the cell-type-specific samples that were extracted from a given brain region, and compare this region to the top region by correlation and to the top region by density (except for the set of voxels called ’Basic cell groups’, which is discussed first as it appears as the top region in the results for a number of cell types).
3.3 Neuroanatomical patterns of results, grouped by the regions in the ’big12’ annotation of the left hemisphere
3.3.1 Basic cell groups and regions
The patchy group of voxels assigned the label ’Basic cell groups and
regions’ in the digitized version of the Allen Atlas at a resolution
of 200 microns (see Table 1) is not found in
the list of brain regions from which the cell-type-specific samples
analyzed here were extracted (see Table
2). However, this set of voxels is the top region
by correlation and/or density for several cell types, and an
inspection of the maximum-intensity projection of the correlation and
density profiles for these cell types reveals an anatomical pattern
that resembles the brain’s white matter structures, including the
arbor vitae. As can be seen in Table 3,
most of these cell types were extracted from the cerebral cortex,
except the astroglia (sample index =28, [19]), which
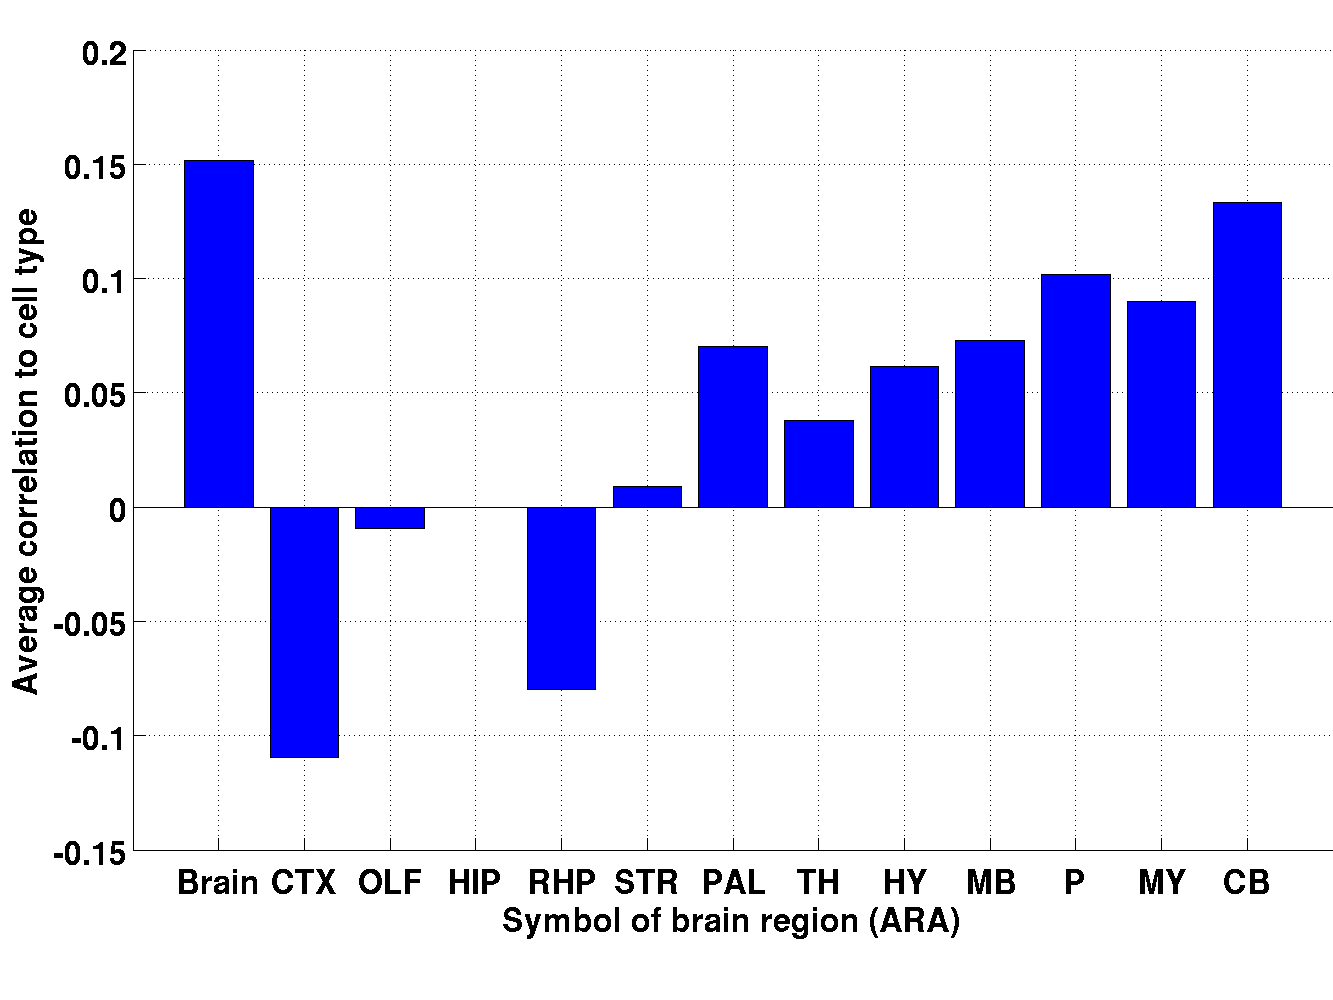
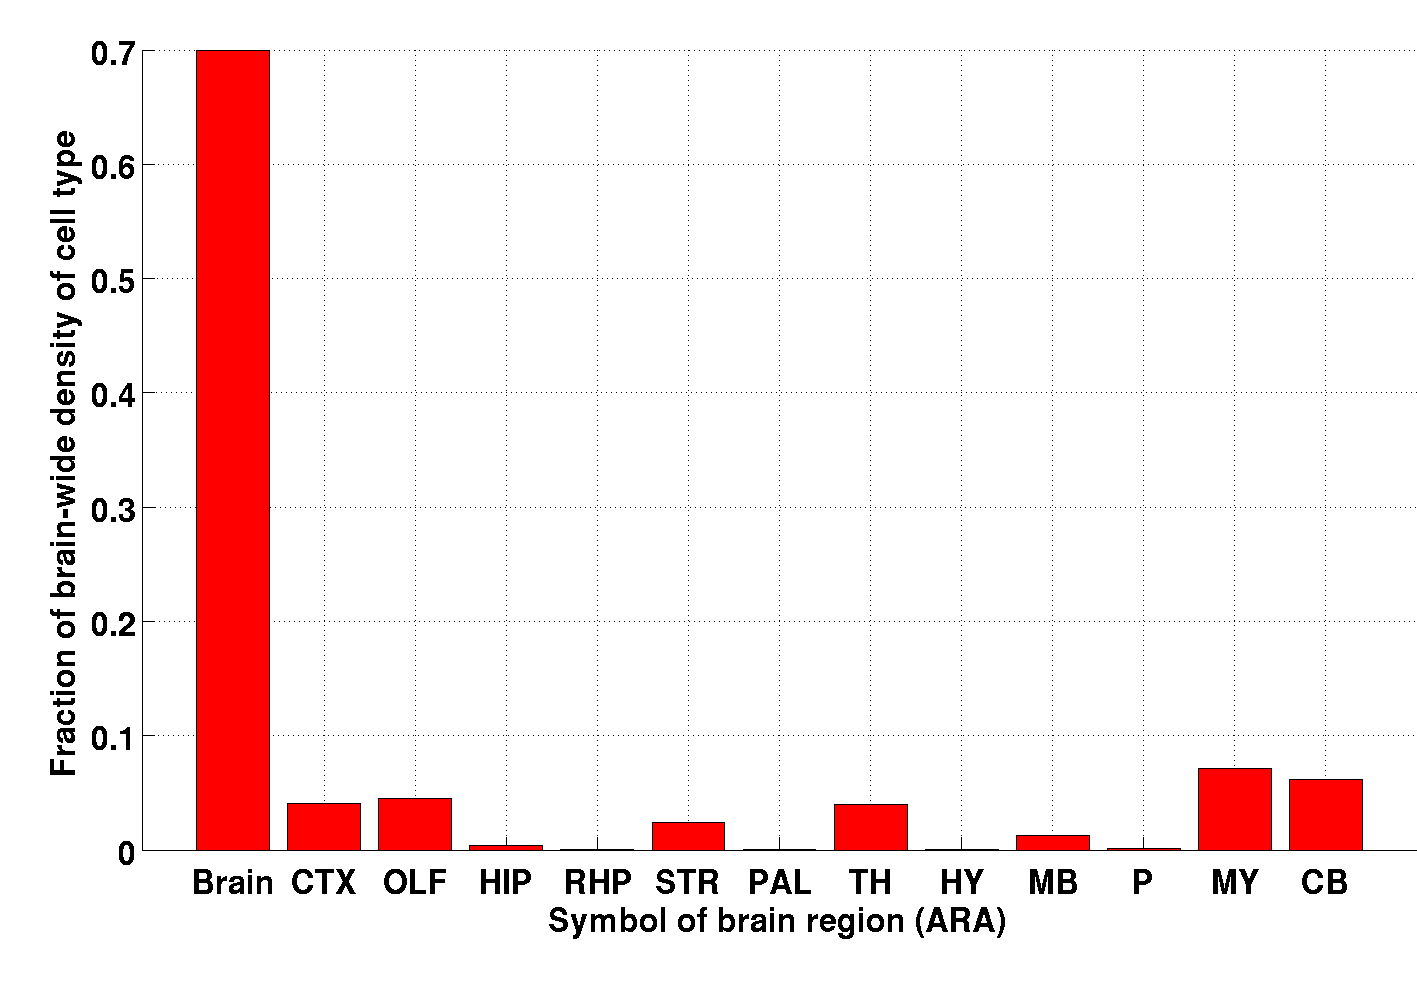
were extracted from the cerebellum). The sum of the density profiles
of these cell types is illustrated on Figure 3.
All the cell types whose top region by density is ’Basic cell groups
and regions’ are oligodendrocytes, astroglia or astrocytes.
| Description (index) | Origin of sample | Fraction of density in ’Basic cell groups and regions’ (%) |
|---|---|---|
| Mature Oligodendrocytes (22) | Cerebral cortex | 53.6 |
| Astroglia (29) | Cerebral cortex | 56.0 |
| Astrocytes (30) | Cerebral cortex | 19.7 |
| Astrocytes (31) | Cerebral cortex | 69.9 |
| Astrocytes (32) | Cerebral cortex | 51.4 |
| Oligodendrocytes (36) | Cerebral cortex | 56.8 |
| Astroglia (28) | Cerebellum | 74.3 |

Figures 4 and 5 show results for a class of astrocytes [18] (cell-type index 31) extracted from the cerebral cortex. The brain-wide correlation and density profiles exhibit a pattern resembling white-matter structures, with the most caudal component corresponding to the arbor vitae.


3.3.2 Cerebral cortex
Some of the cell-type-specific
samples extracted from the cerebral cortex have a correlation
and/or density profile resembling white matter (which
is included within the ’Basic cell groups and regions’ in the ARA).
See the previous subsection, Table 3 and Figure
3 for a separate analysis of these cell types.
neurons, index 48, and glutamatergic neurons, index 53, both
studied in [23]) were extracted from the
amygdala (see Tables
64–65). The
amygdala in not one of the brain regions in the ’big12’ annotation of the ARA. The amygdala is split between the
subcortical plate (which is included in the cerebral cortex in the
numerical version of the ARA at a resolution of 200 microns) and
the olfactory areas [9]. A visual inspection of the
correlation and density profiles for both these cell types (Figures
6 and 7) allows to
detect a pattern resembling the amygdala, and indeed the cerebral
cortex and the olfactory areas rank first and second by the
fraction of the density profile they support (see Table
4). It is interesting to examine the
fraction of the density profile supported by the various
subdivisions of the olfactory areas (according to the ’fine’annotation), especially for glutamatergic neurons, for which
olfactory areas support more than 64 % of the total density
profile (see Table 5). The
Cortical amygdalar area and Piriform-amygdalar area are among the
main subregions of the olfactory areas contributing to the density
profile of both cell types, which confirms the visual impression
of an amygdalar pattern.


| Description (index) | Fraction of density in cerebral cortex (%) | Fraction of density in olfactory areas(%) | Rank of Cerebral cortex in ’big12’ | Rank of Olfactory areas in ’big12’ |
| Pyramidal neurons (48) | 38.5 | 29.3 | 1 | 2 |
| Glutamatergic neurons (53) | 30.2 | 64.9 | 2 | 1 |
| Description (index) | Subregion of Olfactory areas in the ARA (’fine’ annotation) | Fraction of density in the region(%) | Fraction of Olfactory areas occupied by the region |
|---|---|---|---|
| Pyramidal neurons (48) | Piriform area | 40.3 | 28.4 |
| Cortical amygdalar area | 29.3 | 5.5 | |
| Postpiriform transition area | 15.4 | 2.2 | |
| Piriform-amygdalar area | 9.1 | 1.9 | |
| Nucleus of the lateral olfactory tract | 4.0 | 1.0 | |
| Anterior olfactory nucleus | 1.4 | 9.5 | |
| Taenia tecta | 0.5 | 3.2 | |
| Main olfactory bulb | 0 | 41.4 | |
| Accessory olfactory bulb | 0 | 1.6 | |
| Glutamatergic neurons (53) | Cortical amygdalar area | 59.9 | 5.5 |
| Piriform-amygdalar area | 19.1 | 1.9 | |
| Postpiriform transition area | 13.2 | 2.2 | |
| Piriform area | 7.4 | 28.4 | |
| Main olfactory bulb | 0.4 | 41.4 | |
| Accessory olfactory bulb | 0 | 1.6 | |
| Anterior olfactory nucleus | 0 | 9.5 | |
| Taenia tecta | 0 | 3.2 | |
| Nucleus of the lateral olfactory tract | 0 | 1.0 |
Having treated separately the cell types that correlate best or have
highest density fits to the white matter (see Table
3), as well as the two amygdalar cell types, we
are left with 29 cortical cell types. For 5 of these – all
pyramidal neurons – the cerebral cortex is the top region in the
’big12’ annotation of the ARA, both by average correlation and by
fraction of the density profiles. These pyramidal neurons were all
extracted from adult animals, except for the cell type labeled 40
(P14); see Tables 62,63 for age
data. See Figure 8–10 for heat maps of the
brain-wide correlation and density profiles for these cell types.


| Description (index) | Fraction of density supported in cerebral cortex (%) | Next region in ’big12’ | Fraction of density supported in next region (%) |
|---|---|---|---|
| Pyramidal neurons (7) | 25.4 | Olfactory areas | 24.9 |
| Pyramidal neurons, callosally projecting, P14 (40) | 76.6 | Olfactory areas | 15.9 |
| Pyramidal Neurons (45) | 71.8 | Retrohippocampal region | 14.8 |
| Pyramidal Neurons (46) | 93.6 | Retrohippocampal region | 1.8 |
| Pyramidal Neurons (47) | 84.5 | Retrohippocampal region | 7.2 |
Some cell-type specific samples extracted from the cortex as per the
anatomical data of Table 2 have the cerebral
cortex as top region by correlation, but not as top region by
density. There are 8 such cell types (see Table
7), of which 4 have zero density
profiles in the left hemisphere. The other four cell types
have Olfactory areas or Retrohippocampal region as their
top region by density.
| Description (index) | Top region by density (percentage of density supported) | Rank of the cerebral cortex out of 13 regions | Fraction of density in cerebral cortex (%) |
|---|---|---|---|
| Pyramidal Neurons (2) | Olfactory areas (100) | 2 (and last) | 0 |
| Pyramidal Neurons (8) | Olfactory areas (100) | 2 (and last) | 0 |
| Mixed Neurons (9) | Cerebellum (100) | 2 (and last) | 0 |
| Interneurons (14) | Olfactory areas (100) | 2 (and last) | 0 |
| Neurons (26) | Olfactory areas (100) | 2 (and last) | 0 |
| Pyramidal Neurons, Corticospinal, P14 (43) | Olfactory areas (72.4) | 2 | 11.5 |
| Pyramidal Neurons, Corticotectal, P14 (44) | Olfactory areas (33.0) | 4 | 9.4 |
| Pyramidal Neurons (50) | Retrohippocampal region (57.6) | 3 | 10.7 |
| GABAergic Interneurons, VIP+ (55) | Olfactory areas (96.7) | 2 | 1.78 |
Some cortical cell-type-specific samples do not have
the cerebral cortex as their top region by correlation or by density. There are 15 such
cell types, 7 of which have zero density in the left hemisphere (they
are not detected by the linear model, see
Table 8). Six cell types have the cortex
as their second ranked region by average correlation, while the top
region is either the hippocampal region or the retrohippocampal
region.
| Description (index) | Top region by correlation | Rank of cerebral cortex by correlation | Top region by density (percentage of density supported) | Rank of the cerebral cortex by density out of 13 regions | Fraction of density in cerebral cortex (%) |
| Pyramidal Neurons (3) | Hippocampal region | 2 | Olfactory areas (100) | 2 (and last) | 0 |
| Mixed Neurons (33) | Retrohippocampal region | 2 | Olfactory areas (58.6) | 3 | 4.8 |
| Oligodendrocyte Precursors (37) | Hypothalamus | 13 | Hypothalamus (33.8) | 7 | 2.6 |
| Pyramidal Neurons, Callosally projecting, P3 (38) | Olfactory areas | 6 | Olfactory areas (100) | 2 (and last) | 0 |
| Pyramidal Neurons, Callosally projecting, P6 (39) | Retrohippocampal region | 2 | Olfactory areas (99) | 4 (and last) | 0 |
| Pyramidal Neurons, Corticospinal, P3 (41) | Olfactory areas | 5 | Olfactory areas (100) | 2 (and last) | 0 |
| Pyramidal Neurons, Corticospinal, P6 (42) | Retrohippocampal region | 2 | Olfactory areas (86.6) | 2 | 7.8 |
| GABAergic Interneurons, VIP+ (54) | Retrohippocampal region | 2 | Striatum (36.6) | 5 | 6.5 |
| GABAergic Interneurons, SST+ (55) | Hypothalamus | 10 | Striatum (30.1) | 8 | 2.4 |
| GABAergic Interneurons, PV+ (58) | Medulla | 7 | Olfactory areas (93.4) | 4 (and last) | 0 |
| GABAergic Interneurons, PV+, P7 (60) | Pallidum | 11 | Olfactory areas (99.2) | 2 | 0.7 |
| GABAergic Interneurons, PV+, P10 (61) | Pallidum | 8 | Olfactory areas (100) | 2 (and last) | 0 |
| GABAergic Interneurons, PV+, P13-P15 (62) | Retrohippocampal region | 2 | Olfactory areas (100) | 2 (and last) | 0 |
| GABAergic Interneurons, PV+, P25 (63) | Medulla | 5 | Olfactory areas (56.5) | 6 | 2.1 |
| GABAergic Interneurons, PV+ (64) | Medulla | 5 | Midbrain (28.1) | 10 | 1.5 |
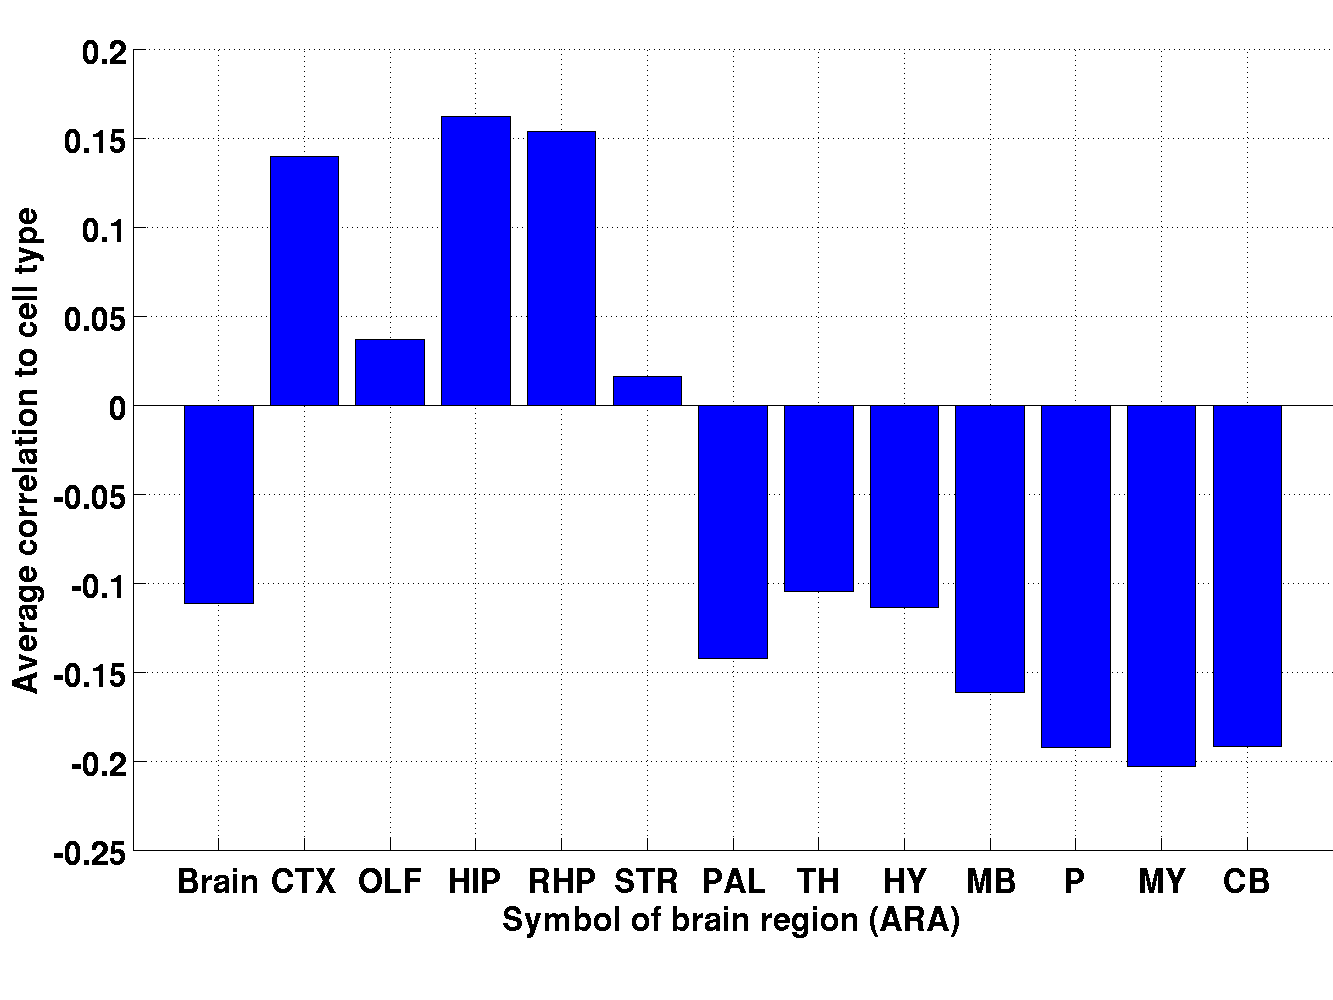
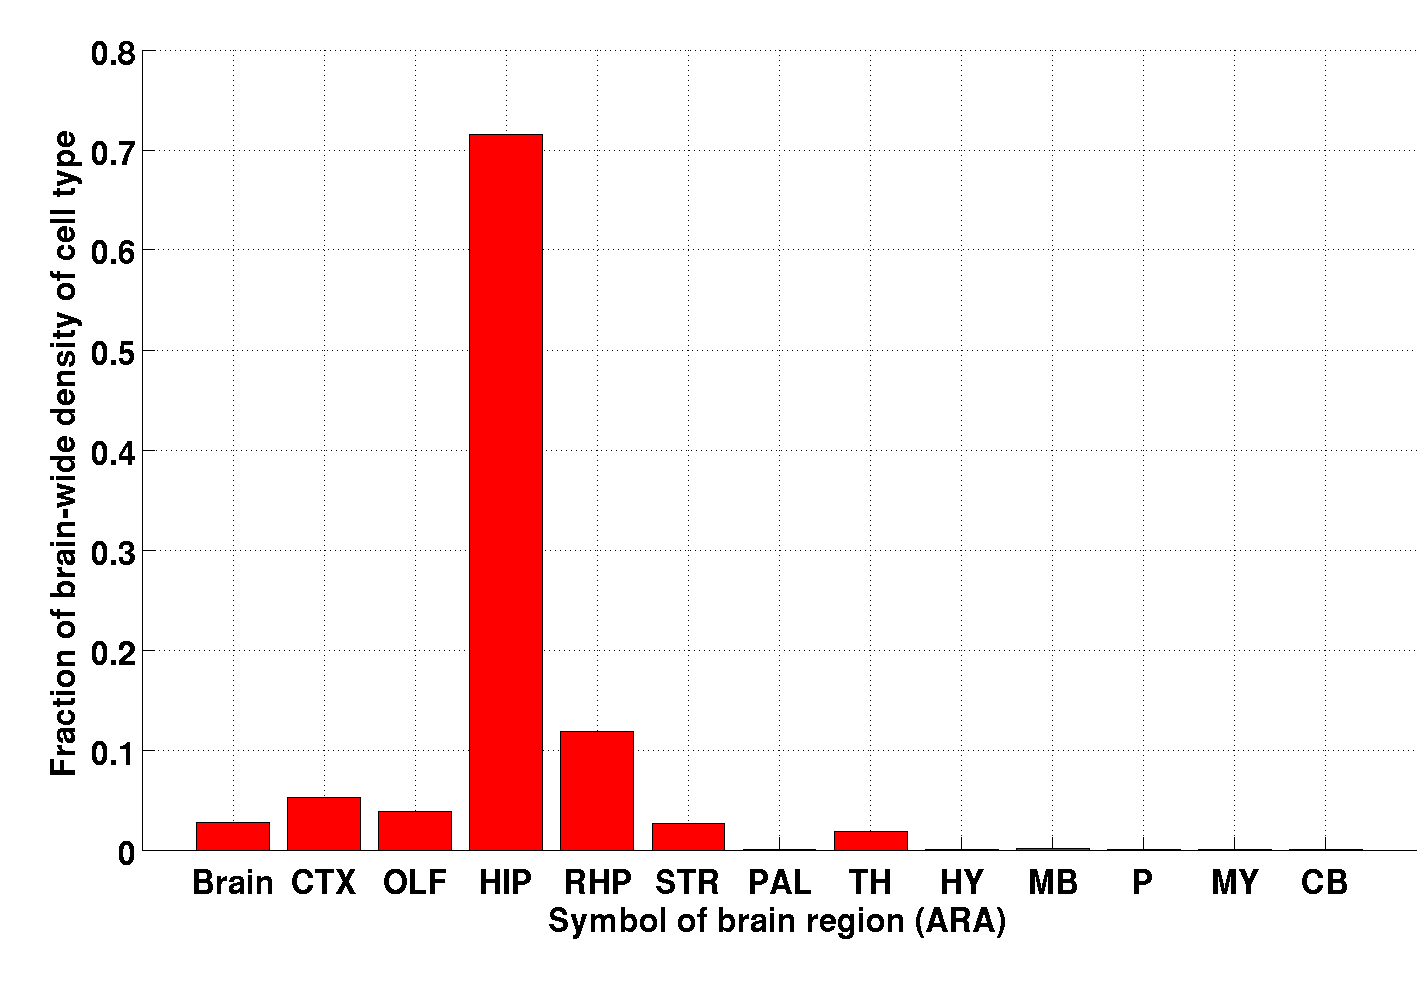
3.3.3 Hippocampal region
Two cell-type-specific samples that were extracted from the
hippocampus (see Table 2). For one of them
pyramidal neurons (index 49, studied in [23]),
the hippocampal region is the top region both by correlation and by
density. We ranked the regions of the ’fine’annotation in the ARA
by their contribution to the density profile of this sample (this
ranking corresponds to Equation 18, with the region
label running over the regions in the ’fine’ annotation).
The first two regions are Ammon’s horn (which contributes 48.8
percent of the total density of this cell type), followed by the
dentate gyrus (which contributes 25.4 percent of the total density
of this cell type). These two regions are the two subregions of the
hippocampal region in the ’fine’annotation. Moreover, the data of
[23] specify that the sample labeled 49 was
taken from Ammon’s horn, which indicates that the brain-wide
correlation and density profiles are both consistent with prior
biological knowledge for this cell type.
This sample (index 49) is the only one for which the hippocampus is
ranked first by density. Another sample (index 3), is ranked first by
correlation. This sample was not extracted from the hippocampus, but
rather from the cerebral cortex (primary somatosensory area, layer
5). On the other hand, the cerebral cortex is ranked second by its
fraction of density defined in Equation 18. This
sample has an estimated density profile with values close to zero,
except in a few voxels belonging to the olfactory bulb.
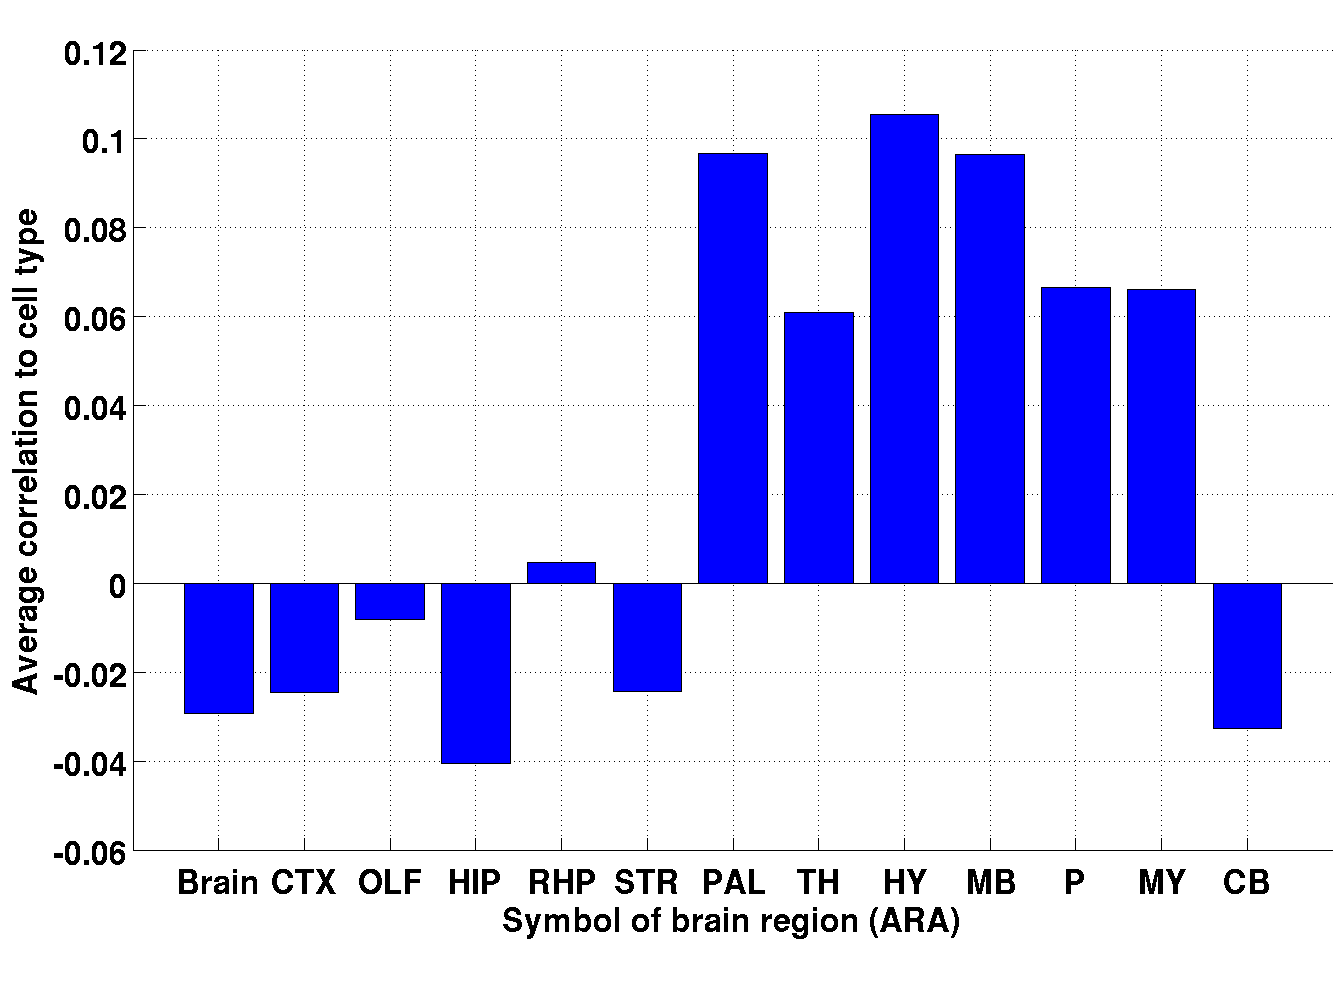
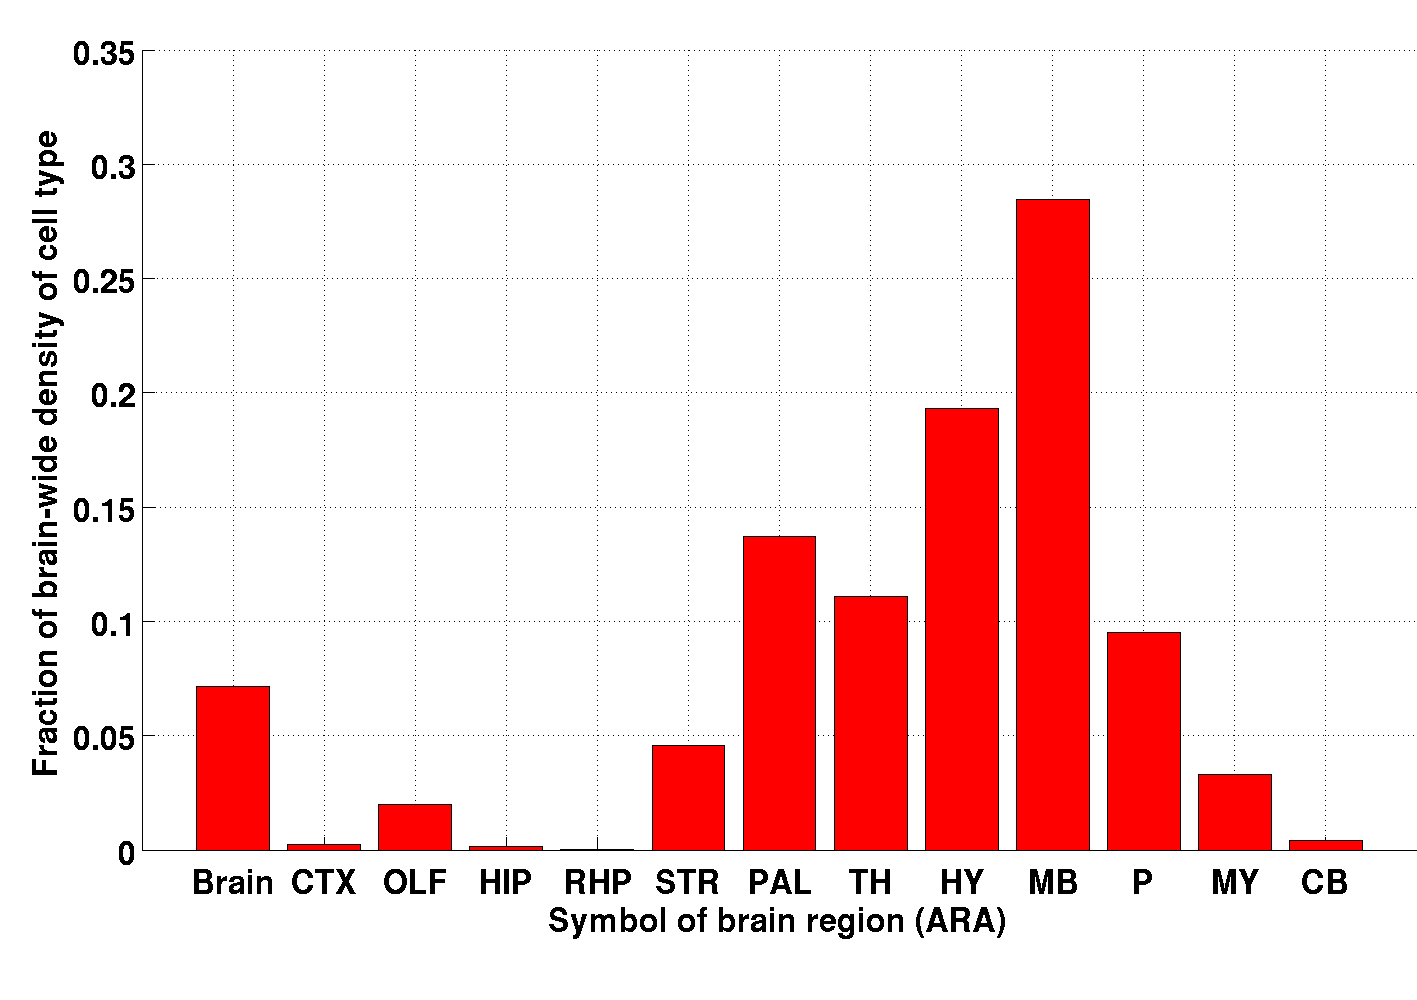
The second sample extracted from the hippocampus consists of
somatostatin-positive GABAergic interneurons (index 57). The
hippocampal region is ranked last by correlations and next-to-last by
densities, whereas the first region by average correlation is
hypothalamus, and the first region by density is midbrain (see Figure
12 and 14). Visual
inspection of the Tables
49,50,60,61
shows that there is a lot of solidarity between the correlation
profiles of the cell types labeled with indices between 54 and 64,
which are all GABAergic interneurons. For these cell types,
with the exception of the cell type labeled 55, whose top region by
correlation is the cerebral cortex, the correlations are higher in
regions of the brain that are more ventral than the region from which
the samples where extracted.
| Description (index) | Origin of sample | Rank of region (out of 94) in the ’fine’ annotation (by correlation) | Rank of region (out of 94) in the ’fine’ annotation (by density) | Fraction of density in the region | Fraction of density supported in the hippocampal region |
| Pyramidal neurons (49) | Ammon’s horn | 3 | 1 | 48.7% | 71.5% |
| GABAergic interneurons, SST+ (57) | Ammon’s horn | 91 | 55 | 0.1% | 0.1% |


3.3.4 Striatum
Three cell-type-specific samples (cholinergic neurons – index 13, Drd1+ medium spiny neurons – index 15, and Drd2+ medium spiny neurons – index 16) in the data set were extracted from the striatum.
| Description (index) | Origin of sample | Rank of region (out of 12) in the ’big12’ annotation (by correlation) | Rank of region (out of 12) in the ’big12’ annotation (by density) | Fraction of density supported in the striatum |
| Cholinergic neurons (13) | Striatum | 7 | 6 | 3.3% |
| Drd1+ medium spiny neurons (15) | Striatum | 1 | 2 | 30% |
| Drd2+ medium spiny neurons (16) | Striatum | 1 | 1 | 91.4% |
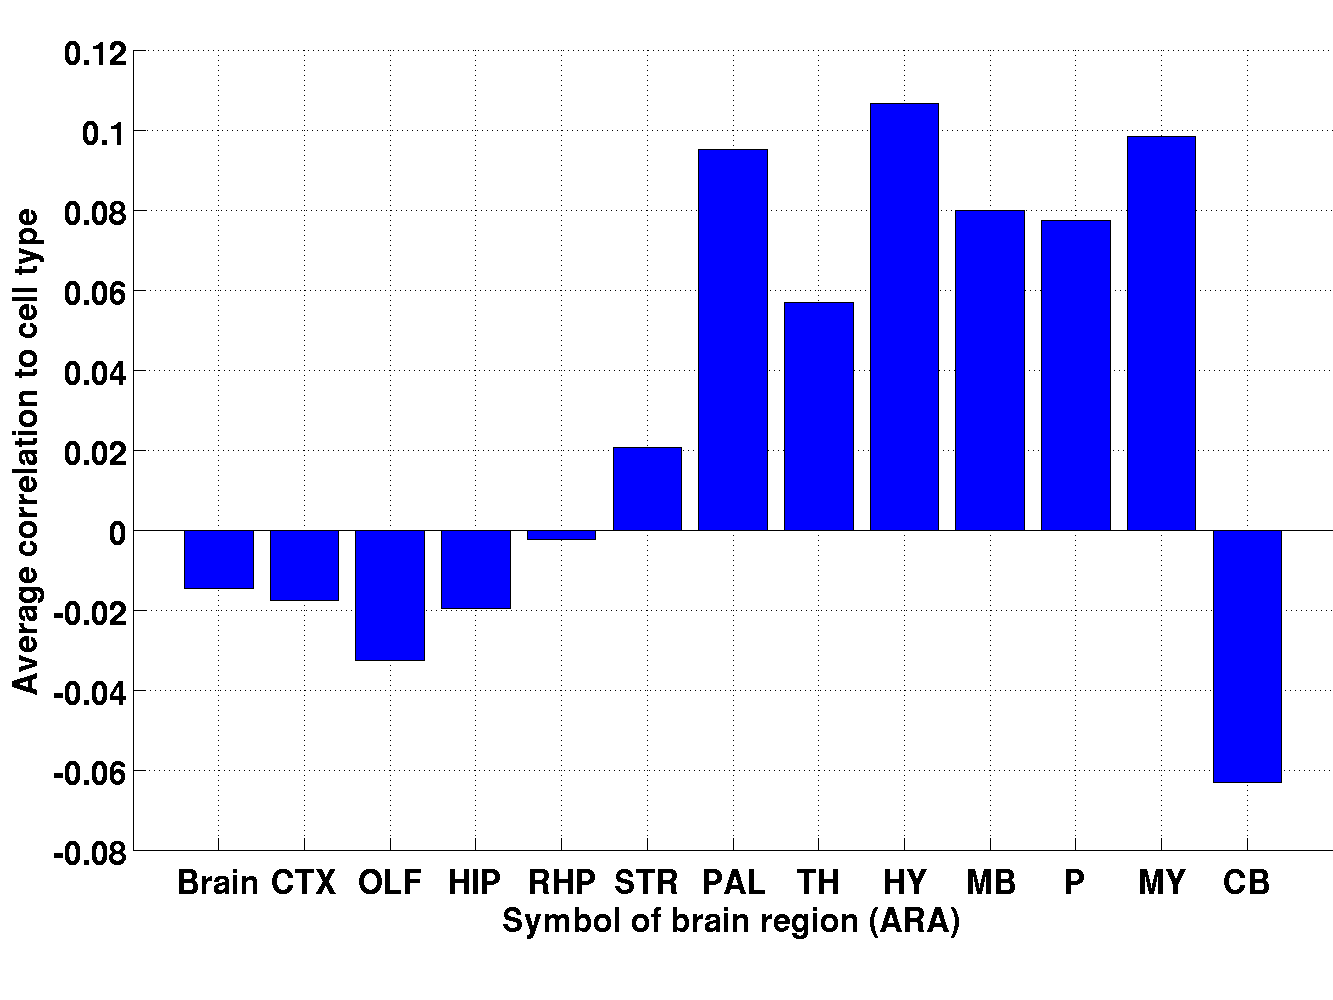
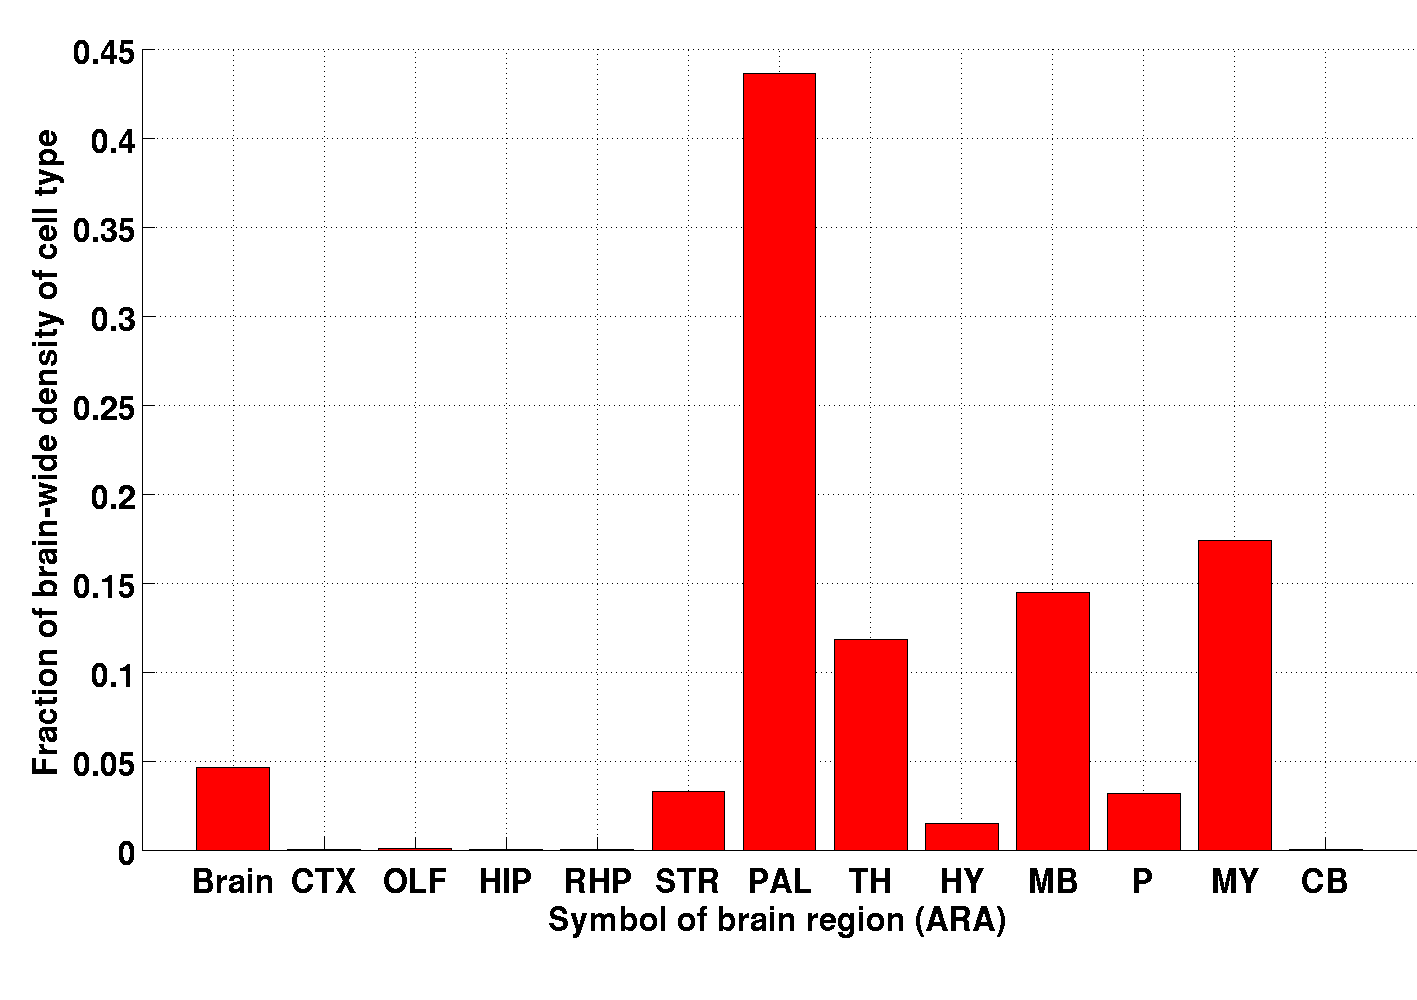
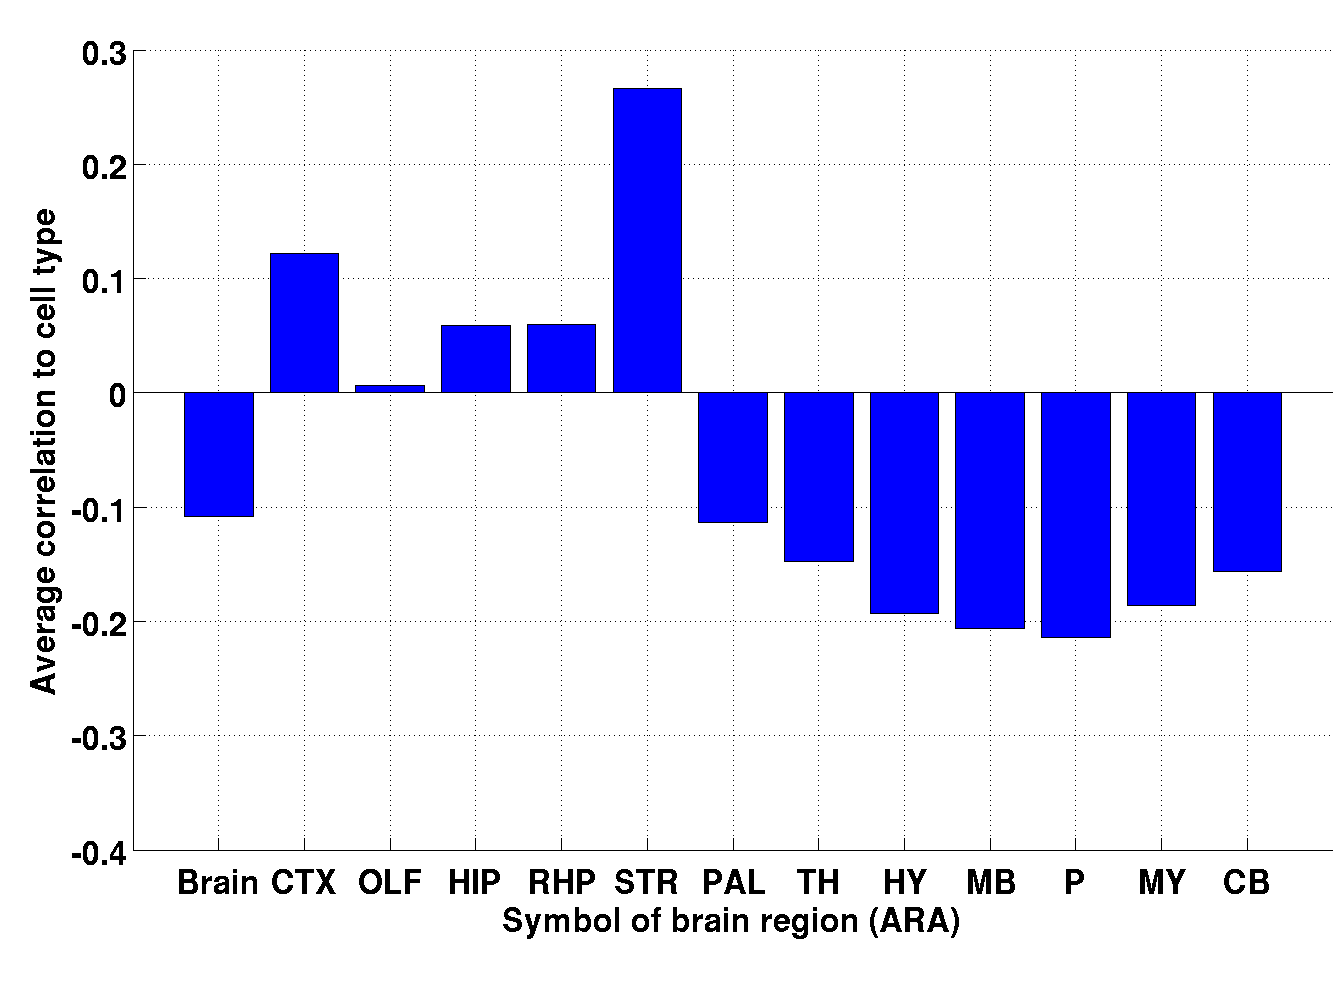
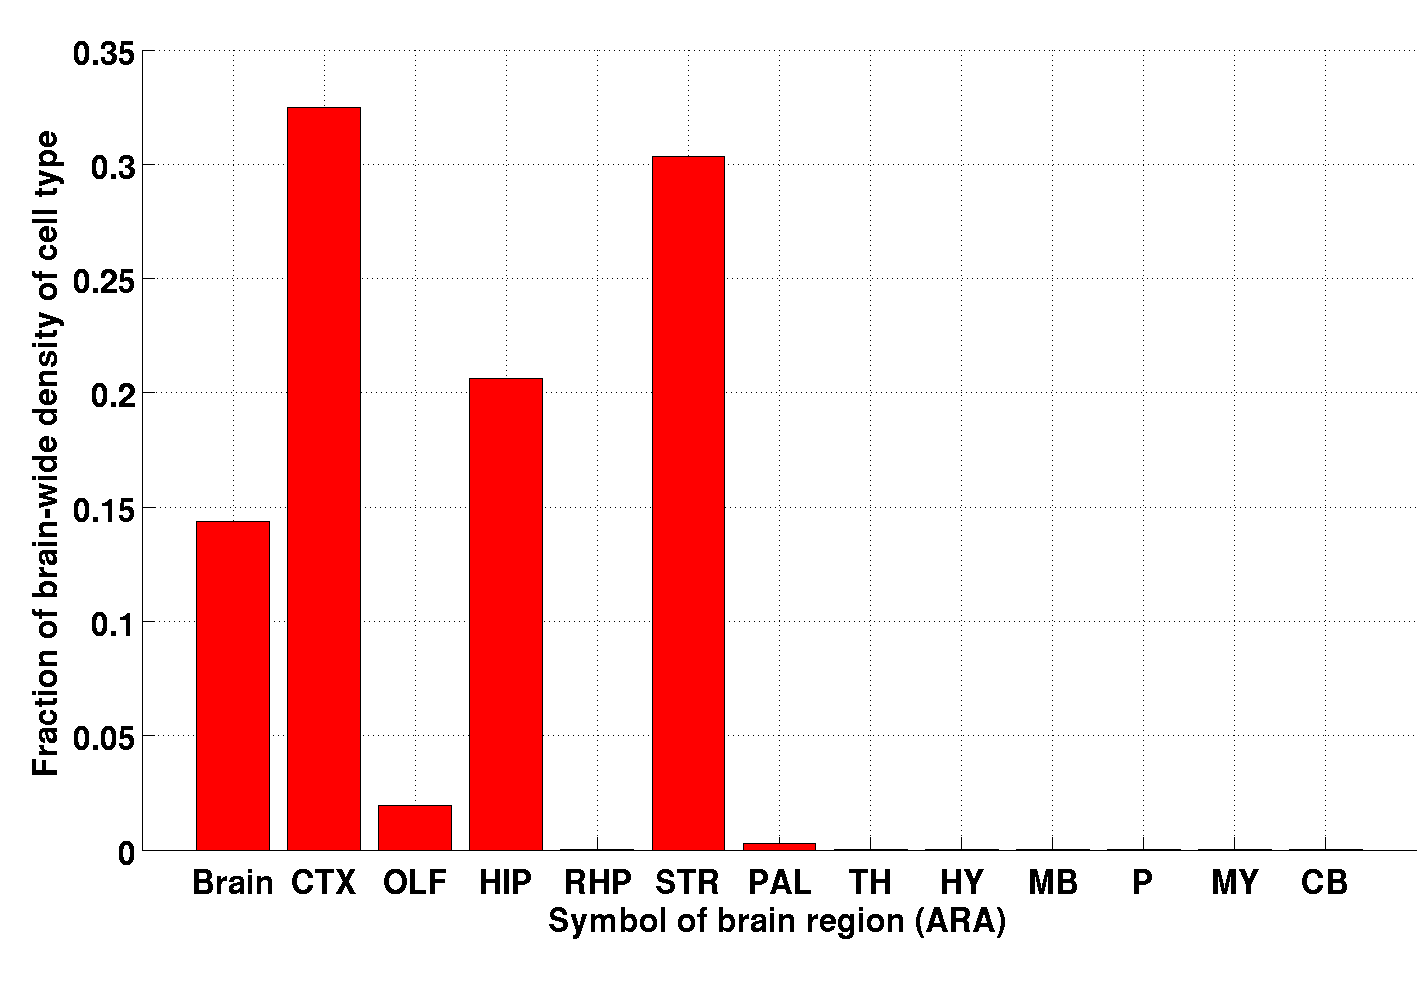
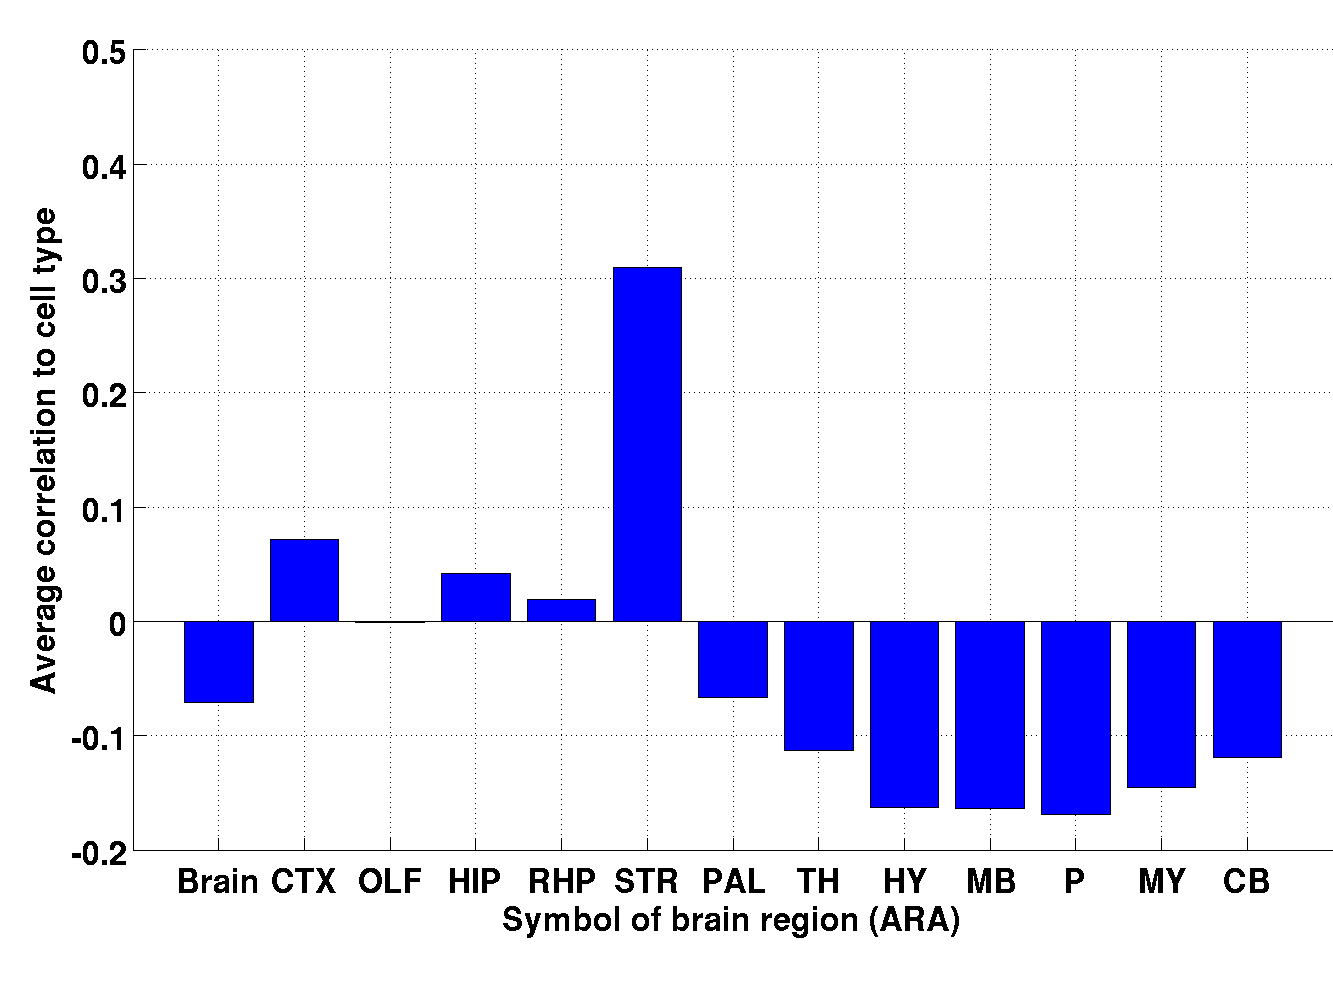
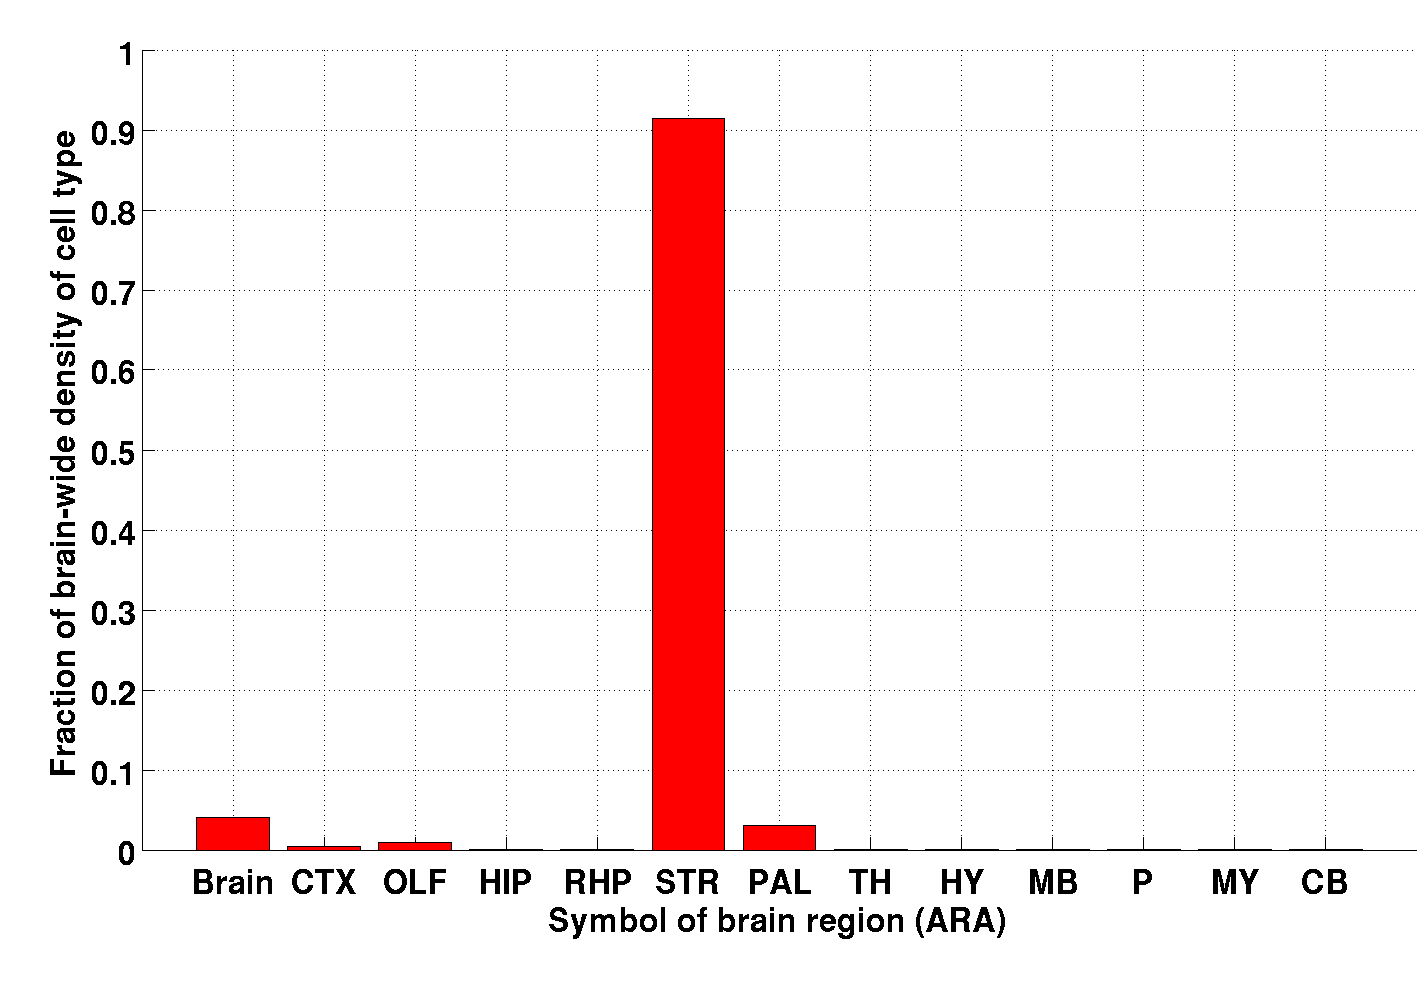
The pallidum is the region in the ’big12’ annotation that supports the highest fraction (43%) of the density of cholinergic neurons (index 13), and the striatum ranks only 7th by correlation and 6th by density (see Table 10 Figures 15 and 18).
On the other hand, medium spiny neurons [19] expressing both dopamine receptor types have striatum as their top region by correlations (see Figures 16, 17, 19, and 20). The striatum is the top region by density for Drd2+ medium spiny neurons, and the second region by density for Drd1+ medium spiny neurons, after the cerebral cortex.


3.3.5 Pallidum
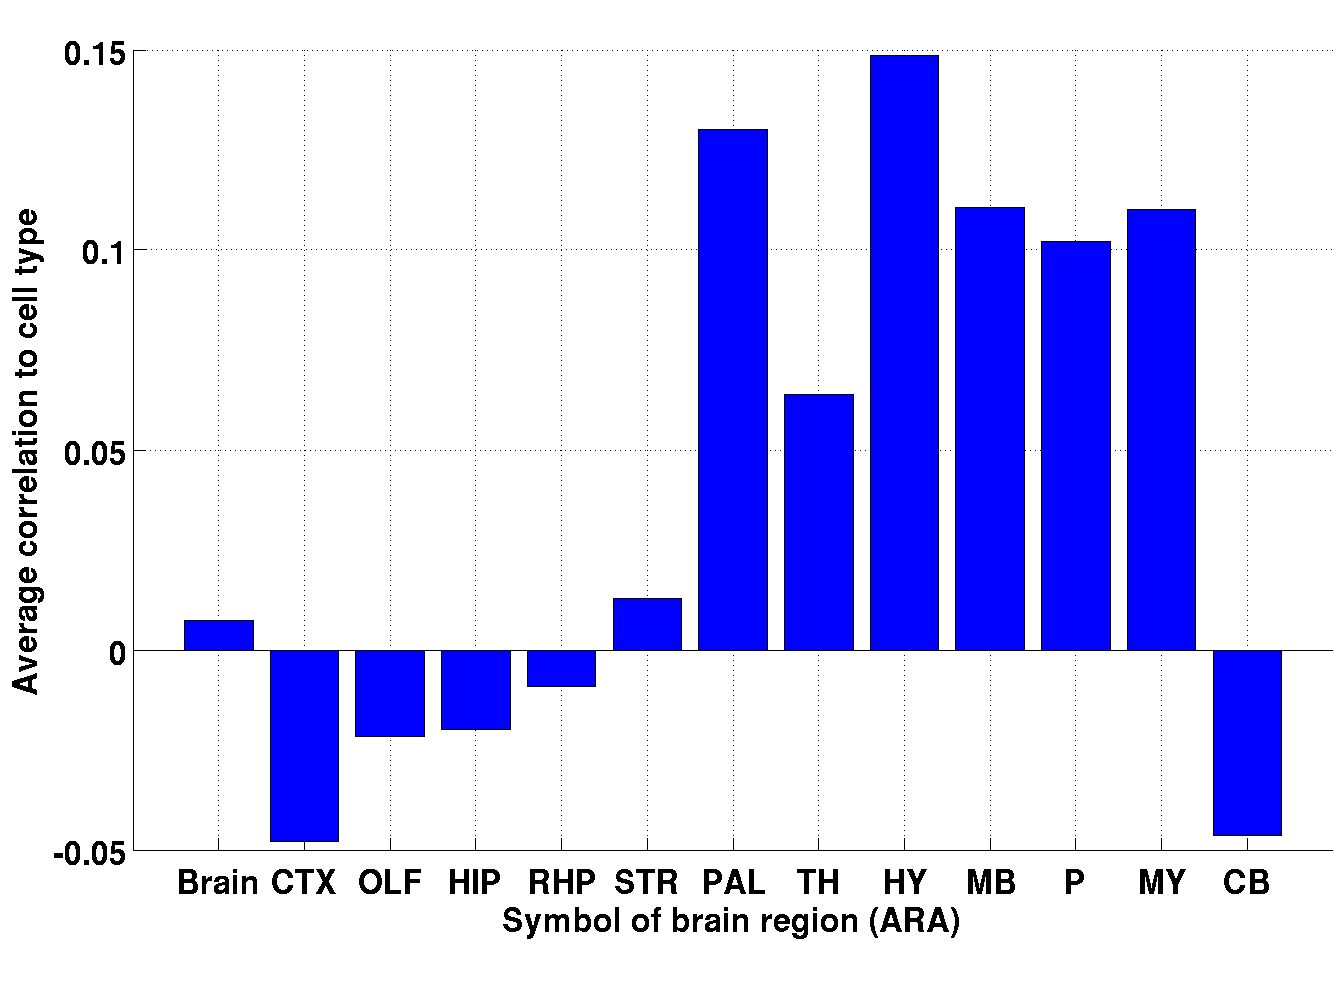
The cell-type-specific sample with index 11 (Cholinergic projection neurons), which is the only sample obtained from the pallidum, has the hypothalamus as its top region by correlation, followed by pallidum (see Figures 21 and 22). Pallidum ventral region, which is the region in the ’fine’ annotation from which the cell-type-specific sample was extracted, ranks 30th out of 94 regions by average correlation (see Table 11). This sugests that cholinergic projection neurons are not very region specific. Moreover, the estimated density of this cell type is zero in the left hemisphere.
| Description (index) | Origin of sample | Rank of region (out of 94) in the ’fine’ annotation (by correlation) | Rank of region (out of 94) in the ’fine’ annotation (by density) | Fraction of density in the region (%) | Fraction of density supported in the pallidum |
| Cholinergic projection neurons (11) | Pallidum ventral region | 30 | N/A | N/A | N/A% |


3.3.6 Thalamus
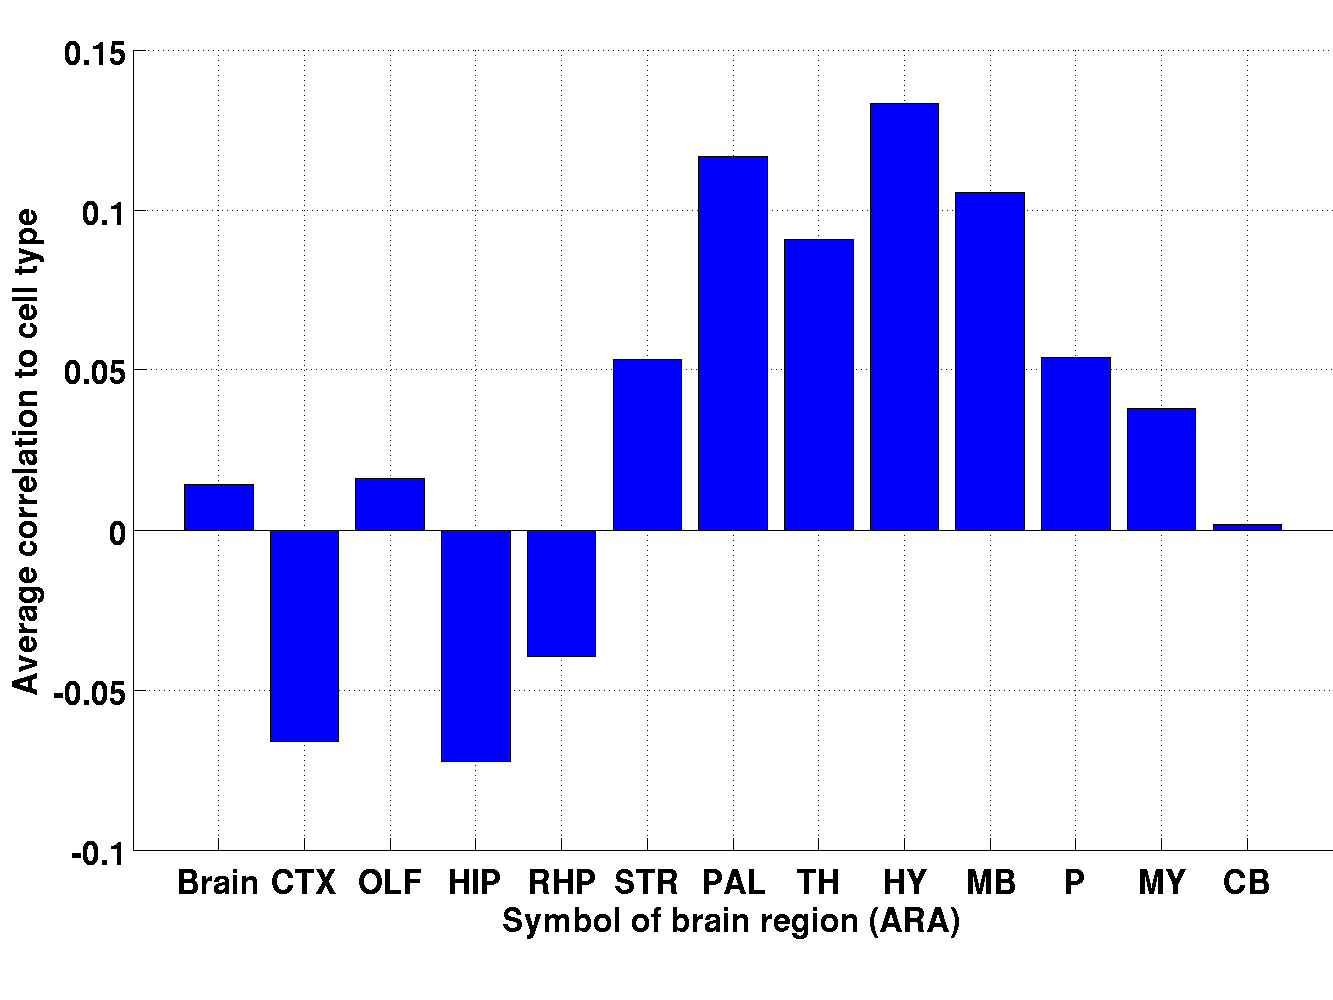
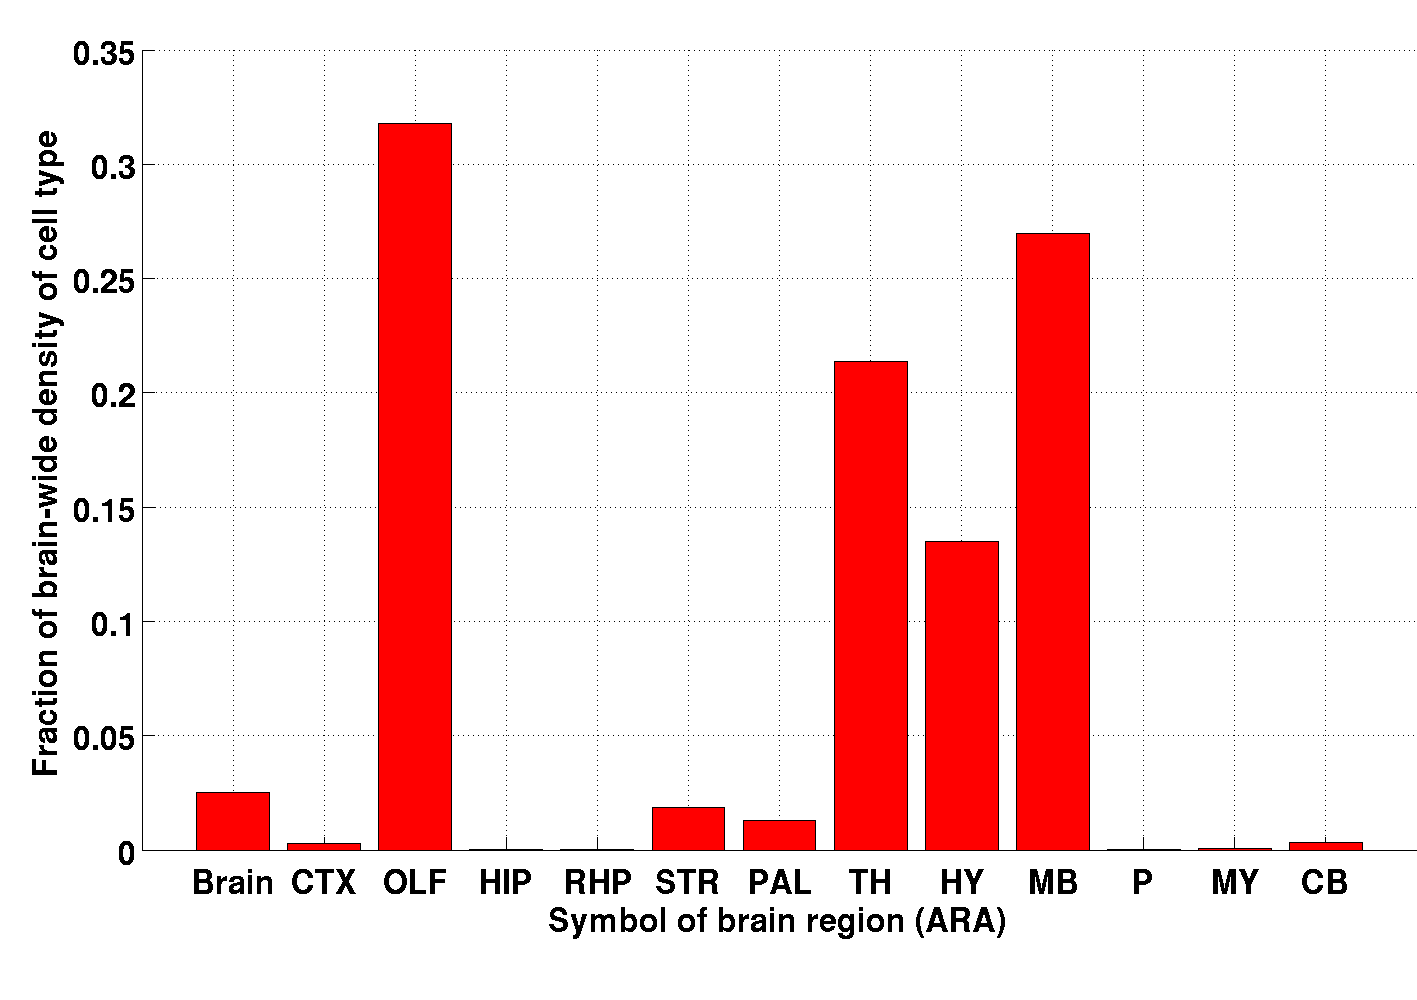
Table 12 summarizes results for the cell-type-specific sample extracted from the thalamus (GABAergic Interneurons, PV+, index 59). Thalamus supports less of the density profile than Olfactory areas and Midbrain (it is ranked third by density and fourth by correlation). Moreover, there seems to be little solidarity between the ranking of regions by correlation and by density (see Figures 23 and 24).
| Description (index) | Origin of sample | Rank of region (out of 94) in the ’fine’ annotation (by correlation) | Rank of region (out of 94) in the ’fine’ annotation (by density) | Fraction of density in the region | Fraction of density supported in the thalamus |
| GABAergic Interneurons, PV+ (59) | Dorsal part of the lateral geniculate complex | 63 | 31 | 0.2% | 21.3% |


3.3.7 Midbrain
Three cell-type-specific samples were extracted from the midbrain.
Out of them, two (A9 dopaminergic neurons –index 4– and A10
dopaminergic neurons –index 5) have the midbrain as their top region
by density (see Figures 25,
26, 28 and
29). For both of these samples, the midbrain ranks
second by correlation, after the hypothalamus.
However, a visual inspection of the projections of correlation and density profiles
of Figures 25 and 26
shows some heterogeneity across midbrain, with higher values
in the ventral region of it. The ’big12’ annotation
is too coarse for this heterogeneity to be detected by our ranking procedures.
We therefore ranked the regions of the ’fine’ annotation are ranked by correlation and
density according to Equations 12 and
18. The region that is ranked highest by density for
A9 dopaminergic neurons is the ’Substantia nigra, compact part’,
which is a subregion of midbrain, and is indeed the finest anatomical
label available (see Table 64). This region is
ranked second by correlation, the first being ’Ventral tegmental
area’ (which is also a subregion of the midbrain).
For A10 dopaminergic neurons the region that is ranked first is the
’Hypothalamus’ (which is the ’generic’ subregion of hypothalamus in
the ’fine’ annotation, assigned to any voxels that are in hypothalamus
but cannot be reliably assigned to a finer subdivision), but the
second region is the ’ventral tegmental area, which is a subregion of
midbrain, and is indeed the finest anatomical label available from
Tables. It is ranked second by
correlation, the first being ’Ventral tegmental area’.
Whereas the midbrain supports a majority of the density for A9 dopaminergic neurons and A10 dopaminergic neurons, it supports only 9.8% of the density in Motor Neurons, Midbrain Cholinergic Neurons (whereas pons and medulla support 32.6% and 51.6% respectively, as can be see on Figure 30).
| Description (index) | Origin of sample | Rank of region (out of 94) in the ’fine’ annotation (by correlation) | Rank of region (out of 94) in the ’fine’ annotation (by density) | Fraction of density in the region | Fraction of density supported in midbrain |
| A9 dopaminergic neurons (4) | Substantia nigra_ compact part | 2 | 1 | 39 % | 77 % |
| A10 dopaminergic neurons (5) | Ventral tegmental area | 1 | 2 | 35 % | 50 % |
| Motor Neurons, Midbrain Cholinergic Neurons (10) | Pedunculo– pontine nucleus | 17 | 94 (zero density) | 0 | 9.8 % |


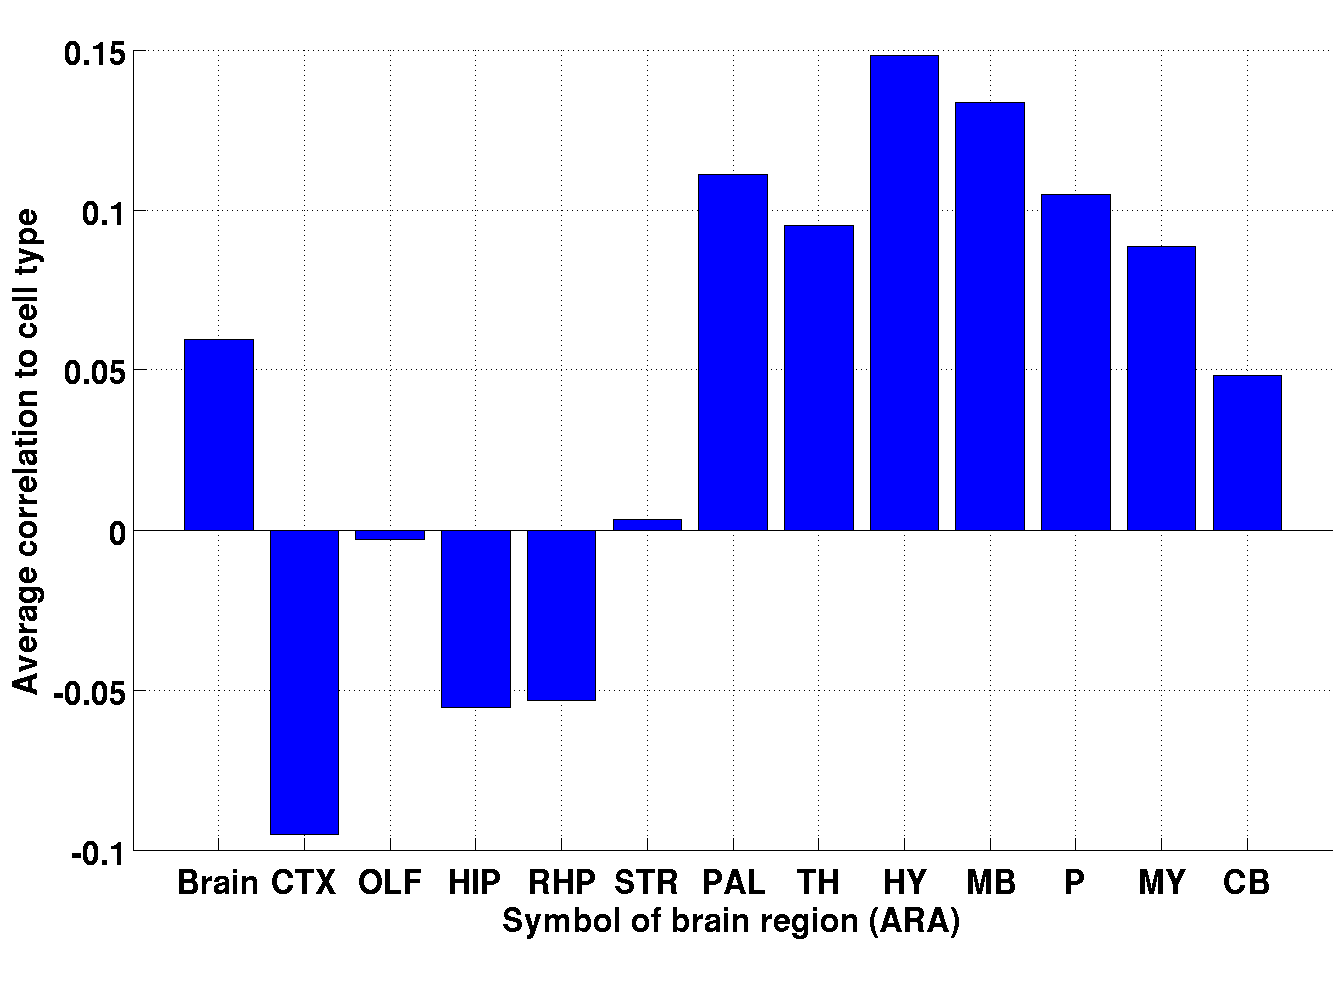
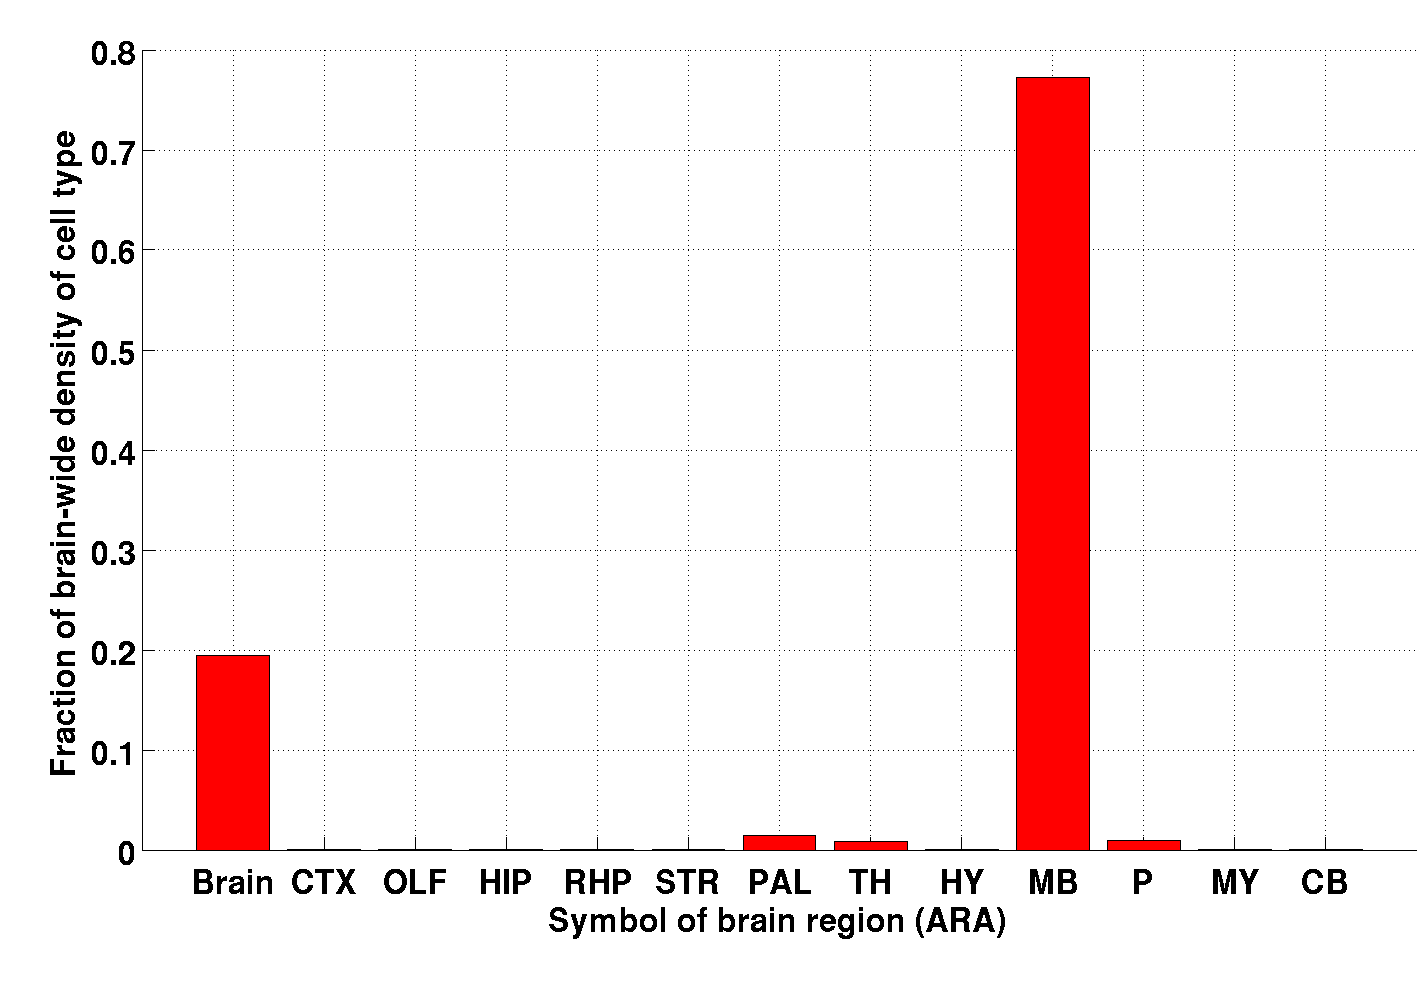
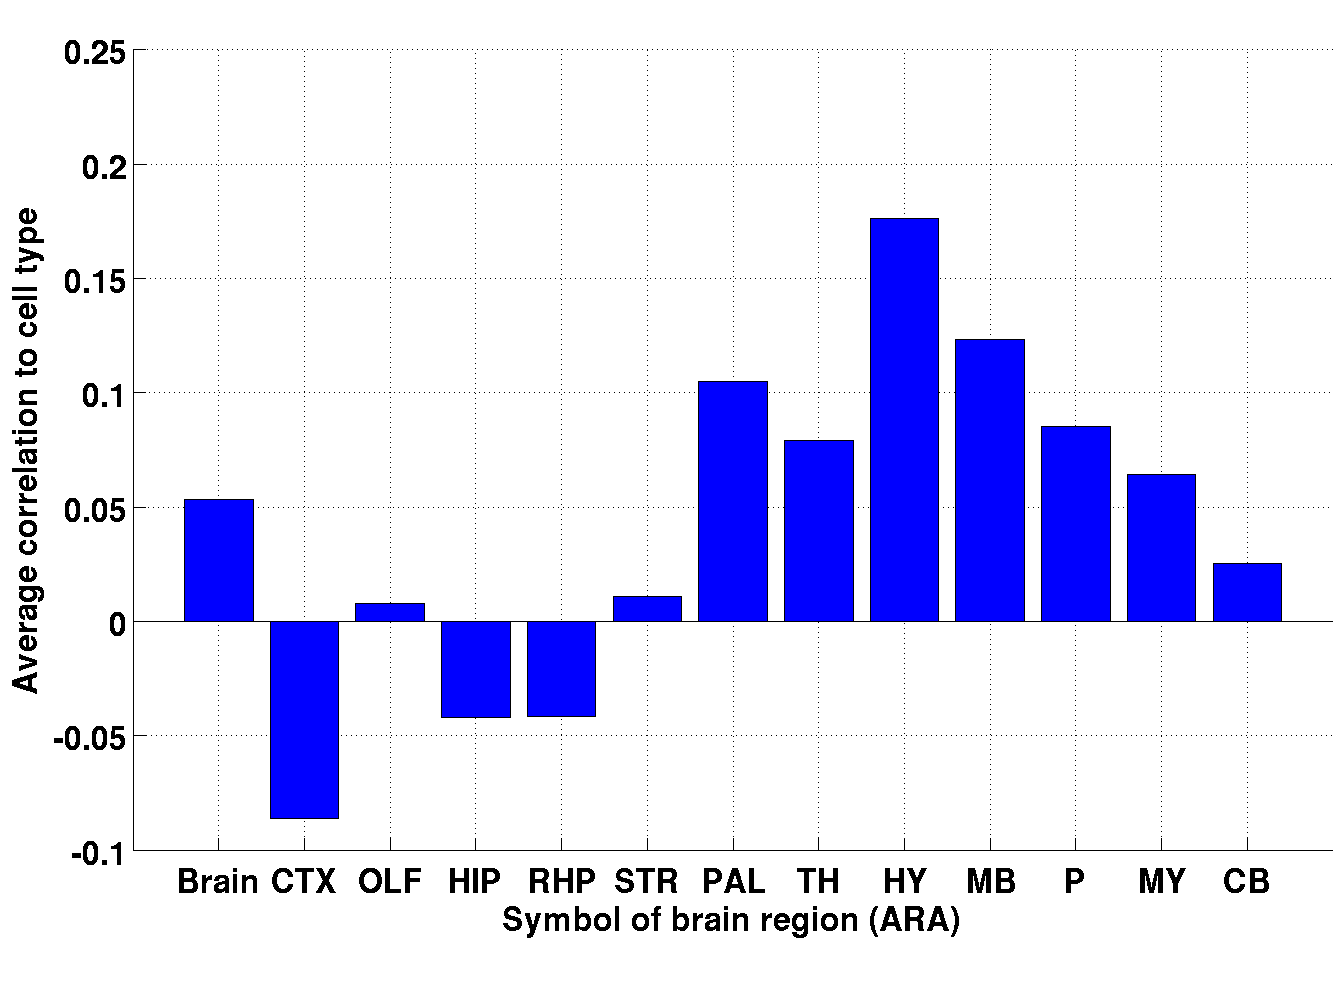
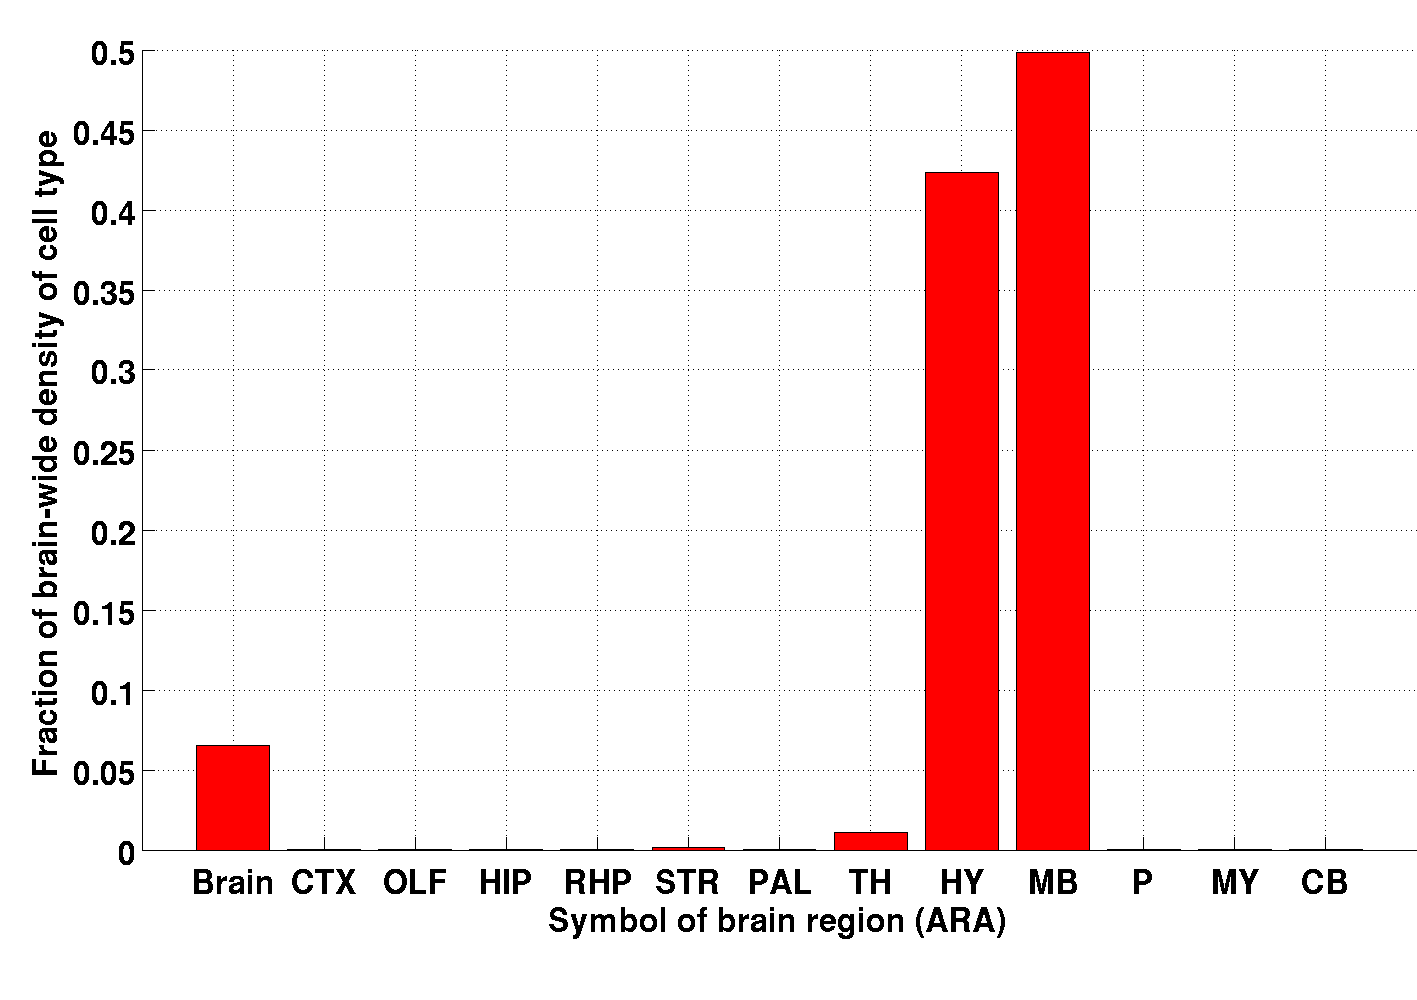
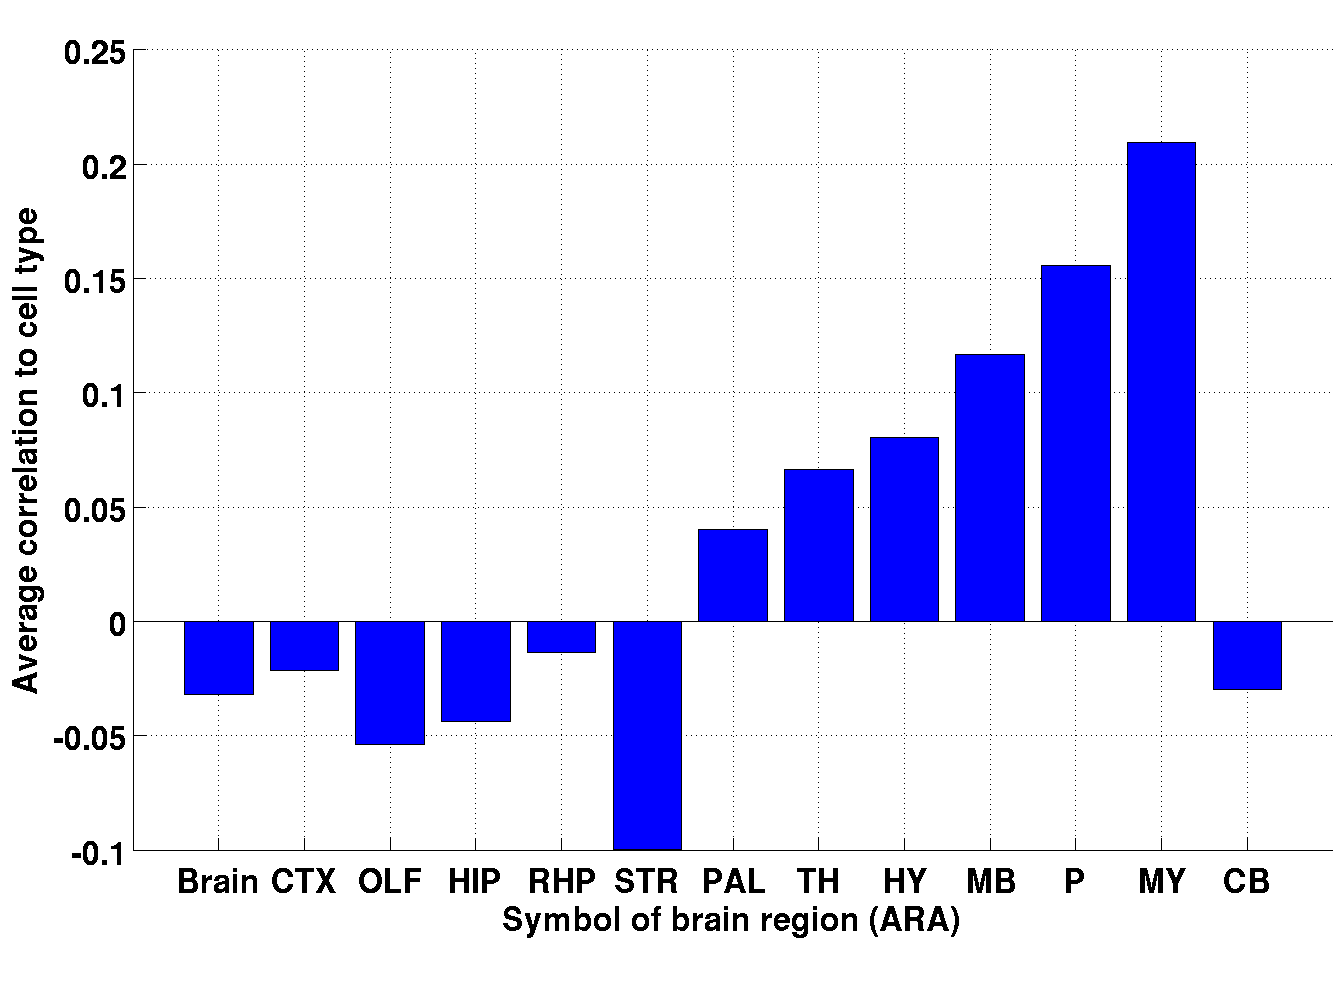
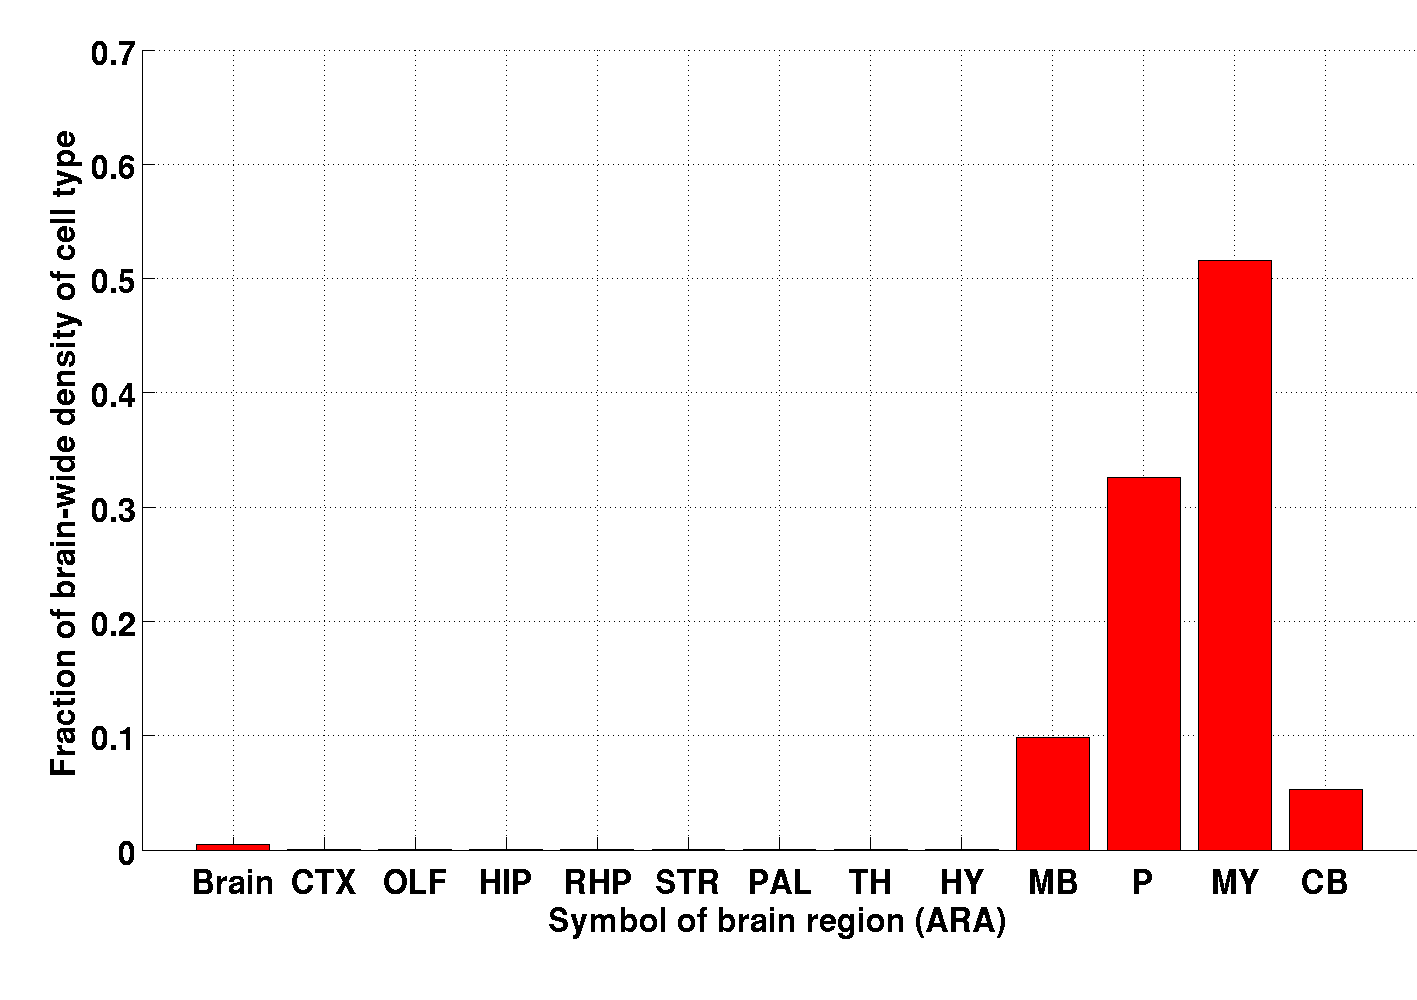
Wheras midbrain supports a majority of the density for A9 dopaminergic neurons and A10 dopaminergic neurons, it supports only 9.8% of the density in Motor Neurons, Midbrain Cholinergic Neurons (whereas medulla and pons support 32.6% and 51.6% respectively). However, it should be noted that very few cell types in our data come from medulla.
3.3.8 Pons
One cell-type-specific sample in this study was extracted from the
pons (index 51, unpublished data). According to the
’fine’ annotation, it was extracted from the pontine
central gray.
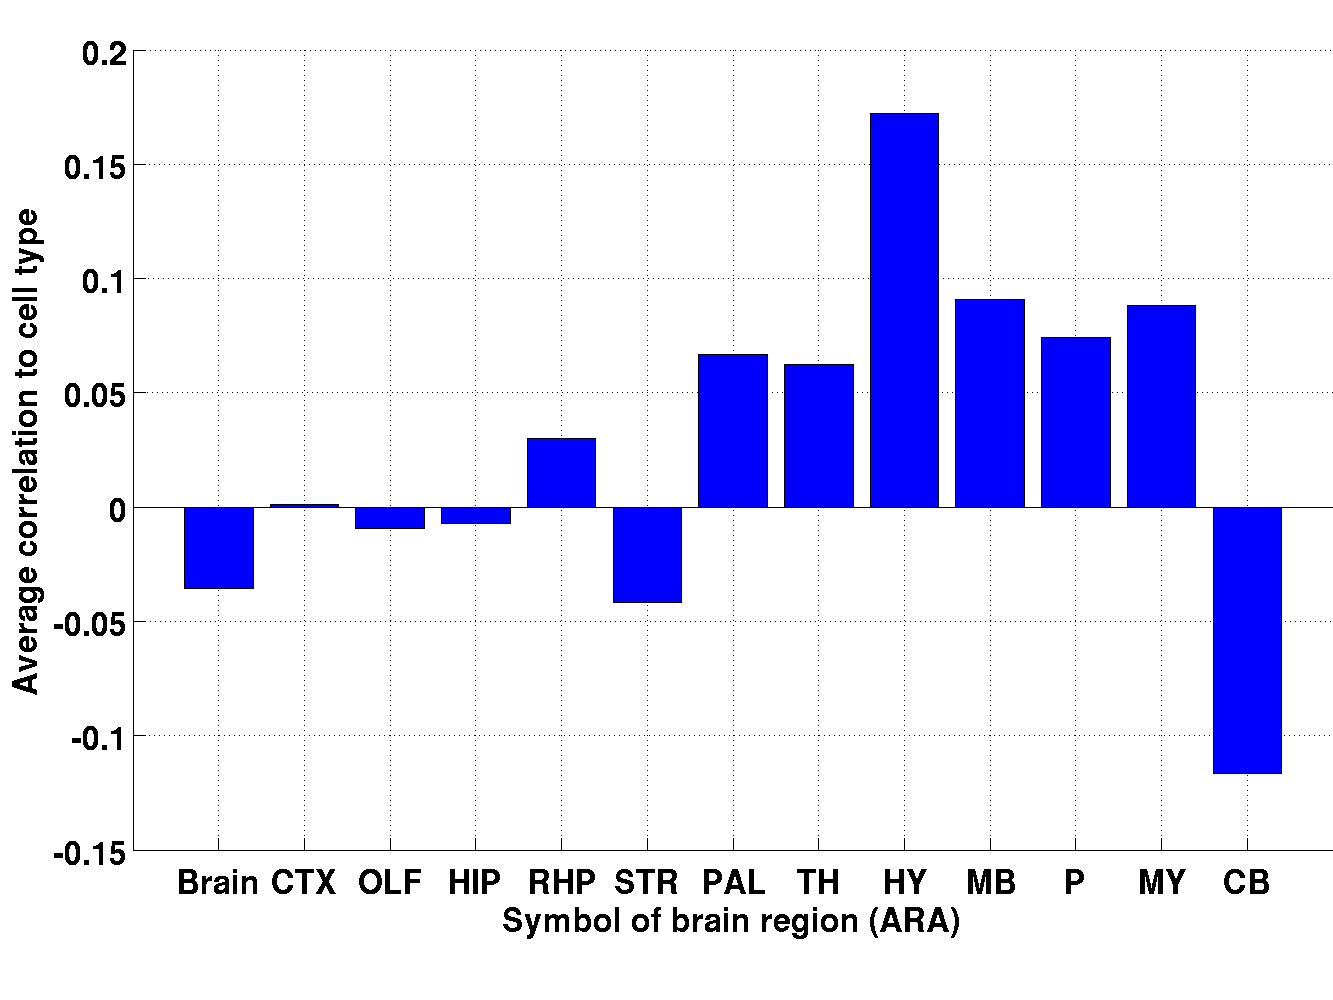
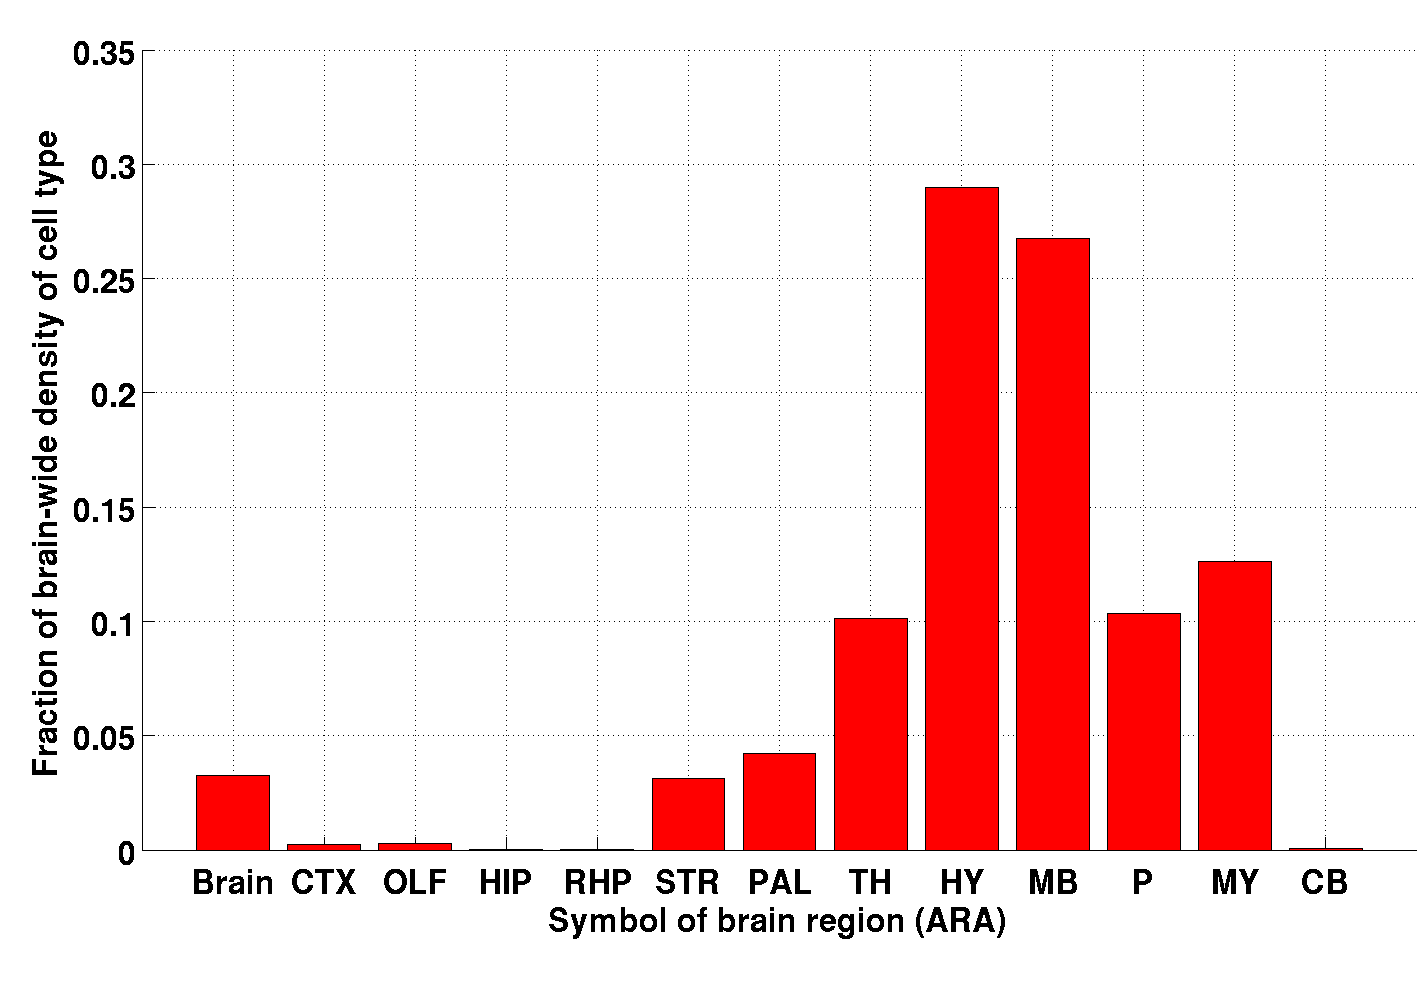
Pons is ranked 4th in the ’big12’ annotation both by
density and correlation (after hypothalamus, midbrain and medulla,
which support 28.9%, 26.7% and 12.5% of the density respectively,
whereas pons supports 10.4% of the density for this cell type). The
pontine central gray is ranked 26th out of 94 regions in the fine
annotation. The fraction of the total estimated density of this cell
type cumulated by the first 26 regions in the fine annotation is
81.9%.
Conversely, this cell type is the second most important
detected in the pons (after the GABAErgic interneurons, PV+, index
64).
| Description (index) | Origin of sample | Rank of region (out of 94) in the ’fine’ annotation (by correlation) | Rank of region (out of 94) in the ’fine’ annotation (by density) | Fraction of density in the region | Fraction of density supported in pons |
| Tyrosine Hydroxylase Expressing (51) | Pontine central gray | 9 | 26 | 1.3 % | 10.4 % |


3.3.9 Medulla
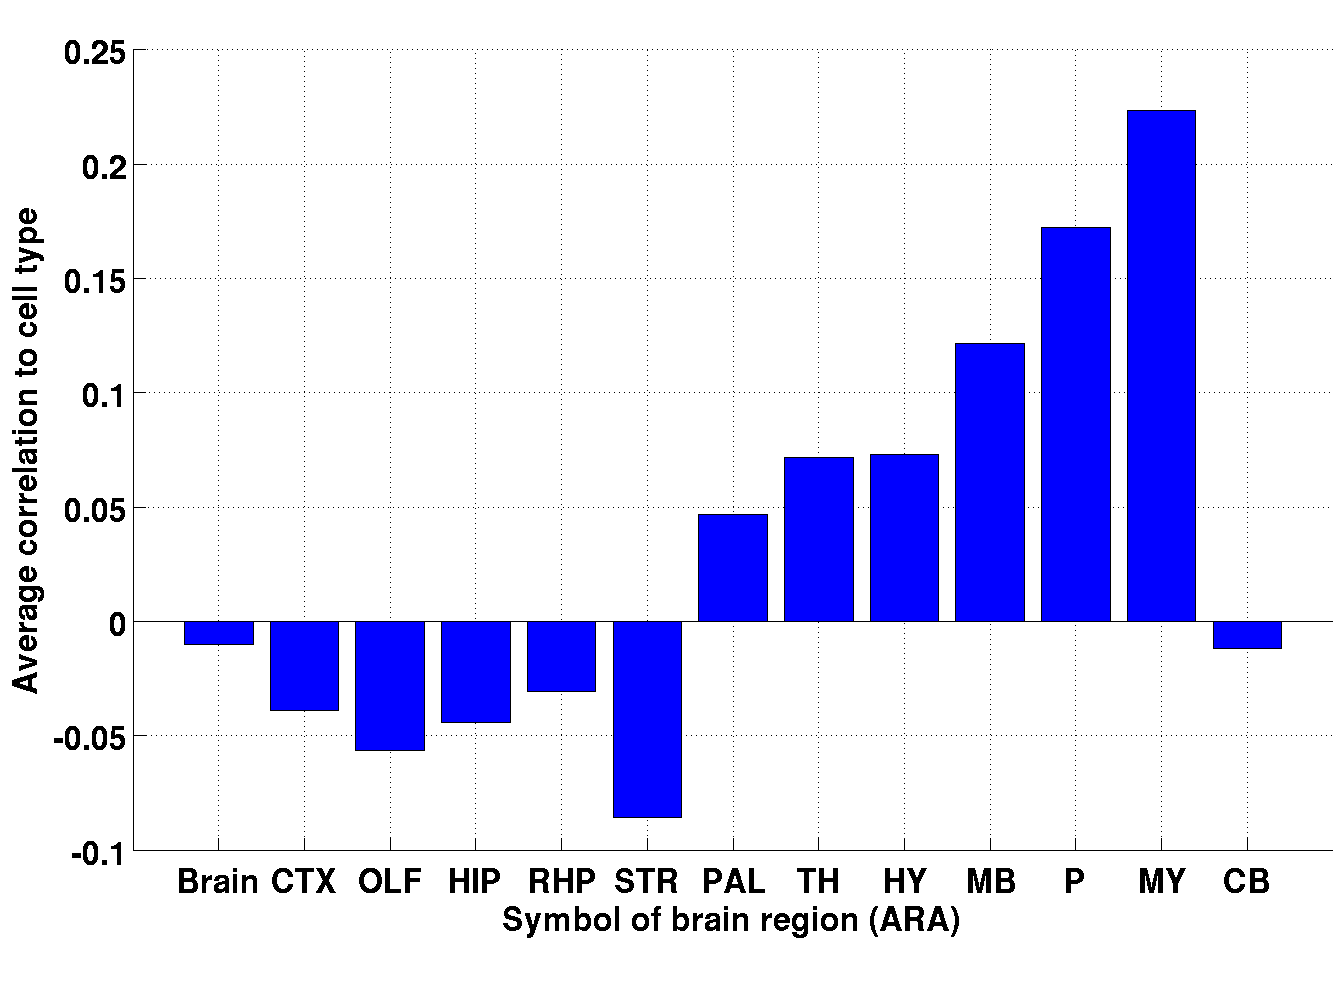
The cell-type-specific sample with index 12 (motor neurons,
cholinergic interneurons), was extracted from the spinal chord. The
closest region in ’big12’ is the medulla, which has a
refinement into 15 different regions. Medulla is indeed the top region
in the ’big12’ annotation for this cell type, both by
correlation and density (see Figures 33 and 34). The second region in ’big12’ by
density is the pons (33%), so the medulla and the
pons support more than 95% of the estimated density of this cell
type. The breakdown of the density amon the regions of the medulla
is shown in Table 16.
| Description (index) | Origin of sample | Rank of region (out of 94) in the ’fine’ annotation (by correlation) | Rank of region (out of 94) in the ’fine’ annotation (by density) | Fraction of density in the region | Fraction of density supported in the medulla |
| Motor neurons, cholinergic interneurons (12) | Medulla | 13 | 1 | 32.5 % | 62.3% |


| Brain region (in the ’fine’ annotation) | Fraction of density supported in the region (%) |
|---|---|
| Medulla | 32.5 |
| Facial motor nucleus | 6.9 |
| Vestibular nuclei | 5.5 |
| Hypoglossal nucleus | 3.6 |
| Paragigantocellular reticular nucleus | 3.3 |
| Spinal nucleus of the trigeminal_ interpolar part | 3.2 |
| Lateral reticular nucleus | 2.8 |
| Spinal nucleus of the trigeminal_ oral part | 1.8 |
| Magnocellular reticular nucleus | 1.3 |
| Cochlear nuclei | 1 |
| Medulla_ behavioral state related | 0.4 |
| Spinal nucleus of the trigeminal_ caudal part | 0.2 |
| Dorsal column nuclei | 0.2 |
| Inferior olivary complex | 0.2 |
| Nucleus of the solitary tract | 0 |
3.3.10 Cerebellum
Out of the 11 samples that were drawn from the cerebellum, 7 have the
cerebellum as their top region by correlation, and 4 have the
cerebellum as their top region by density (all of which also have the
cerebellum as their top region by correlation, see 17). All the samples that
have the cerebellum as their top region were indeed taken from the
cerebellum. See Table 3 for the Mature
oligodendrocytes (index 28), whose density profiles follows a
white-matter pattern that includes the arbor vitae.
See Figure 35 for a class of Purkinje cells
[23] and Figure 36 for a class of
mature oligodendrocytes [19], both extracted from the
cerebellum. Their correlation and estimated density patterns are
indeed mostly localized in cerebellum.
| Description (index) | Top region by correlation | Top region by density (percentage of density supported) | Fraction of density supported in the cerebellum (%) |
| Purkinje Cells (1) | Cerebellum | Cerebellum | 95.8 |
| Golgi Cells (17) | Pons | N/A() | 0 |
| Unipolar Brush cells (some Bergman Glia) (18) | Cerebellum | Thalamus | 0.2 |
| Stellate Basket Cells (19) | Cerebellum | Medulla | 18.8 |
| Granule Cells (20) | Cerebellum | Cerebellum | 96.0 |
| Mature Oligodendrocytes (21) | Cerebellum | Cerebellum | 39.9 |
| Mixed Oligodendrocytes (23) | Pons | N/A() | 0 |
| Purkinje Cells (25) | Cerebellum | Olfactory areas | 0 |
| Bergman Glia (27) | Cerebellum | Olfactory area | 5.5 |
| Purkinje Cells (52) | Cerebellum | Thalamus | 5.9 |
| Zero density in the left hemisphere. |


A remarkable class of Purkinje cells does not have the cerebellum
as its top region by density. See Figure 37 for a
class of Purkinje cells (index 52, unpublished) that correlates best
with the Allen Atlas both in the thalamus and in the cerebellum, but
that fits based on density coefficients only in the thalamus. This
indicates that thalamus must contain cell types whose gene expression
profile is closest to Purkinje cells in the present data set, but that
thalamus is not sampled in enough detail by our microarray data set for
these cell types to be distinguished from this class of Purkinje
cells.


4 Discussion of the linear model
In this section we discuss several limitations of the linear model. We
address them by refitting the linear model to a modified by panel
on cell-type-specific transcription profile:
-
•
In the first subsection we replace pairs of highly similar cell types222such as the two samples of medium spiny neurons, indices and in the original panel by one of these cell types in the fitting panel, and verify that the estimated profile of the remaining cell type is close to the sum of the two estimated profiles for the pair of cell types in the original model (while the results for other cell types are stable).
-
•
Moreover, we refit the model to a panel where the 18 transcription profiles of pyramidal neurons are replaced by one composite cell type equal to their average. The estimated density profile of the composite cell type is mostly cortical, and correlated to the sum of estimated profiles of pyramidal neurons (the rest of the results are stable).
-
•
Finally, we study the response of the estimated densities to a correction in the cell-type-specific profiles consisting of a negative term (which offsets the cross-hybridization). The top regions of most cell types do not change, which confirms the anatomical conclusions of the linear model, but the residual terms go down, suggesting that the accuracy of the model is improved when cross-hybridization is taken into account.
Refitting of the model gives rise to a new set of estimated density profiles of cell types, for in a set of cell types, some of which have corresponding entries in the original model discussed above:
| (15) |
If a cell type labeled is present in both panels, we can compare the results of the two models quantitatively by computing the correlation coefficient between the two brain-wide density profiles labeled and in the respective models:
| (16) |
where the overlined quantities are cell-type-specific densities averaged over voxels:
| (17) |
To study the anatomical properties of the results in a refitted model, we can compute the average density in each brain region labeled :
| (18) |
and check for a cell type labeled if the region with the maximum value of is identical to the one induced by . The top region is the one that is selected to choose the section when plotting the heat maps of the brain-wide density profile. It can therefore be read off when plotting the densities and side by side.
4.1 Competition between pairs of similar cell types
4.1.1 Methods
As can be expected from the names of the cell types in this study (see Tables 62, 63), some pairs of cell-type-specific transcription profiles can be very close to each other. This can lead to uniqueness problems in the predicted densities. Indeed, in aa situation where two rows, labeled say and of the matrix are identical, there is a one-parameter family of solutions to the optimization problem for the brain-wide densities of the two corresponding cell types:
| (19) | ||||
The transfer of any positive amount of signal between the
two cell types at any voxel does not change the value
of the sum (the density profiles of the two types
are anti-correlated across the family of solutions).
We looked for families of cell-type-specific samples that are very similar to each other. We computed the pairwise type-by-type correlation matrix between centered cell-type specific transcription profiles:
| (20) |
The closer the entry is to 1, the more similar the two cell types and are. We applied the thresholding procedure that was used for co-expression matrices of genes in the brain in [31]. For each value of in the interval , a threshold can be applied to the matrix by putting to zero all entries lower than :
| (21) |
Applying Tarjan’s algorithm
[Tarjan] to the thresholded matrix produces a partition
of the cell types into strongly connected components at this value
of the threshold. At , all the cell types are disconnected (unless
there are cell types with exactly the same value
for all genes, which is not the case in our data set). At ,
there is only one connected component, and all cell types
are connected. When decreases from to , the
more similar cell types group into connected components.
We are interested in pairs of cell types that
are connected at high values of and do no not connect
with other cell types
for the lowest possible value of ,
when is decreased (such cell types labeled and are the closest
pairs of cell types to the degenerate situation described by Equation 4.1.1.
Consider a pair of indices singled out by the above analysis.
Let us introduce the notation for the type-by-gene
matrix obtained from by leaving the -th row out,
we computed the corresponding density profiles
denoted by and :
| (22) |
| (23) |
Intuitively, refitting the model with just one of the two similar types present ( or )should result in the remaining cell type inheriting the sum of the two density profiles estimated in the original model:
| (24) |
| (25) |
The profiles of the other cell types are expected to be stable:
| (26) |
| (27) |
To test this idea for each pair of cell types singled out by the analysis of pairwise similarities, we computed the type-by-type matrices (of size by , so that they can be plotted as heat maps and compared more easily to the original by matrix of pairwise correlations between density profiles in the original model:
| (28) | ||||
| (29) | ||||
| (30) |
| (31) | ||||
| (32) | ||||
| (33) |
The matrices and should have (apart from a “cross” of zeroes at the row and column indices and respectively) omitted from the new fitting panel, a diagonal of high correlation coefficients, and off-diagonal terms that should be close to the off-diagonal terms of the type-by-type matrix of correlations between cell types in the original model defined as follows:
| (34) |
The matrix is symmetric and has its diagonal entries all equal 1 by construction.
4.1.2 Results
The pairs of cell types singled out by the above-described
analysis are the following:
indices , which are both medium spiny neurons (Drd1+ and Drd2+ respectively),
indices , which are both dopaminergic neurons (A9 and A10 respectively),
indices , which are both pyramidal neurons (but are not detected by the
model except at a few voxels in the olfactory bulb).
-
•
The pair of medium spiny neurons (labeled by indices and ). Having computed the refitted profiles and , which contain one medium spiny neurons instead of two, we can plot the density profiles oh the remaining medium spiny neurons in each of the refitted models ( and , Figures 38(b) and 38(c) respectively), as well as the sum of the densities of the two samples of medium spiny neurons in the original model (i.e. , Figure 38(c)). The three plots are hard to distinguish from each other by eye (see Figure 38) and present the same characteristic concentration of signal in the striatum. This supports the conjectures 24 and 24, as each of the medium spiny neurons seems to inherit the signal of the pair labeled by indices and when the model is refitted, without picking up any significant other signal.
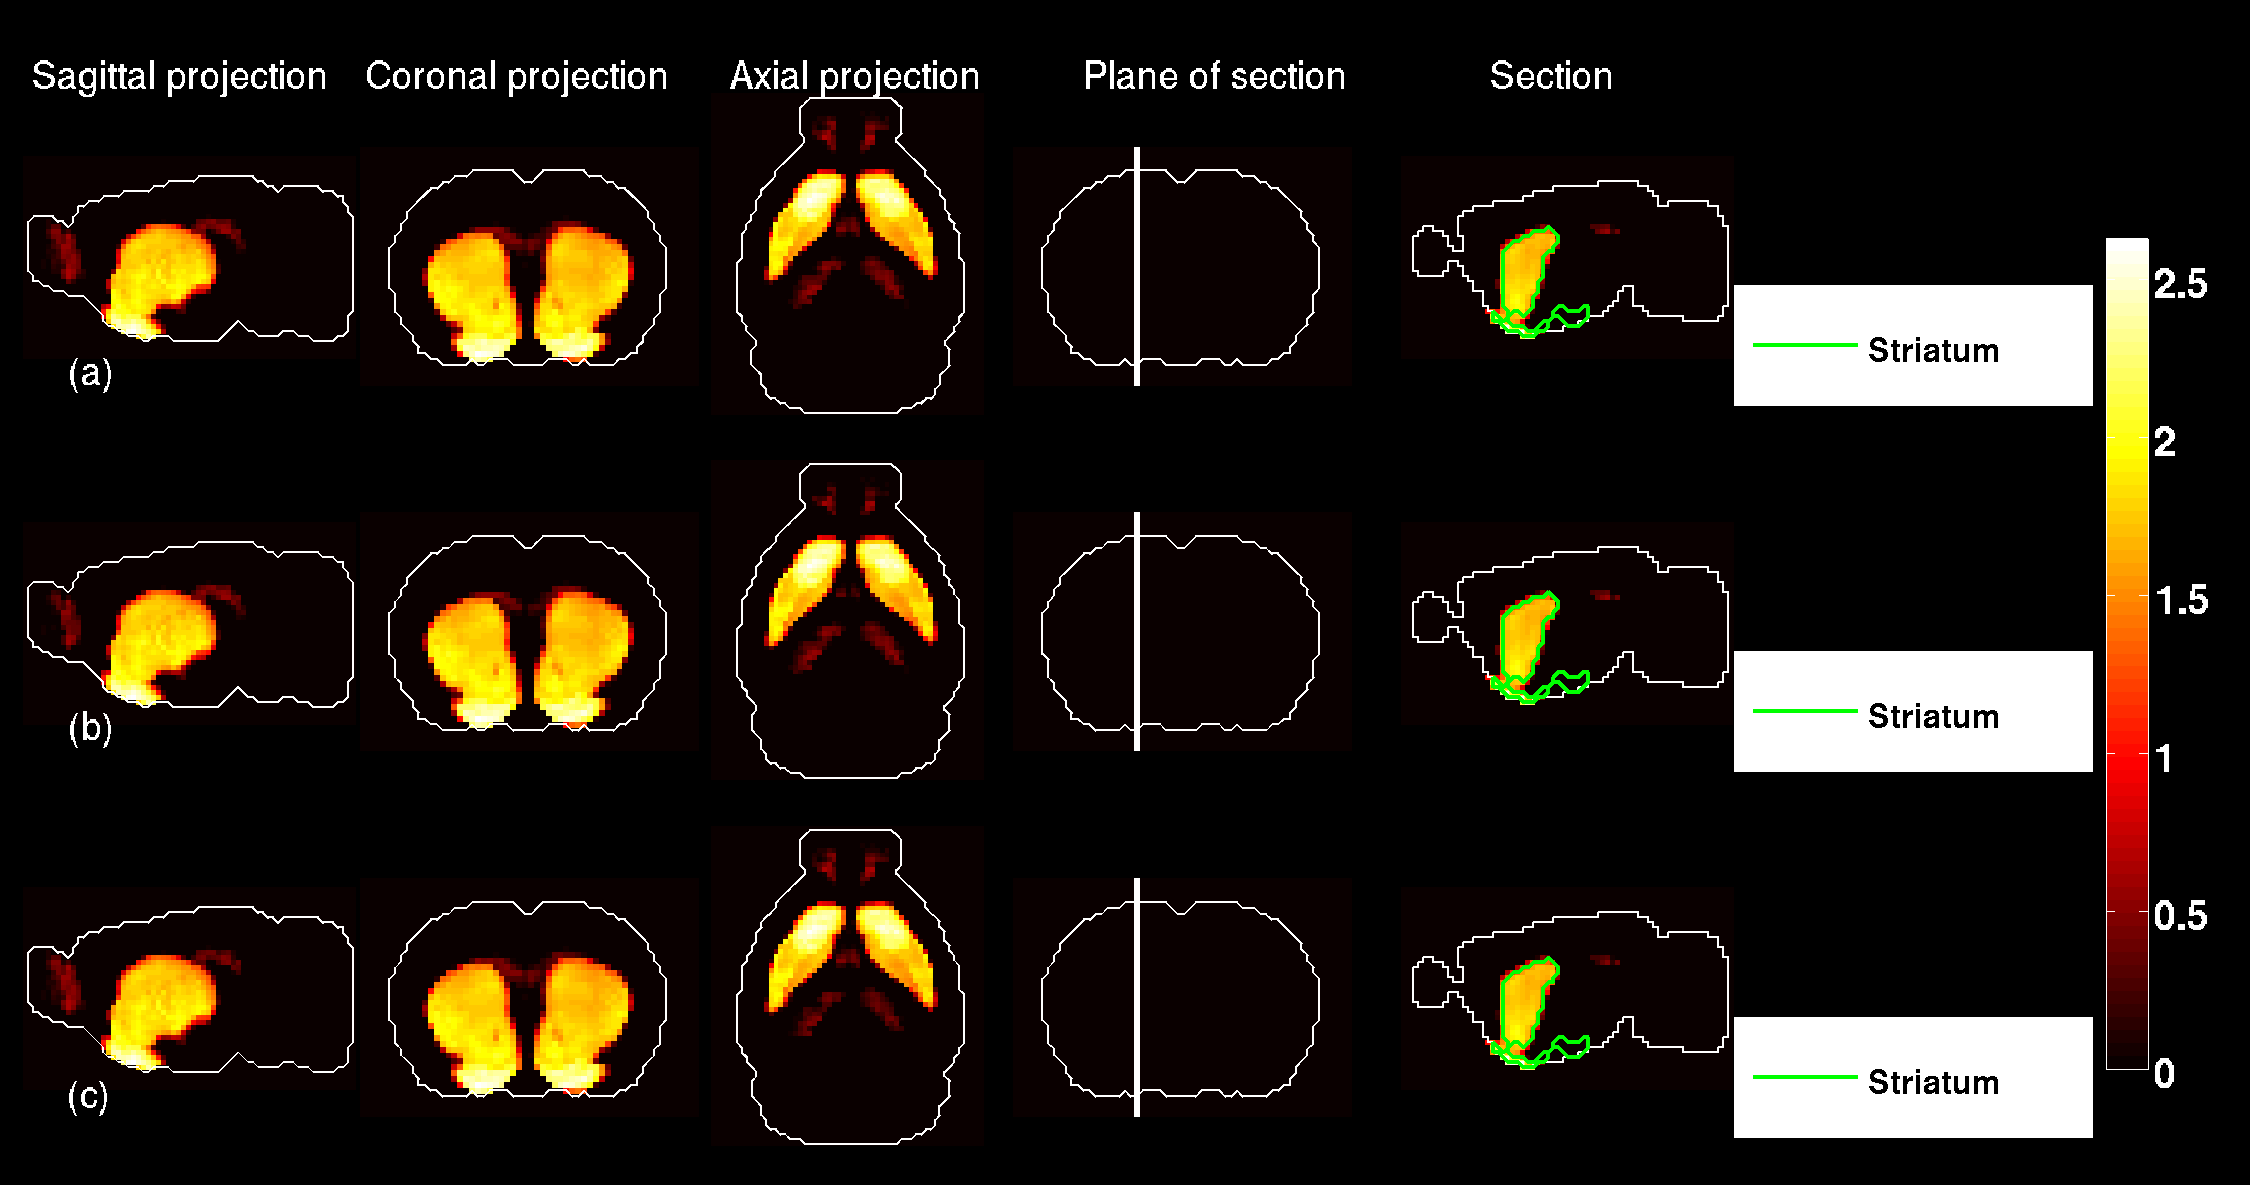
Figure 38: Medium spiny neurons are labeled by indices and in the origional fitting panel. (a) Heat map of the sum of estimated brain-wide densities in the original model, . (b) Heat map of , the density of cell type when cell type is omitted from the fitting panel; it is much closer to the sum than to the rather sparse profile . (c) Heat map of , the density of cell type when cell type is omitted from the fitting panel. The three profiles are very close to each other by eye, consistently with the conjectures of Equations 24 and 24. Computing the correlation matrices and and reading off the entries
(35) confirms the visual impression of Figure 38, due to definitions 30 and 33.
Moreover, plotting the matrices and as heat maps (Figures 39b and Figures 39c) shows that the entries are roughly symmetric, and that the two matrices resemble the type-by-type matrix of of pairwise correlations in the original model (Figure 39a ), apart from the “cross” of zeroes at the omitted indices (row 15 and column 15 on Figure 39b, row 16 and column 16 on Figure 39c). Moreover, the diagonal coefficients of and are visibly close to 1 (their sorted values are plotted on Figure 40), with the exception of the cholinergic projection neurons (labeled ), whose density profile has only a 0.133 correlation coefficient with . However, this cell type has very little signal in any of the models ( has only 7 voxels with positive density, has 8 and has 7), and these three profiles all represent less than times the sum of all the densities in the respective models:
(36) The low value of the correlation for cell-type index 11 is therefore compatible with the claim that density profiles are generally stable when replacing the pair of medium spiny neurons by just one of them, and that the remaining medium spiny neuron in the fitting panel inherits the sum of the density profiles predicted in the original model.
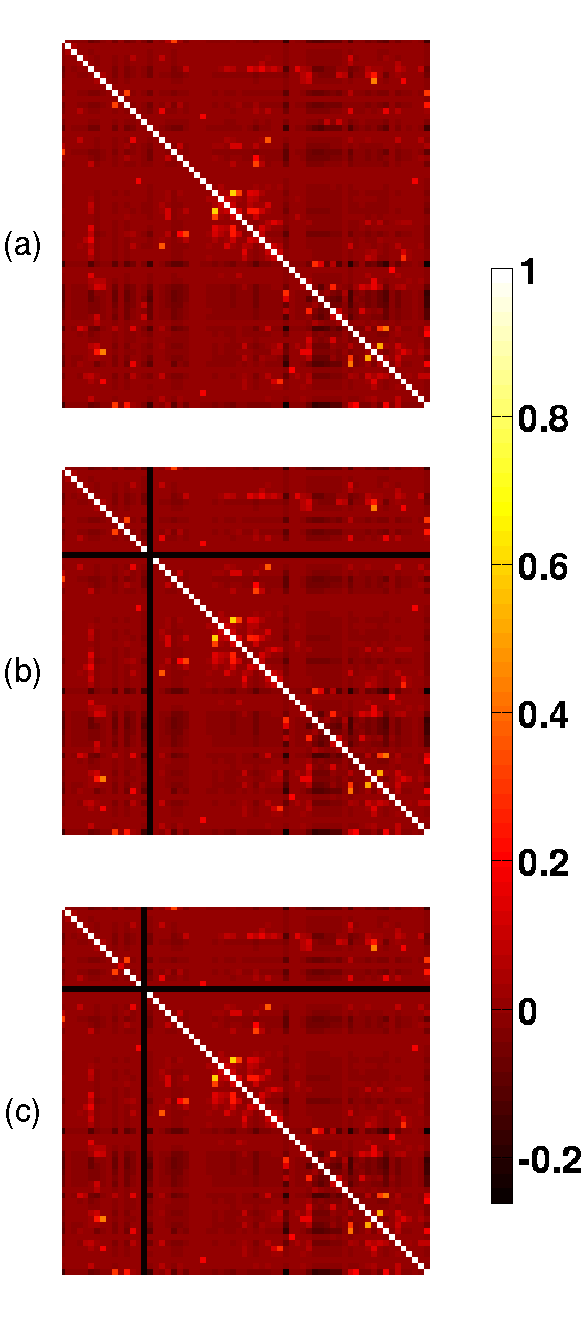
Figure 39: Heat maps of the type-by-type matrices of pairwise correlations between density profiles. (a) Using density profiles in the original model, or , Equation 34. (b) Using density profiles from the model using only medium spiny neuron labeled 16, and densities from the original model, except at column 16 where the sum is used (see Equation 30). (c) Using density profiles from the model using only medium spiny neuron labeled 15, and densities from the original model, except at column 15 where the sum is used (see Equation 33). The three matrices look similar (apart from the zeroes at row and column indices 15 and 16 on (b) and (c) respectively). This suggests that the results of the model are stable upon using one sample of medium spiny neuron instead of two. 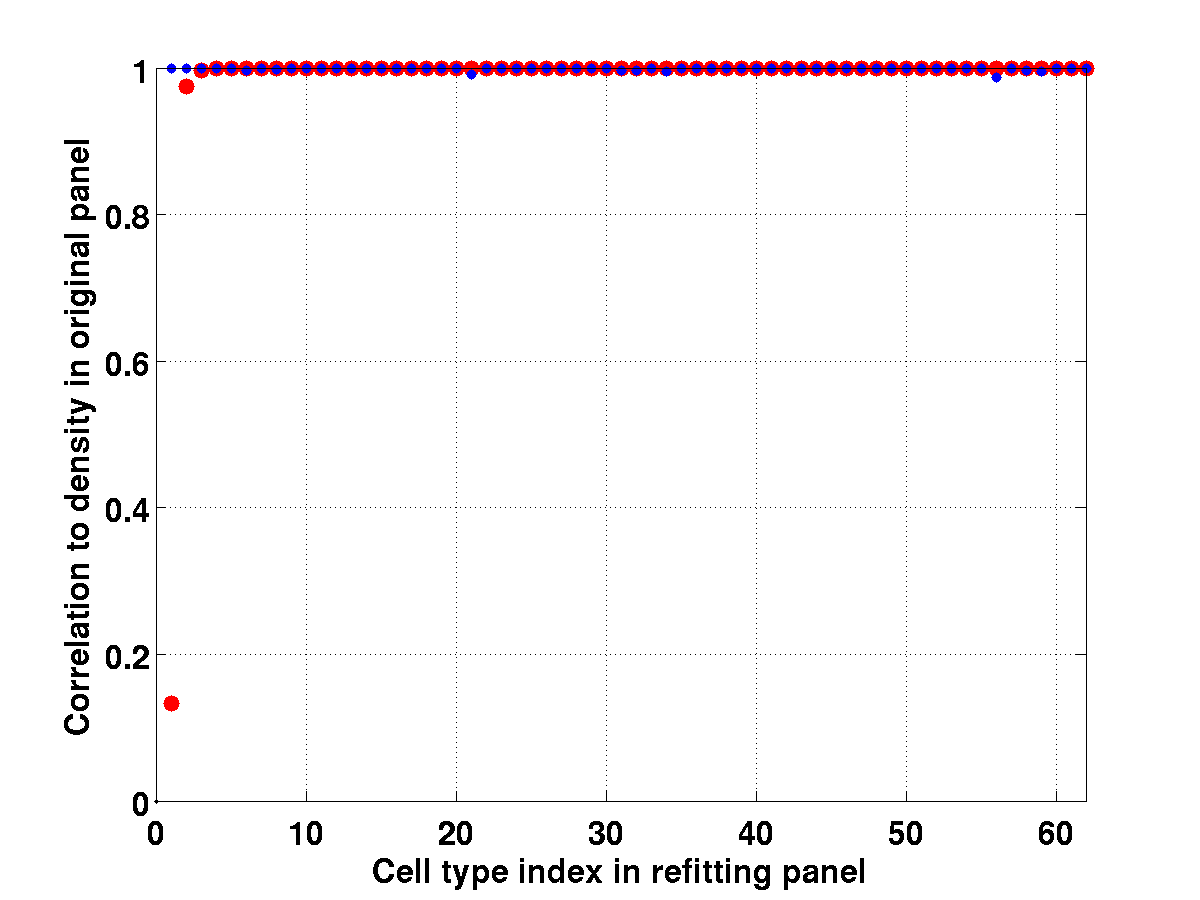
Figure 40: Sorted diagonal elements of the type-by-type correlation matrix (in red), and (in blue, plotted in the same order as the diagonal coefficients of ). All diagonal entries of and are above , except the entry of corresponding to index 11 (cholinergic projection neurons), but this cell type has very low density in all three models , , . -
•
The pair (A9 dopaminergic neurons, A10 dopaminergic neurons) labeled by indices and . We computed the refitted profiles and , which contain one sample of dopaminergic neurons instead of two. Again we can plot the density profiles of the remaining dopaminergic neuron in each of the refitted models ( and , Figures 41(b) and 41(c) respectively), as well as the sum of the densities of A9 dopaminergic neurons and A10 dopaminergic neurons in the original model (i.e. , Figure 41(c)). The three plots show the highest fraction of their signal in the midbrain (hence the sections through mibrain in all three rows of Figure 41). generally speaking they look quite similar. Again this supports the conjectures 24 and 24, in the case of and .
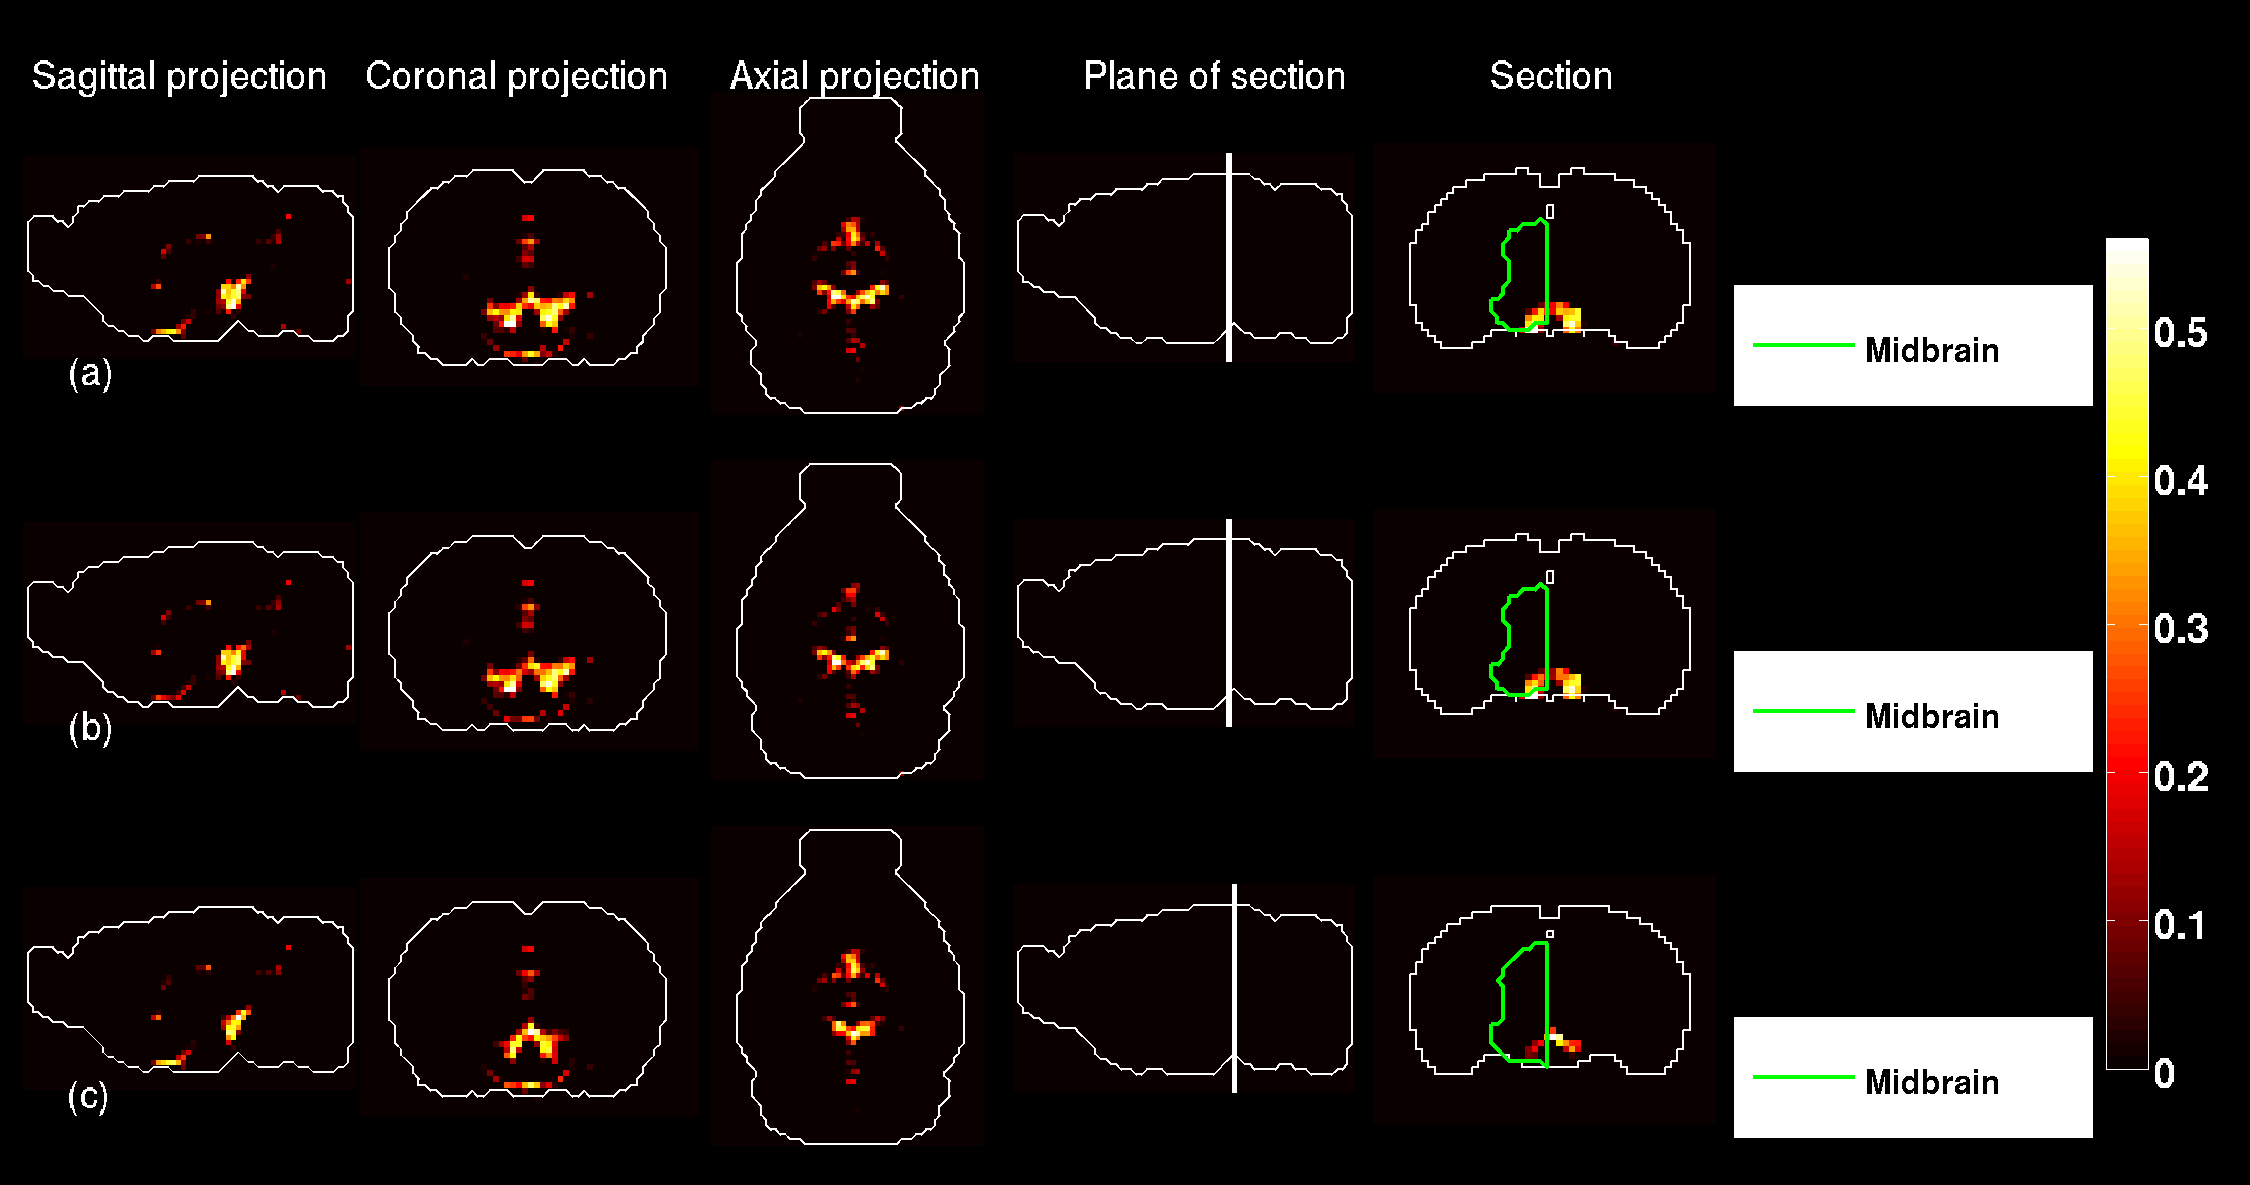
Figure 41: A9 dopaminergic neurons and A10 dopaminergic neurons are labeled by indices and in the origional fitting panel. (a) Heat map of the sum of estimated brain-wide densities in the original model, . (b) Heat map of , the density of cell type when cell type is omitted from the fitting panel. (c) Heat map of , the density of cell type when cell type is omitted from the fitting panel. The three profiles are very close to each other by eye, consistently with the conjectures of Equations 24 and 24. Computing the correlation matrices and and reading off the entries The correlations conjectured in Equations 30 and 33 are less close to 1 than in the case of medium spiny neurons, but still
(37) and one can check that in each of the two refitted models, the sum of profiles has higher correlation with the remaining dopaminergic neurons than any cell type in the original fitting panel:
(38) As in the case of medium spiny neurons, plotting the matrices and as heat maps (Figures 42b and Figures 42c) shows that the entries are roughly symmetric, and that the two matrices resemble the type-by-type matrix of of pairwise correlations in the original model (Figure 42a ), apart from the “crosses” of zeroes (at row 4 and column 15 on Figure 42b, row 16 and column 16 on Figure 42c). Moreover, the diagonal coefficients of and are all close to 1 (their sorted values are plotted on Figure 43). Again we conclude that refitting the model to a fitting panel containing one dopaminergic neuron instead of two leads to stable density profile, with the remaining dopaminergic neuron inheriting most of the sum of the two original density profiles and .
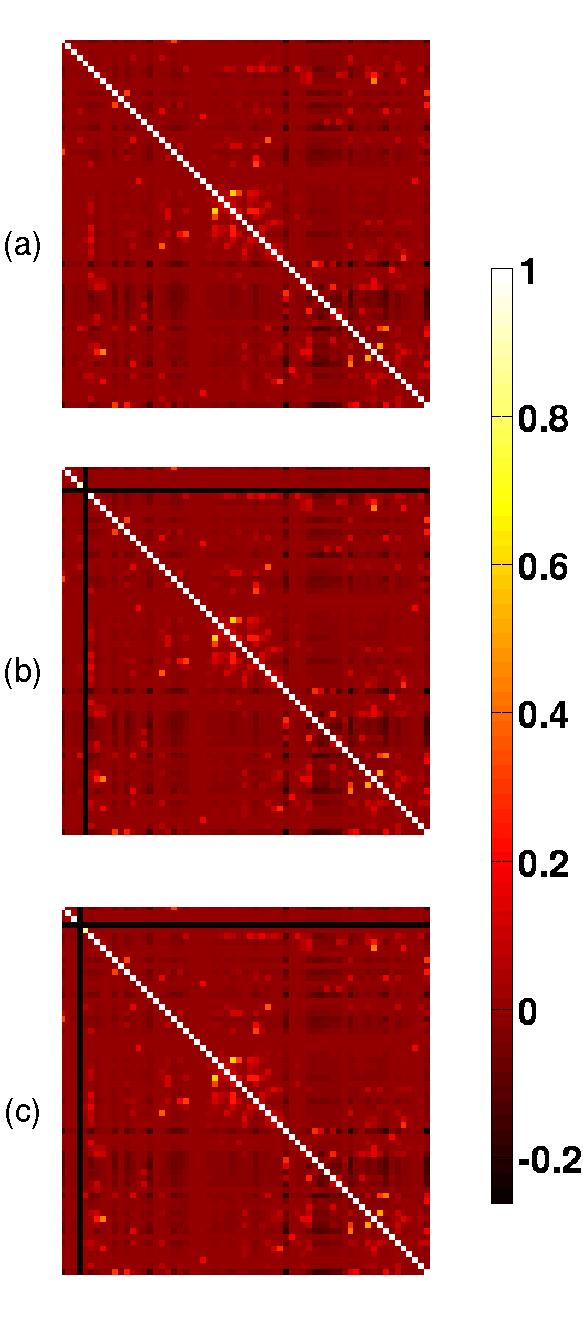
Figure 42: Heat maps of the type-by-type matrices of pairwise correlations between density profiles, for and . (a) The matrix computed using density profiles in the original model, or , Equation 34. (b) Using density profiles from the model using only A10 dopaminergic neurons, labeled , and densities from the original model, except at column 5 where the sum is used (see Equation 30). (c) Using density profiles from the model using only A10 dopaminergic neurons, labeled , and densities from the original model, except at column 4 where the sum is used (see Equation 33). The three matrices look similar (apart from the zeroes at row and column indices 4 and 5 on (b) and (c) respectively). This suggests that the results of the model are stable upon using either sample of dopaminergic neurons, instead of both of them. 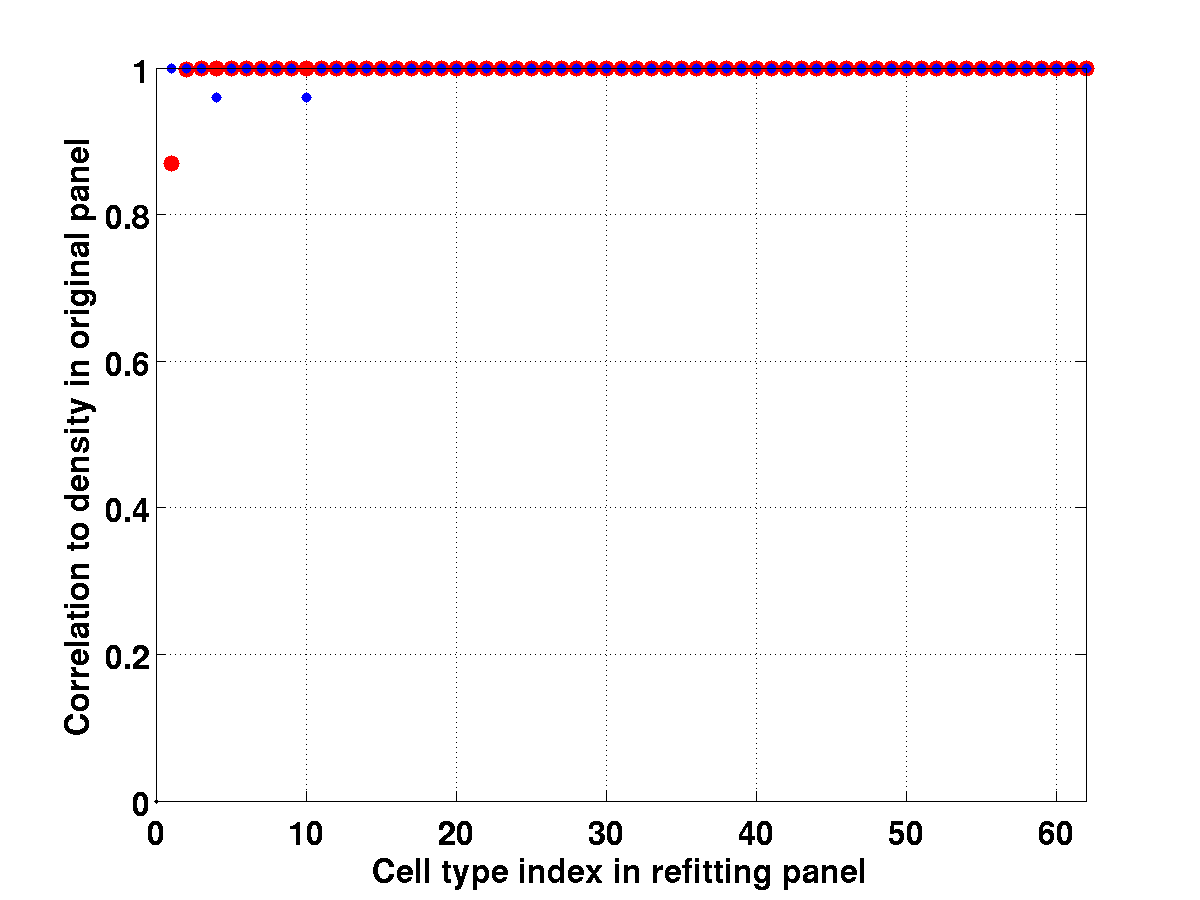
Figure 43: Sorted diagonal elements of the type-by-type correlation matrix (in red), and (in blue, plotted in the same order as the diagonal coefficients of ). -
•
The pair of pyramidal neurons labeled by indices and . We computed the refitted densities and and repeated the above analysis. Figures 45, 46 and 44 confirm conjectures 24 and 24. However, they are included mostly for completeness, as the estimated densities of these two pyramidal neurons are very low in the original model (only 52 voxels , about 1 in 1000, have a positive density in the sum ). They stay low in the refitted model ( has only 49 voxels with non-zero density and only 44). The high diagonal correlation coefficients of Figure 46 show that the rest of the estimated densities hardly change when refitting.
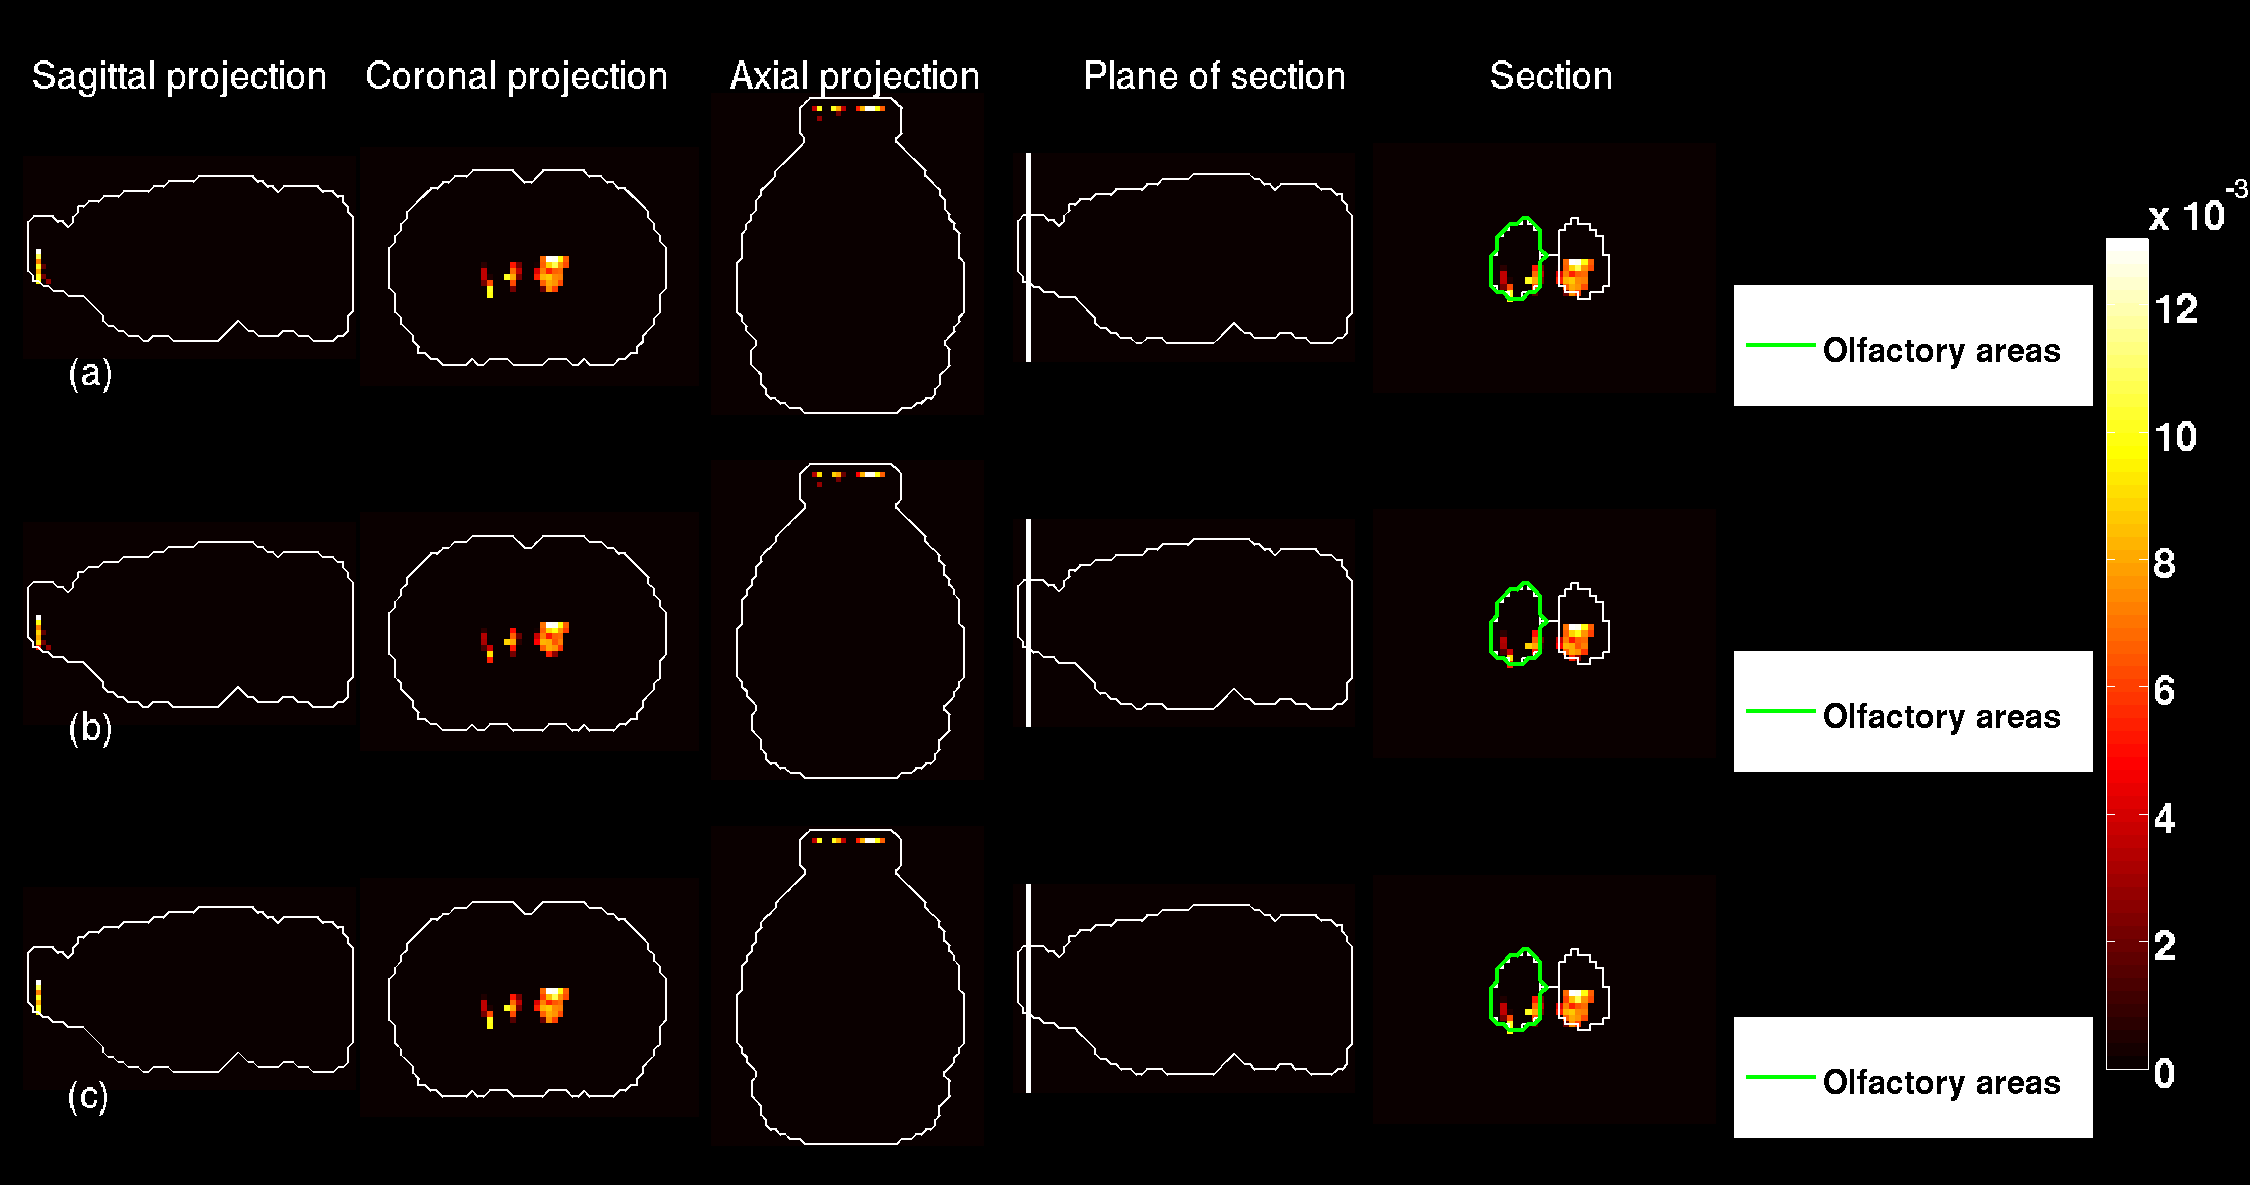
Figure 44: The pair of pyramidal neurons labeled by indices and in the origional fitting panel. (a) Heat map of the sum of estimated brain-wide densities in the original model, . (b) Heat map of , the density of cell type when cell type is omitted from the fitting panel; it is much closer to the sum than to the rather sparse profile . (c) Heat map of , the density of cell type when cell type is omitted from the fitting panel. The three profiles are very close to each other by eye, consistently with the conjectures of Equations 24 and 24. 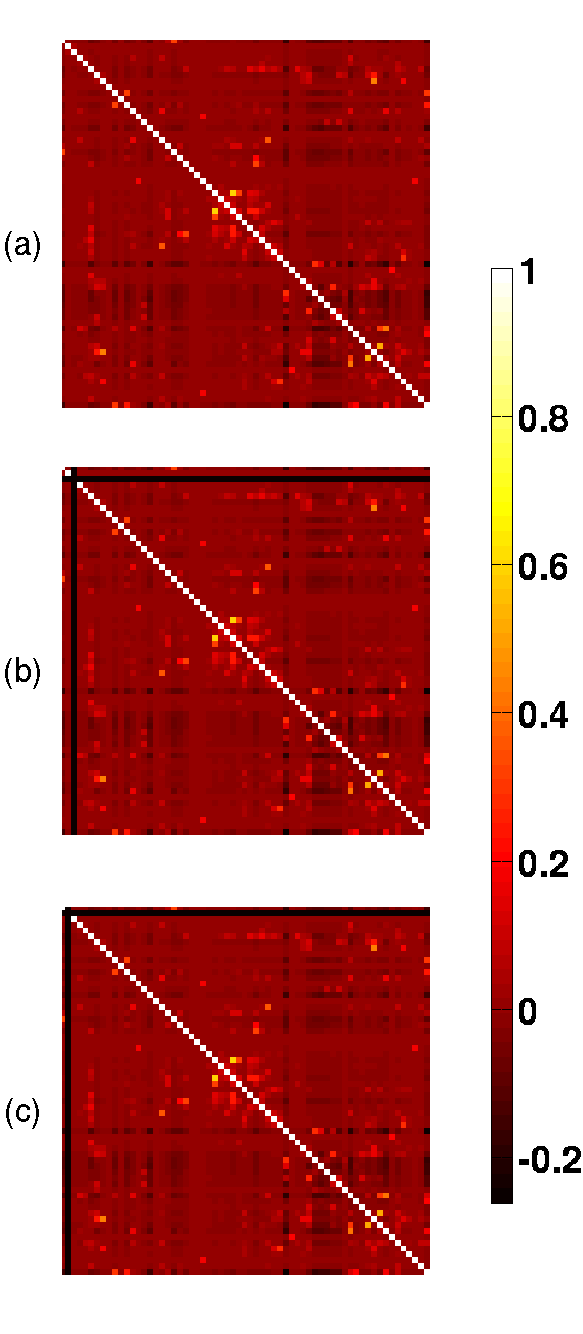
Figure 45: Heat maps of the type-by-type matrices of pairwise correlations between density profiles, for and . (a) The matrix computed using density profiles in the original model, or , Equation 34. (b) Using density profiles from the model using only the cell type labeled (instead of and ), and densities from the original model, except at column 3 where the sum is used (see Equation 30). (c) Using density profiles from the model using only the cell type labeled labeled (instead of and ), and densities from the original model, except at column 2 where the sum is used (see Equation 33). The three matrices look similar (apart from the zeroes at row and column indices 2 and 3 on (b) and (c) respectively). This suggests that the results of the model are stable upon using either of the cell types labels , instead of both of them. 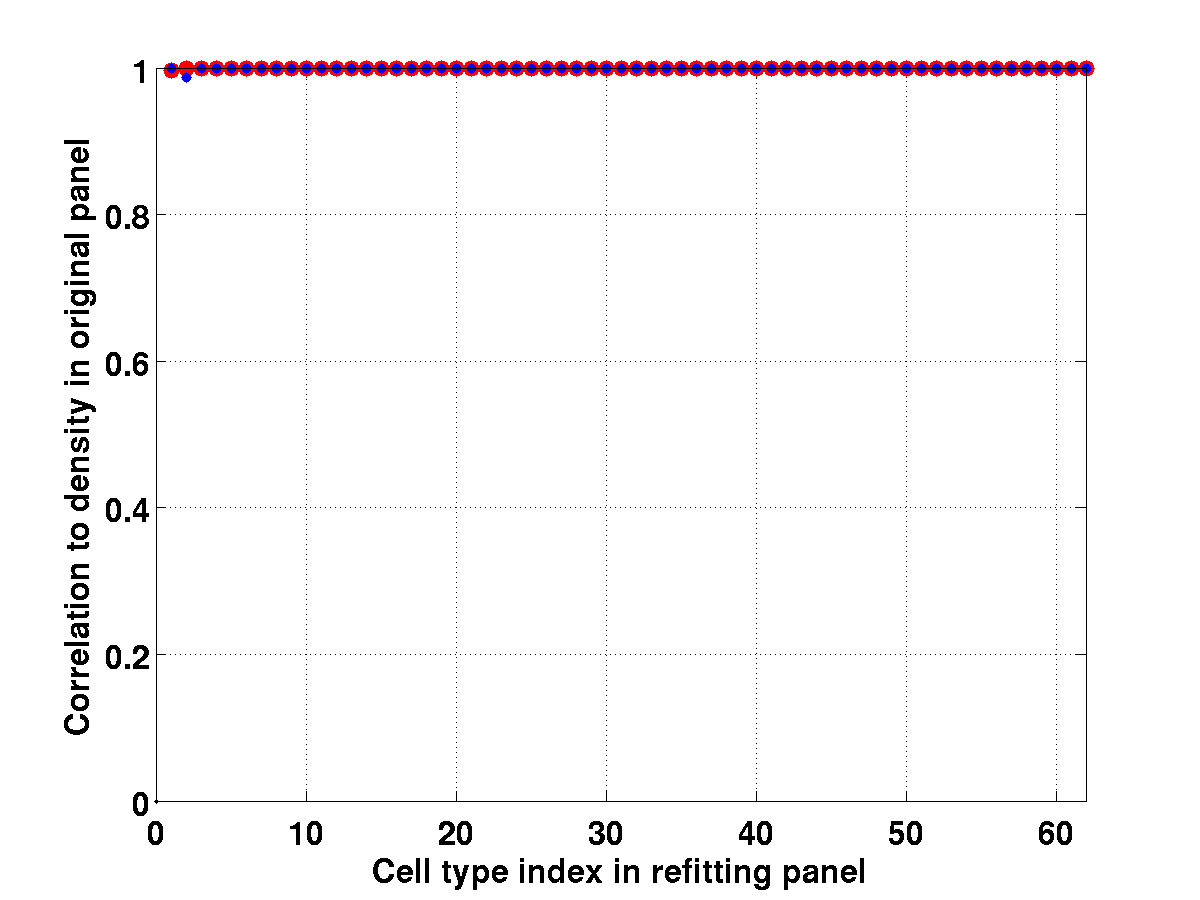
Figure 46: Sorted diagonal elements of the type-by-type correlation matrix (in red), and (in blue, plotted in the same order as the diagonal coefficients of ).
4.2 The set of pyramidal neurons
The previous subsection dealt with pairs of indices identified
computationally for their strong similarity to each other, as well
as dissimilarity with the rest of the fitting panel (they happened
to have similar names in the taxonomy of cell types).
In this section we refit the model based on a choice made using
the names of the cell-type-specific samples: we group together
the largest set of cell types with similar names (pyramidal neurons),
and replace them with a composite cell type made of the
average transcription profiles of all pyramidal neurons
in the data set.
We combined all the transcriptomic profiles
of pyramidal neurons into their average:
| (39) |
where are the indices of the cell types labeled
as pyramidal neurons.
We refitted the model to a set of cell types consisting of
this composite pyramidal cell type with the data of the non-pyramidal
cell types concatenated with the data in .
More precisely, let us rewrite the new fitting panel as a matrix of size by concatenating and the rows of corresponding to non-pyramidal indices. Let be the indices of the non-pyramidal cell types (row indices of ), where is the number of non-pyramidal cell types (i.e. for all in , is the transcription profile of a non-pyramidal cell):
| (40) | ||||
| (41) |
The brain-wide density profile is the refitted profile, denoted by
, are the solutions of the usual optimization problems at
each voxel:
| (42) |
There are fewer degrees of freedom in the optimization problem 42 than in the original model, so the fitting is expected to be less accurate, but one can ask how correlated the density of the composite pyramidal neuron is to the sum of the density profiles of all the pyramidal neurons in the original model.
Let us denote by the sum of the density profiles of all the pyramidal cells in the original model:
| (43) |
The natural matrix of correlations to compute is the following:
| (44) | ||||
| (45) | ||||
| (46) | ||||
| (47) |
which is expected to be close to the following by matrix based on the profiles of the original model only:
| (48) | ||||
| (49) | ||||
| (50) |
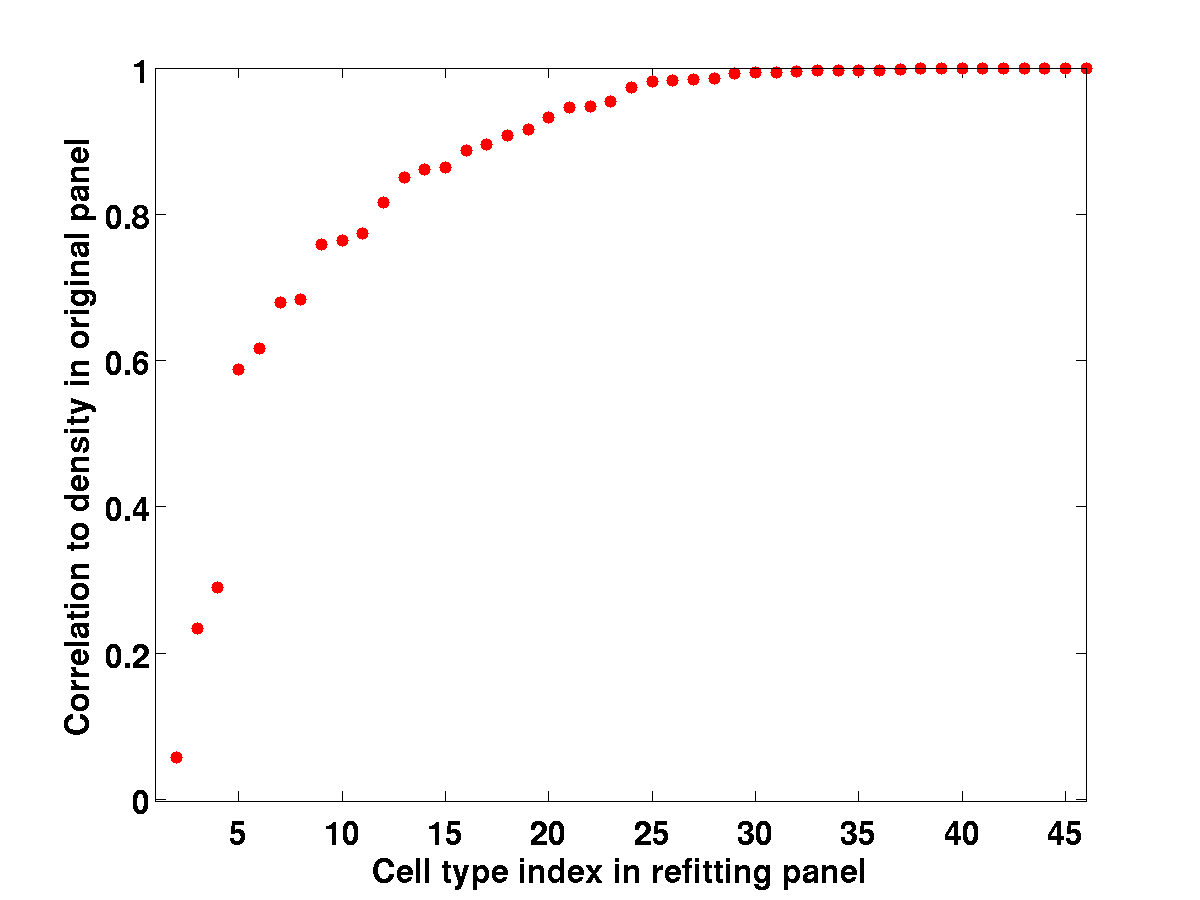
The correlation is indeed close to , moreover it is the maximum entry in the first row (the next-highest value in the first row is 0.3621) and in the first column of (the next-highest value in the first column is -0.0033):
| (51) |
The plots of and show that indeed the two profiles are mostly concentrated in the cerebral cortex. The most visible difference comes from the hippocampus, wich is more highlighted in than in the density of the composite pyramidal cell type.
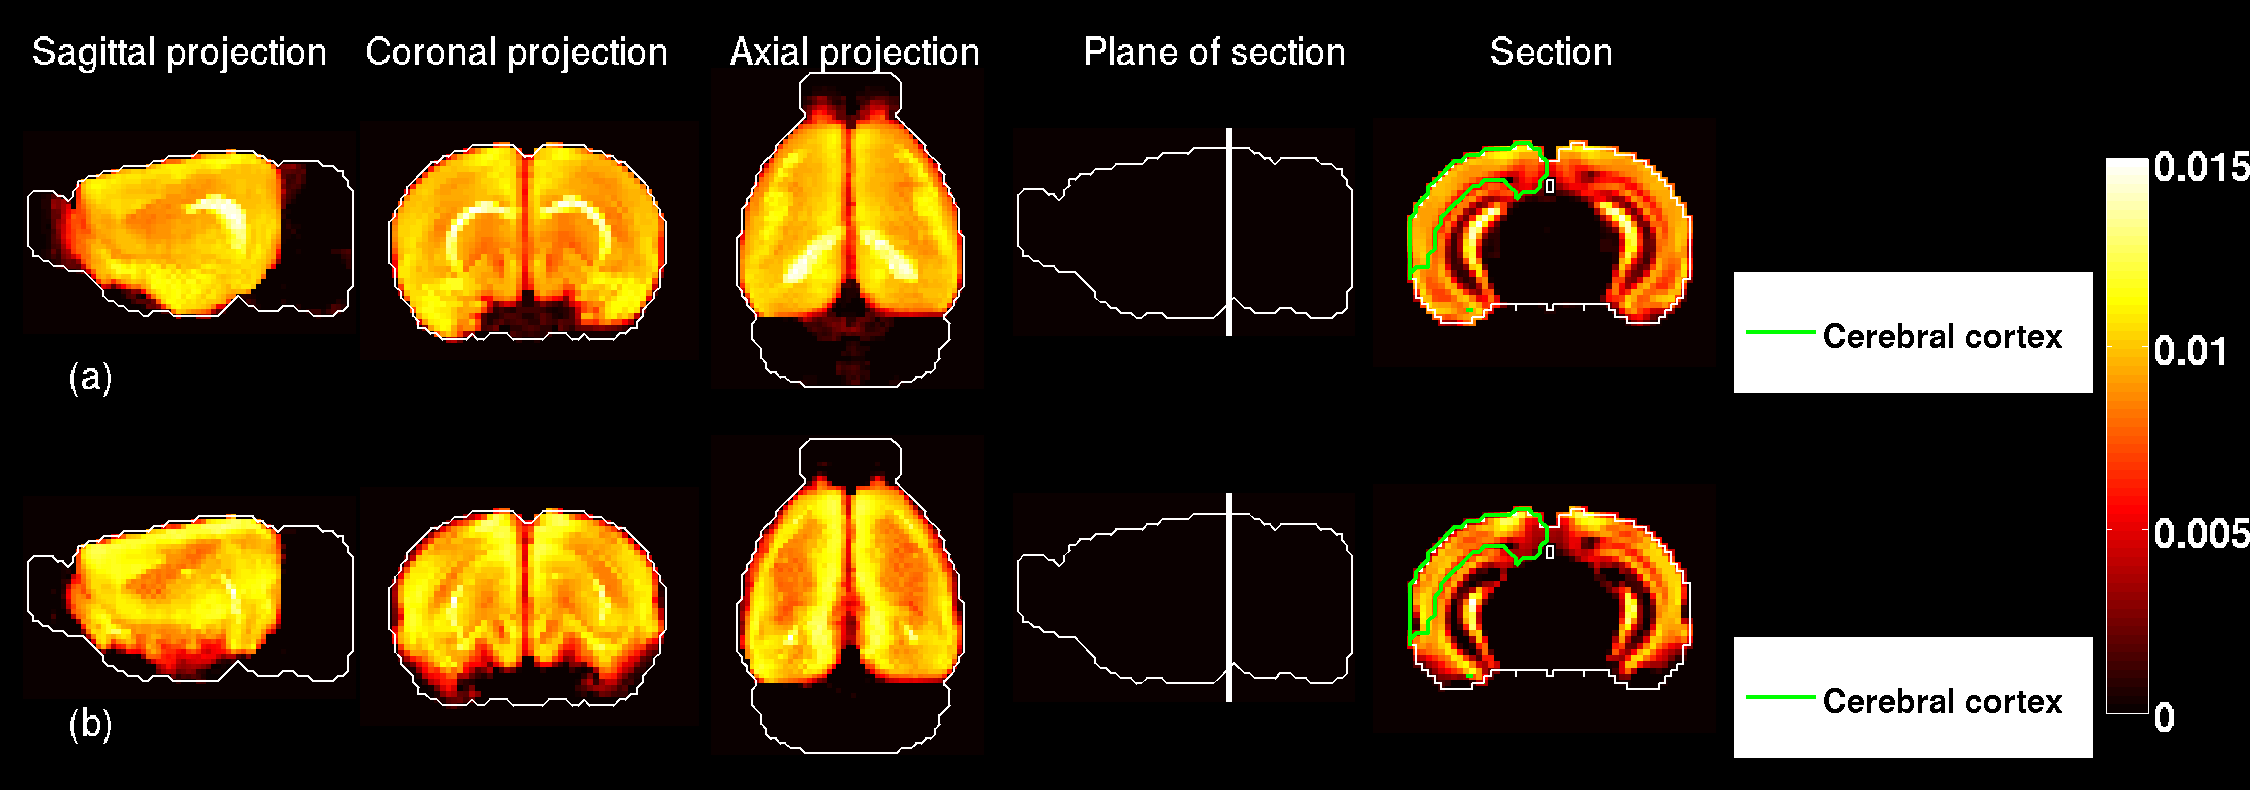
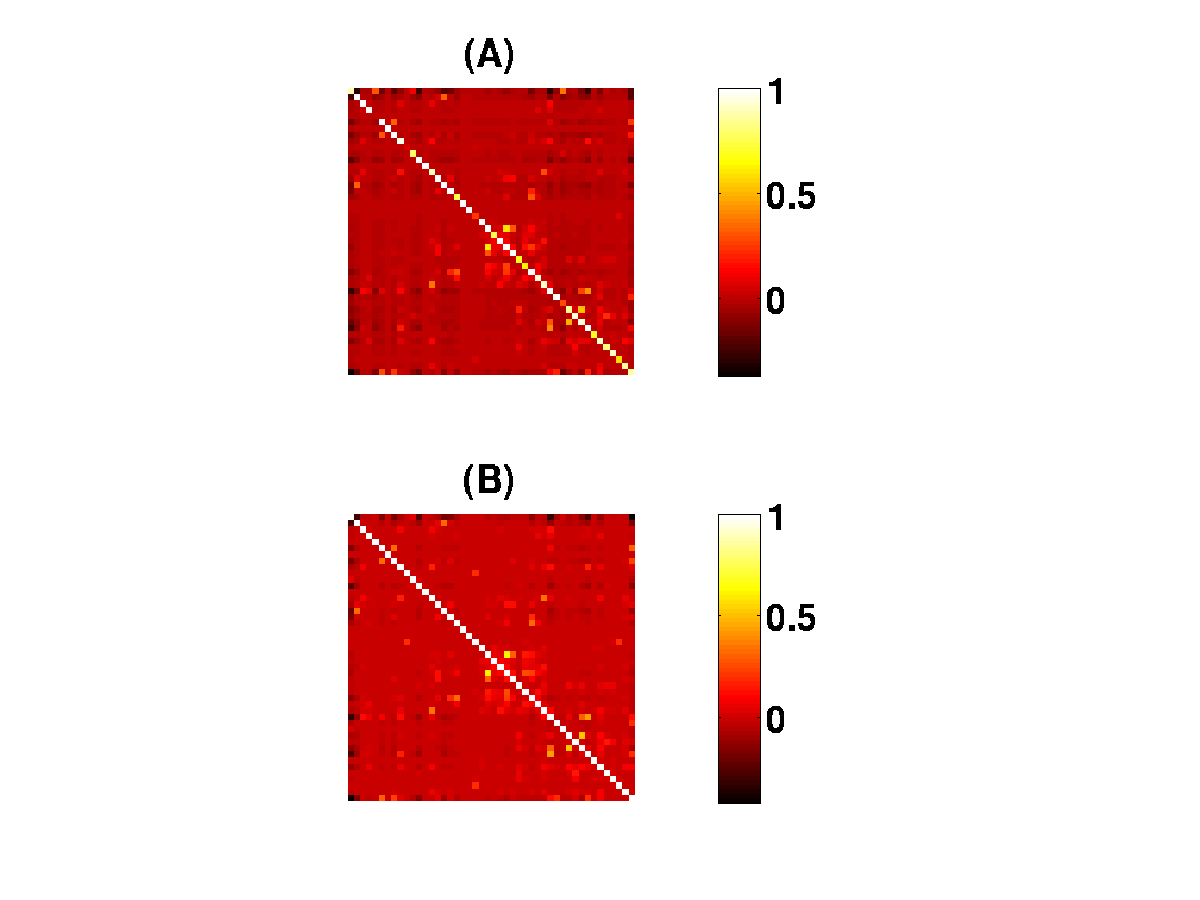
Figures 48 and 49 show some similarity between and , moreover the diagonal correlations in are larger than 0.8 for 35 out of 48 cell types in the new fitting panel defined in Equation 41.
4.3 Background value in microarray data
It can be deduced by examination of the ISH data set (the voxel-by-gene matrix representing the
Allen Atlas of the adult mouse brain)
and the microarray data set (the type-by-gene matrix ) that the background intensities
are lower in the Allen Atlas than in the cell-type-specific microarray
data. Out of the genes analyzed in the intersection
of the two datasets:
1. no gene has zero signal in any of the
cell types, moreover, the minimum entry
of the type-by-gene matrix is a relatively large
fraction of the average value of the average of all the entries:
| (52) |
| (53) |
2. Each gene has zero ISH signal in at least 0.38 percent of the voxels, and the average proportion of voxels with zero signal is larger than 4 percent
| (54) |
| (55) |
Let us denote the true expression
signal of gene labeled in cell type labeled by .
The cross-hybridization between genes and can be modeled
by a factor relating to the true signal:
| (56) |
A zero cross-hybridization would correspond to a matrix equal to the identity matrix in gene space. The simplest choice for a non-zero cross-hybridization assumes that a uniform fraction of the true signal of each gene is smeared across all other genes:
| (57) |
where uniform cross-hybridization is the rank-one matrix whose entries are all equal to one:
| (58) |
Equation 56 can be used as follows to express in terms of :
| (59) | ||||
| (60) |
where we have used the fact that is a projector, and as such has all its positive powers equal to . We can therefore rewrite the entries of (up to a collective multiplicative factor that does not modify the relative values of entries in ) as the sum of the corresponding entry in and a negative term that does only depend on the type index , and not on the gene :
| (61) |
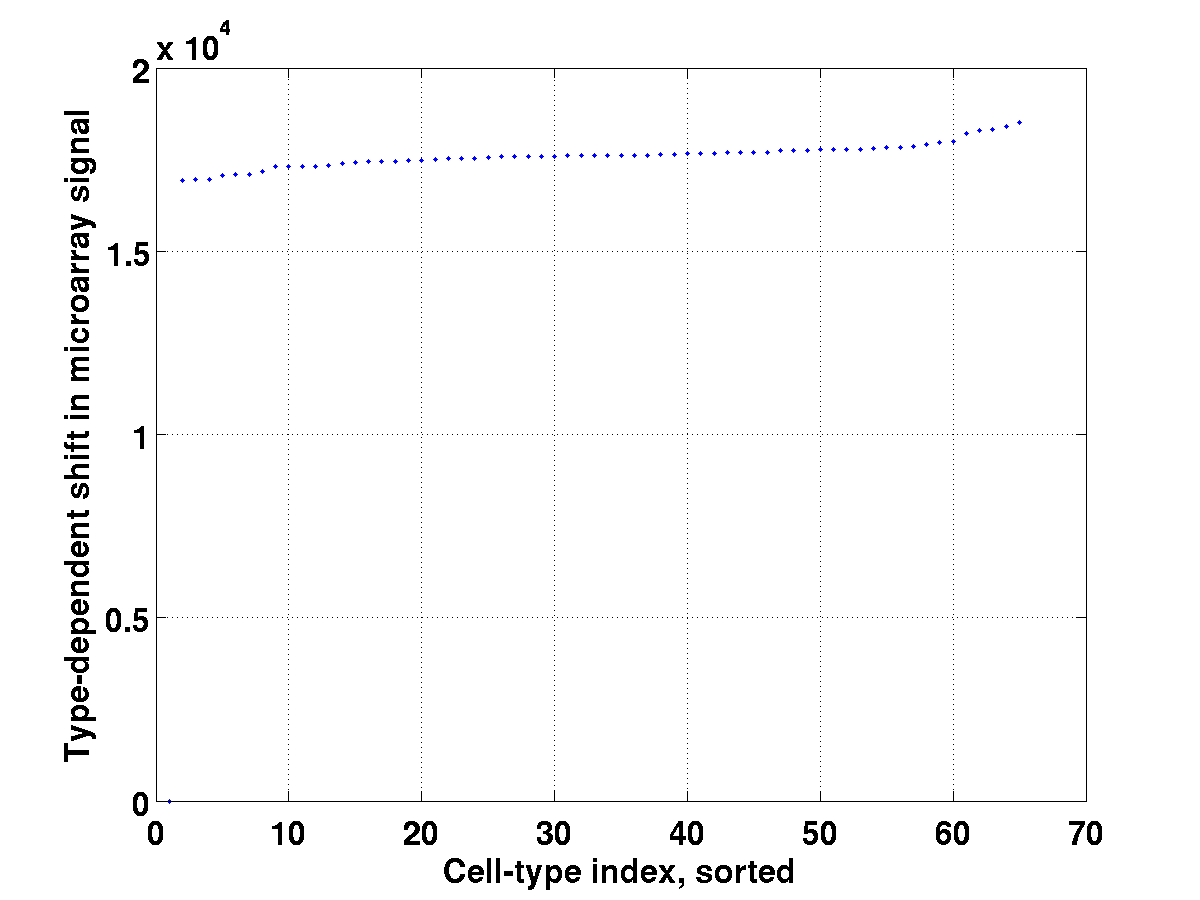
Plotting the -dependent shift-term in the above equation as a function
of , one observes (Figure 50) that it is roughly constant across cell types.
Consider the contribution of two cell types labeled and ,
and two genes labeled and , such that is expressed
only in and is expressed only in .
This situation corresponds to a diagonal submatrix matrix of size 2 in the
true signal.
Cross-hybridization between and adds non-diagonal elements
to this matrix, and if they are large enough the determinant
of the matrix can become zero, resulting in a degenerate
solution to the system , even though
the system is a linear
system with positive solutions.
Moreover, suppose a perfect solution exists at some voxel labeled
for the fitting to a true signal:
| (62) |
If the model is fitted to a microarray signal that differs from
by a type-by-gene matrix with uniform entries all equal to some value ,
one can write a test-vector as the sum of the
vector and a term , and optimize over the
values of (whose optimal value goes to zero when goes to 0):
| (63) |
| (64) |
| (65) | ||||
| (66) |
At =0, each term in the sum over genes is identically zero, but one can see that the dependence on the
gene index cannot be maintained when is increased, hence an increased
value of the residual term.
The parameter of Equation 57 is not fixed by the previous analysis, and any value can be tried provided it does not give rise to any negative entry in defined by 61. We can therefore simulate a worst-case scenario, by subtracting the lowest entry of from all the other entries (which corresponds to the approximation where the -dependence of the second term in 61 is neglected, i.e. where the dots on Figure 50 are considered to be on a horizontal line). We therefore took the following type-by-gene matrix as the new fitting panel:
| (68) |
We solved the following optimization problem at each voxel, giving rise to a new estimate called for the brain-wide density of each cell type:
| (69) |
The brain-wide correlation profiles between each cell types and the Allen Atlas
do not change under the transformation because the uniform shift
in all the entries of the matrix is compensated by the shift in the
entries of the average row . For each cell type, labeled , we can plot
projections and sections of the new estimated profile derived from ,
next to the original plot, for visual comparison. The top region
by density is the one through which the section is taken, which shows that
the top region is conserved except for cell types labeled ??.
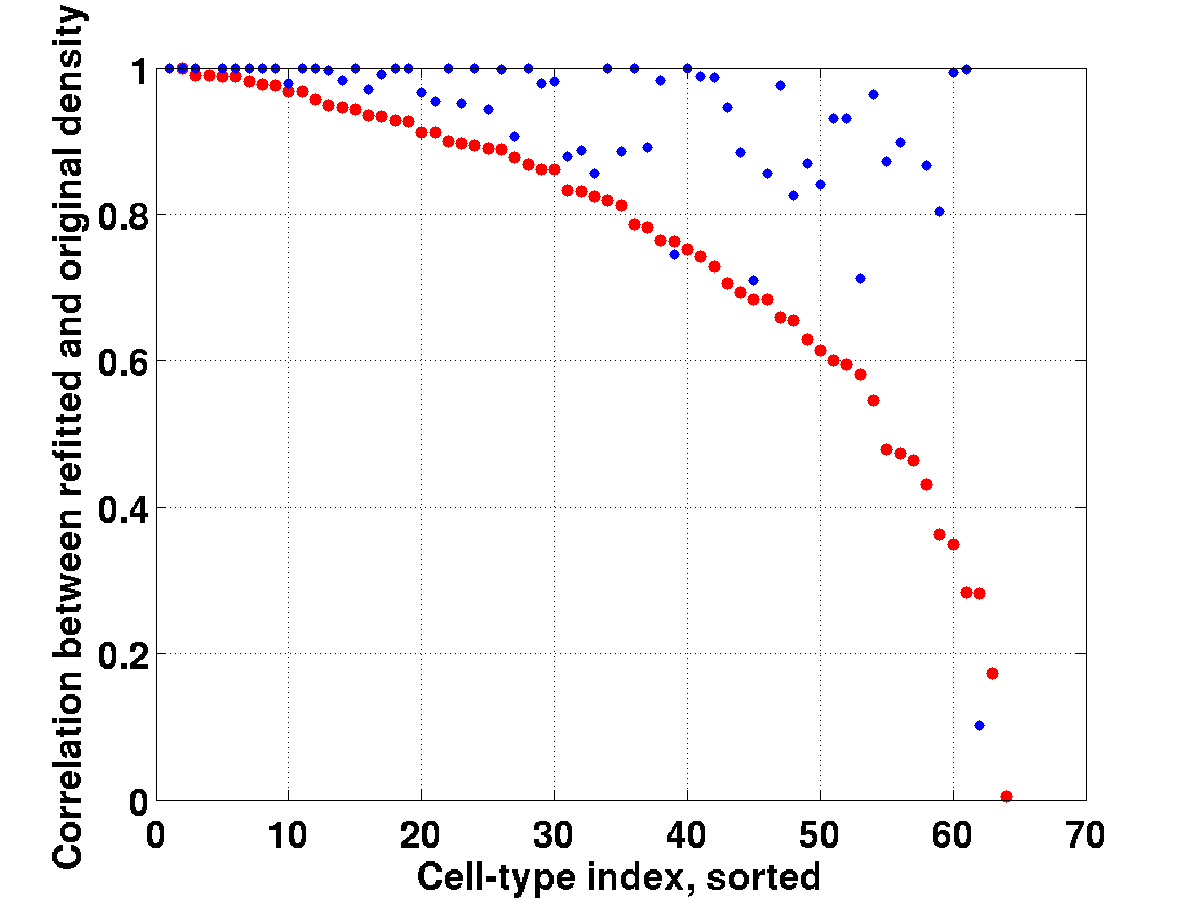
Moreover, we can compute the following correlation coefficient between the new correlation profile and the one obtained in the original linear model for the same cell type, as defined in Equation 16 for any pair of brain-wide profiles:
| (70) |
It turns out that 35 of the cell types in the data set give rise so correlation values larger than 80 percent. Another correlation can be computed between the fractions of the density binned by the regions of the ARA (defined in Equation 18).
| (71) |
where is the number of regions in the coarsest version of the ARA, and the fractions of densities in regions are defined as in Equation 18:
| (72) |
| (73) |
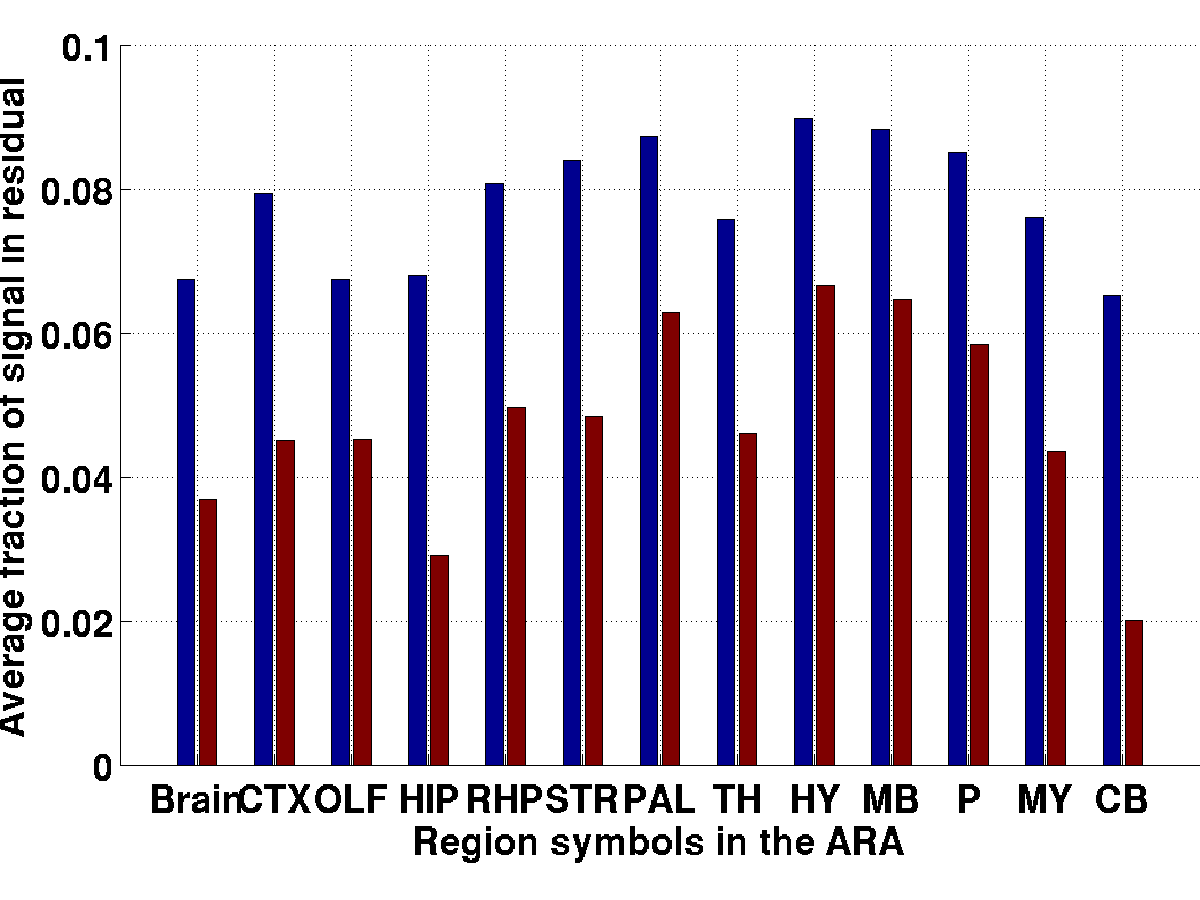
and used the values to compute the average of residual fraction across regions in the ARA:
| (74) |
The values of are plotted in Figure 51 (56 of them are larger than 80 percent).
The residual terms can be compared in order to estimate whether the fit between the Allen Atlas and the cell types is improved by subtracting a cross-hybridization term to the microarray data, as it should from the heuristic Equation LABEL:heuristic (even though the offset matrix is not expected to give rise to a perfect fit due to the imperfections of our cross-hybridization model, it must be closer to the signal measured by ISH data as it brings some entries of the cell-type-specific matrix closer to zero). We computed the average fraction of the signal that is contained in the absolute value of the residual,
| (75) |
across each of the 13 regions in the coarsest partition of the ARA:
| (76) | ||||
| (77) |
where labels regions in the ARA (see Figure 52).
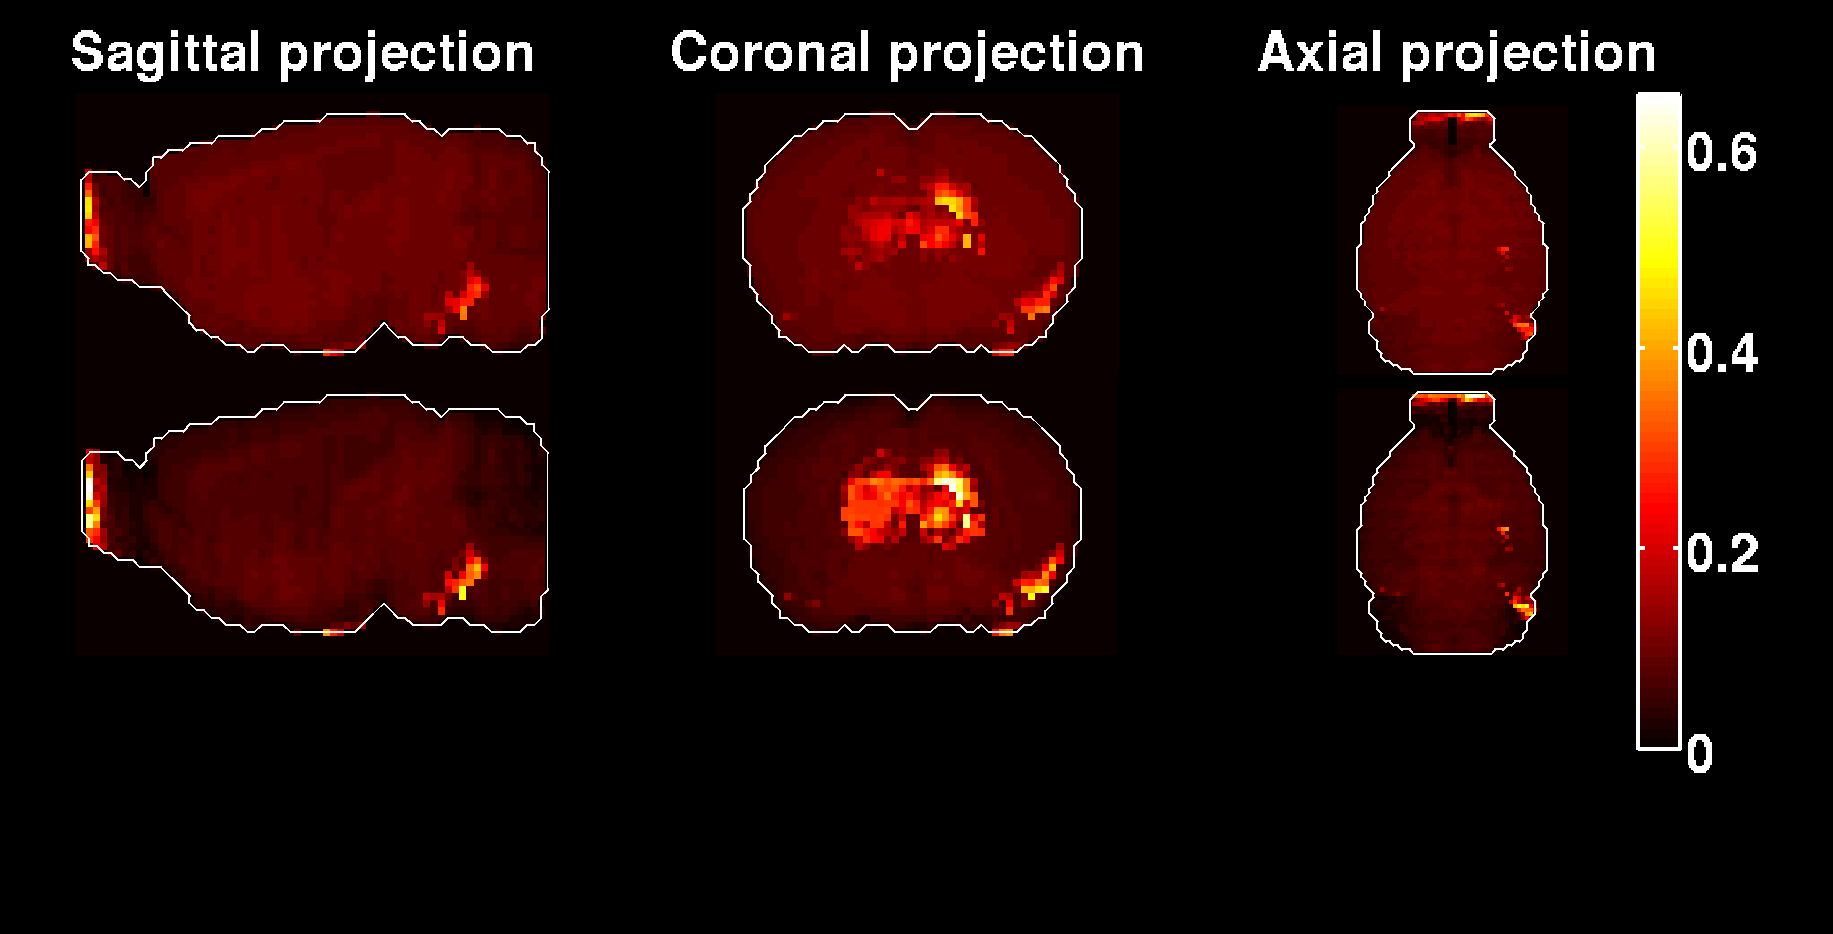
Indeed the average residual fractions in the refitted model are consistently lower than in the original model fitted to the full microarray data (see Figure 52), which suggests a better correspondence to the ISH data. For a plot of the voxel-by voxel values, see Figure 75. The average value across the brain goes down when going from the original model to the refitted model, and the highest values are localized in the same voxels in both models. The high values in the most rostral voxels can be attributed to the loss of sections from the olfactory bulbs in the ISH data, as these sections are the most fragile. The other cluster of voxels with high residual, which is much more caudal, could be related to registration errors.
5 Tables of plots of estimated densities, original and corrected for cross-hybridization
| Index | Cell type | Heat maps of densities, original and refitted |
|---|---|---|
| 1 | Purkinje Cells |
![[Uncaptioned image]](/html/1303.0013/assets/figureRefit1.png)
|
| 2 | Pyramidal Neurons |
![[Uncaptioned image]](/html/1303.0013/assets/figureRefit2.png)
|
| 3 | Pyramidal Neurons |
![[Uncaptioned image]](/html/1303.0013/assets/figureRefit3.png)
|
| Index | Cell type | Heat maps of densities, original and refitted |
|---|---|---|
| 4 | A9 Dopaminergic Neurons |
![[Uncaptioned image]](/html/1303.0013/assets/figureRefit4.png)
|
| 5 | A10 Dopaminergic Neurons |
![[Uncaptioned image]](/html/1303.0013/assets/figureRefit5.png)
|
| 6 | Pyramidal Neurons |
![[Uncaptioned image]](/html/1303.0013/assets/figureRefit6.png)
|
| Index | Cell type | Heat maps of densities, original and refitted |
|---|---|---|
| 7 | Pyramidal Neurons |
![[Uncaptioned image]](/html/1303.0013/assets/figureRefit7.png)
|
| 8 | Pyramidal Neurons |
![[Uncaptioned image]](/html/1303.0013/assets/figureRefit8.png)
|
| 9 | Mixed Neurons |
![[Uncaptioned image]](/html/1303.0013/assets/figureRefit9.png)
|
| Index | Cell type | Heat maps of densities, original and refitted |
|---|---|---|
| 10 | Motor Neurons, Midbrain Cholinergic Neurons |
![[Uncaptioned image]](/html/1303.0013/assets/figureRefit10.png)
|
| 11 | Cholinergic Projection Neurons |
![[Uncaptioned image]](/html/1303.0013/assets/figureRefit11.png)
|
| 12 | Motor Neurons, Cholinergic Interneurons |
![[Uncaptioned image]](/html/1303.0013/assets/figureRefit12.png)
|
| Index | Cell type | Heat maps of densities, original and refitted |
|---|---|---|
| 13 | Cholinergic Neurons |
![[Uncaptioned image]](/html/1303.0013/assets/figureRefit13.png)
|
| 14 | Interneurons |
![[Uncaptioned image]](/html/1303.0013/assets/figureRefit14.png)
|
| 15 | Drd1+ Medium Spiny Neurons |
![[Uncaptioned image]](/html/1303.0013/assets/figureRefit15.png)
|
| Index | Cell type | Heat maps of densities, original and refitted |
|---|---|---|
| 16 | Drd2+ Medium Spiny Neurons |
![[Uncaptioned image]](/html/1303.0013/assets/figureRefit16.png)
|
| 17 | Golgi Cells |
![[Uncaptioned image]](/html/1303.0013/assets/figureRefit17.png)
|
| 18 | Unipolar Brush cells (some Bergman Glia) |
![[Uncaptioned image]](/html/1303.0013/assets/figureRefit18.png)
|
| Index | Cell type | Heat maps of densities, original and refitted |
|---|---|---|
| 19 | Stellate Basket Cells |
![[Uncaptioned image]](/html/1303.0013/assets/figureRefit19.png)
|
| 20 | Granule Cells |
![[Uncaptioned image]](/html/1303.0013/assets/figureRefit20.png)
|
| 21 | Mature Oligodendrocytes |
![[Uncaptioned image]](/html/1303.0013/assets/figureRefit21.png)
|
| Index | Cell type | Heat maps of densities, original and refitted |
|---|---|---|
| 22 | Mature Oligodendrocytes |
![[Uncaptioned image]](/html/1303.0013/assets/figureRefit22.png)
|
| 23 | Mixed Oligodendrocytes |
![[Uncaptioned image]](/html/1303.0013/assets/figureRefit23.png)
|
| 24 | Mixed Oligodendrocytes |
![[Uncaptioned image]](/html/1303.0013/assets/figureRefit24.png)
|
| Index | Cell type | Heat maps of densities, original and refitted |
|---|---|---|
| 25 | Purkinje Cells |
![[Uncaptioned image]](/html/1303.0013/assets/figureRefit25.png)
|
| 26 | Neurons |
![[Uncaptioned image]](/html/1303.0013/assets/figureRefit26.png)
|
| 27 | Bergman Glia |
![[Uncaptioned image]](/html/1303.0013/assets/figureRefit27.png)
|
| Index | Cell type | Heat maps of densities, original and refitted |
| 28 | Astroglia |
![[Uncaptioned image]](/html/1303.0013/assets/figureRefit28.png)
|
| 29 | Astroglia |
![[Uncaptioned image]](/html/1303.0013/assets/figureRefit29.png)
|
| 30 | Astrocytes |
![[Uncaptioned image]](/html/1303.0013/assets/figureRefit30.png)
|
| Index | Cell type | Heat maps of densities, original and refitted |
|---|---|---|
| 31 | Astrocytes |
![[Uncaptioned image]](/html/1303.0013/assets/figureRefit31.png)
|
| 32 | Astrocytes |
![[Uncaptioned image]](/html/1303.0013/assets/figureRefit32.png)
|
| 33 | Mixed Neurons |
![[Uncaptioned image]](/html/1303.0013/assets/figureRefit33.png)
|
| Index | Cell type | Heat maps of densities, original and refitted |
|---|---|---|
| 34 | Mixed Neurons |
![[Uncaptioned image]](/html/1303.0013/assets/figureRefit34.png)
|
| 35 | Mature Oligodendrocytes |
![[Uncaptioned image]](/html/1303.0013/assets/figureRefit35.png)
|
| 36 | Oligodendrocytes |
![[Uncaptioned image]](/html/1303.0013/assets/figureRefit36.png)
|
| Index | Cell type | Heat maps of densities, original and refitted |
|---|---|---|
| 37 | Oligodendrocyte Precursors |
![[Uncaptioned image]](/html/1303.0013/assets/figureRefit37.png)
|
| 38 | Pyramidal Neurons, Callosally projecting, P3 |
![[Uncaptioned image]](/html/1303.0013/assets/figureRefit38.png)
|
| 39 | Pyramidal Neurons, Callosally projecting, P6 |
![[Uncaptioned image]](/html/1303.0013/assets/figureRefit39.png)
|
| Index | Cell type | Heat maps of densities, original and refitted |
|---|---|---|
| 40 | Pyramidal Neurons, Callosally projecting, P14 |
![[Uncaptioned image]](/html/1303.0013/assets/figureRefit40.png)
|
| 41 | Pyramidal Neurons, Corticospinal, P3 |
![[Uncaptioned image]](/html/1303.0013/assets/figureRefit41.png)
|
| 42 | Pyramidal Neurons, Corticospinal, P6 |
![[Uncaptioned image]](/html/1303.0013/assets/figureRefit42.png)
|
| Index | Cell type | Heat maps of densities, original and refitted |
|---|---|---|
| 43 | Pyramidal Neurons, Corticospinal, P14 |
![[Uncaptioned image]](/html/1303.0013/assets/figureRefit43.png)
|
| 44 | Pyramidal Neurons, Corticotectal, P14 |
![[Uncaptioned image]](/html/1303.0013/assets/figureRefit44.png)
|
| 45 | Pyramidal Neurons |
![[Uncaptioned image]](/html/1303.0013/assets/figureRefit45.png)
|
| Index | Cell type | Heat maps of densities, original and refitted |
|---|---|---|
| 46 | Pyramidal Neurons |
![[Uncaptioned image]](/html/1303.0013/assets/figureRefit46.png)
|
| 47 | Pyramidal Neurons |
![[Uncaptioned image]](/html/1303.0013/assets/figureRefit47.png)
|
| 48 | Pyramidal Neurons |
![[Uncaptioned image]](/html/1303.0013/assets/figureRefit48.png)
|
| Index | Cell type | Heat maps of densities, original and refitted |
|---|---|---|
| 49 | Pyramidal Neurons |
![[Uncaptioned image]](/html/1303.0013/assets/figureRefit49.png)
|
| 50 | Pyramidal Neurons |
![[Uncaptioned image]](/html/1303.0013/assets/figureRefit50.png)
|
| 51 | Tyrosine Hydroxylase Expressing |
![[Uncaptioned image]](/html/1303.0013/assets/figureRefit51.png)
|
| Index | Cell type | Heat maps of densities, original and refitted |
|---|---|---|
| 52 | Purkinje Cells |
![[Uncaptioned image]](/html/1303.0013/assets/figureRefit52.png)
|
| 53 | Glutamatergic Neuron (not well defined) |
![[Uncaptioned image]](/html/1303.0013/assets/figureRefit53.png)
|
| 54 | GABAergic Interneurons, VIP+ |
![[Uncaptioned image]](/html/1303.0013/assets/figureRefit54.png)
|
| Index | Cell type | Heat maps of densities, original and refitted |
|---|---|---|
| 55 | GABAergic Interneurons, VIP+ |
![[Uncaptioned image]](/html/1303.0013/assets/figureRefit55.png)
|
| 56 | GABAergic Interneurons, SST+ |
![[Uncaptioned image]](/html/1303.0013/assets/figureRefit56.png)
|
| 57 | GABAergic Interneurons, SST+ |
![[Uncaptioned image]](/html/1303.0013/assets/figureRefit57.png)
|
| Index | Cell type | Heat maps of densities, original and refitted |
|---|---|---|
| 58 | GABAergic Interneurons, PV+ |
![[Uncaptioned image]](/html/1303.0013/assets/figureRefit58.png)
|
| 59 | GABAergic Interneurons, PV+ |
![[Uncaptioned image]](/html/1303.0013/assets/figureRefit59.png)
|
| 60 | GABAergic Interneurons, PV+, P7 |
![[Uncaptioned image]](/html/1303.0013/assets/figureRefit60.png)
|
| Index | Cell type | Heat maps of densities, original and refitted |
|---|---|---|
| 61 | GABAergic Interneurons, PV+, P10 |
![[Uncaptioned image]](/html/1303.0013/assets/figureRefit61.png)
|
| 62 | GABAergic Interneurons, PV+, P13-P15 |
![[Uncaptioned image]](/html/1303.0013/assets/figureRefit62.png)
|
| 63 | GABAergic Interneurons, PV+, P25 |
![[Uncaptioned image]](/html/1303.0013/assets/figureRefit63.png)
|
| Index | Cell type | Heat maps of densities, original and refitted |
| 64 | GABAergic Interneurons, PV+ |
![[Uncaptioned image]](/html/1303.0013/assets/figureRefit64.png)
|
6 Conclusions
Some of the neuroanatomical patterns discovered
both in the correlation and density volumes confirm prior
biological knowledge in the sense that the top region
by correlation or density coincides with the region
from which the corresponding cell-type-specific sample was extracted.
This is the case in the cerebral cortex, the hippocampal
region, the striatum, the ventral midbrain, the medulla
and the cerebellum.
The anatomical analysis conducted here is supervised
in the sense that the brain regions are always taken to be
one of the sets of voxels carrying the same label
under some version of the voxelized Allen Reference Atlas.
In the case of the two samples extracted from the amygdala (indices
48 and 53), our method cannot return the label ’amygdala’ as
a top region by correlation and density, since the amygdala
is split between several regions.
This kind of issue is bound to occur for any choice of atlas,
since there is no universal agreement on the nomenclature
of brain regions [29]. Clustering methods could
be applied to the correlation and density profiles,
following the approach taken in [30] for the
analysis of the voxel-by-gene matrix of expression energies.
The rankings of brain regions yield some surprising results that can be linked to
the relative paucity of cell types in the study, compared to the
whole diversity of cells in the mouse brain, and to the fact that the
cell samples are not distributed uniformly across the brain.
It can be noted that there is more solidarity between the GABAergic interneurons
(indices 54–64), than between their top regions (by correlation or density),
and their anatomical origin.
A richer microarray data set with a more uniform sampling of brain regions will
modify the numerical results. In particular, it will be interesting to see
if positive densities in the hypothalamus and in the olfactory areas
can be estimated for samples extracted from these regions.
7 Acknowledgments
We thank Benjamin Okaty, Sacha Nelson and Ken Sugino for collating and transferring the microarray data, and for help with the anatomical analysis of results. We thank Jason W. Bohland, Hemant Bokil, Lydia Ng and Domenico Orlando for discussions. This research is supported by the NIH-NIDA Grant 1R21DA027644-01, Computational analysis of co-expression networks in the mouse and human brain.
8 Tables of brain-wide correlations
| Index | Description | Brain-wide heat maps of correlations |
|---|---|---|
| 1 | Purkinje Cells |
![[Uncaptioned image]](/html/1303.0013/assets/correlsFig1.png)
|
| 2 | Pyramidal Neurons |
![[Uncaptioned image]](/html/1303.0013/assets/correlsFig2.png)
|
| 3 | Pyramidal Neurons |
![[Uncaptioned image]](/html/1303.0013/assets/correlsFig3.png)
|
| 4 | A9 Dopaminergic Neurons |
![[Uncaptioned image]](/html/1303.0013/assets/correlsFig4.png)
|
| 5 | A10 Dopaminergic Neurons |
![[Uncaptioned image]](/html/1303.0013/assets/correlsFig5.png)
|
| 6 | Pyramidal Neurons |
![[Uncaptioned image]](/html/1303.0013/assets/correlsFig6.png)
|
| Index | Description | Brain-wide heat maps of correlations |
|---|---|---|
| 7 | Pyramidal Neurons |
![[Uncaptioned image]](/html/1303.0013/assets/correlsFig7.png)
|
| 8 | Pyramidal Neurons |
![[Uncaptioned image]](/html/1303.0013/assets/correlsFig8.png)
|
| 9 | Mixed Neurons |
![[Uncaptioned image]](/html/1303.0013/assets/correlsFig9.png)
|
| 10 | Motor Neurons, Midbrain Cholinergic Neurons |
![[Uncaptioned image]](/html/1303.0013/assets/correlsFig10.png)
|
| 11 | Cholinergic Projection Neurons |
![[Uncaptioned image]](/html/1303.0013/assets/correlsFig11.png)
|
| 12 | Motor Neurons, Cholinergic Interneurons |
![[Uncaptioned image]](/html/1303.0013/assets/correlsFig12.png)
|
| Index | Description | Brain-wide heat maps of correlations |
|---|---|---|
| 13 | Cholinergic Neurons |
![[Uncaptioned image]](/html/1303.0013/assets/correlsFig13.png)
|
| 14 | Interneurons |
![[Uncaptioned image]](/html/1303.0013/assets/correlsFig14.png)
|
| 15 | Drd1+ Medium Spiny Neurons |
![[Uncaptioned image]](/html/1303.0013/assets/correlsFig15.png)
|
| 16 | Drd2+ Medium Spiny Neurons |
![[Uncaptioned image]](/html/1303.0013/assets/correlsFig16.png)
|
| 17 | Golgi Cells |
![[Uncaptioned image]](/html/1303.0013/assets/correlsFig17.png)
|
| 18 | Unipolar Brush cells (some Bergman Glia) |
![[Uncaptioned image]](/html/1303.0013/assets/correlsFig18.png)
|
| Index | Description | Brain-wide heat maps of correlations |
|---|---|---|
| 19 | Stellate Basket Cells |
![[Uncaptioned image]](/html/1303.0013/assets/correlsFig19.png)
|
| 20 | Granule Cells |
![[Uncaptioned image]](/html/1303.0013/assets/correlsFig20.png)
|
| 21 | Mature Oligodendrocytes |
![[Uncaptioned image]](/html/1303.0013/assets/correlsFig21.png)
|
| 22 | Mature Oligodendrocytes |
![[Uncaptioned image]](/html/1303.0013/assets/correlsFig22.png)
|
| 23 | Mixed Oligodendrocytes |
![[Uncaptioned image]](/html/1303.0013/assets/correlsFig23.png)
|
| 24 | Mixed Oligodendrocytes |
![[Uncaptioned image]](/html/1303.0013/assets/correlsFig24.png)
|
| Index | Description | Brain-wide heat maps of correlations |
|---|---|---|
| 25 | Purkinje Cells |
![[Uncaptioned image]](/html/1303.0013/assets/correlsFig25.png)
|
| 26 | Neurons |
![[Uncaptioned image]](/html/1303.0013/assets/correlsFig26.png)
|
| 27 | Bergman Glia |
![[Uncaptioned image]](/html/1303.0013/assets/correlsFig27.png)
|
| 28 | Astroglia |
![[Uncaptioned image]](/html/1303.0013/assets/correlsFig28.png)
|
| 29 | Astroglia |
![[Uncaptioned image]](/html/1303.0013/assets/correlsFig29.png)
|
| 30 | Astrocytes |
![[Uncaptioned image]](/html/1303.0013/assets/correlsFig30.png)
|
| Index | Description | Brain-wide heat maps of correlations |
|---|---|---|
| 31 | Astrocytes |
![[Uncaptioned image]](/html/1303.0013/assets/correlsFig31.png)
|
| 32 | Astrocytes |
![[Uncaptioned image]](/html/1303.0013/assets/correlsFig32.png)
|
| 33 | Mixed Neurons |
![[Uncaptioned image]](/html/1303.0013/assets/correlsFig33.png)
|
| 34 | Mixed Neurons |
![[Uncaptioned image]](/html/1303.0013/assets/correlsFig34.png)
|
| 35 | Mature Oligodendrocytes |
![[Uncaptioned image]](/html/1303.0013/assets/correlsFig35.png)
|
| 36 | Oligodendrocytes |
![[Uncaptioned image]](/html/1303.0013/assets/correlsFig36.png)
|
| Index | Description | Brain-wide heat maps of correlations |
|---|---|---|
| 37 | Oligodendrocyte Precursors |
![[Uncaptioned image]](/html/1303.0013/assets/correlsFig37.png)
|
| 38 | Pyramidal Neurons, Callosally projecting, P3 |
![[Uncaptioned image]](/html/1303.0013/assets/correlsFig38.png)
|
| 39 | Pyramidal Neurons, Callosally projecting, P6 |
![[Uncaptioned image]](/html/1303.0013/assets/correlsFig39.png)
|
| 40 | Pyramidal Neurons, Callosally projecting, P14 |
![[Uncaptioned image]](/html/1303.0013/assets/correlsFig40.png)
|
| 41 | Pyramidal Neurons, Corticospinal, P3 |
![[Uncaptioned image]](/html/1303.0013/assets/correlsFig41.png)
|
| 42 | Pyramidal Neurons, Corticospinal, P6 |
![[Uncaptioned image]](/html/1303.0013/assets/correlsFig42.png)
|
| Index | Description | Brain-wide heat maps of correlations |
|---|---|---|
| 43 | Pyramidal Neurons, Corticospinal, P14 |
![[Uncaptioned image]](/html/1303.0013/assets/correlsFig43.png)
|
| 44 | Pyramidal Neurons, Corticotectal, P14 |
![[Uncaptioned image]](/html/1303.0013/assets/correlsFig44.png)
|
| 45 | Pyramidal Neurons |
![[Uncaptioned image]](/html/1303.0013/assets/correlsFig45.png)
|
| 46 | Pyramidal Neurons |
![[Uncaptioned image]](/html/1303.0013/assets/correlsFig46.png)
|
| 47 | Pyramidal Neurons |
![[Uncaptioned image]](/html/1303.0013/assets/correlsFig47.png)
|
| 48 | Pyramidal Neurons |
![[Uncaptioned image]](/html/1303.0013/assets/correlsFig48.png)
|
| Index | Description | Brain-wide heat maps of correlations |
|---|---|---|
| 49 | Pyramidal Neurons |
![[Uncaptioned image]](/html/1303.0013/assets/correlsFig49.png)
|
| 50 | Pyramidal Neurons |
![[Uncaptioned image]](/html/1303.0013/assets/correlsFig50.png)
|
| 51 | Tyrosine Hydroxylase Expressing |
![[Uncaptioned image]](/html/1303.0013/assets/correlsFig51.png)
|
| 52 | Purkinje Cells |
![[Uncaptioned image]](/html/1303.0013/assets/correlsFig52.png)
|
| 53 | Glutamatergic Neuron (not well defined) |
![[Uncaptioned image]](/html/1303.0013/assets/correlsFig53.png)
|
| 54 | GABAergic Interneurons, VIP+ |
![[Uncaptioned image]](/html/1303.0013/assets/correlsFig54.png)
|
| Index | Description | Brain-wide heat maps of correlations |
|---|---|---|
| 55 | GABAergic Interneurons, VIP+ |
![[Uncaptioned image]](/html/1303.0013/assets/correlsFig55.png)
|
| 56 | GABAergic Interneurons, SST+ |
![[Uncaptioned image]](/html/1303.0013/assets/correlsFig56.png)
|
| 57 | GABAergic Interneurons, SST+ |
![[Uncaptioned image]](/html/1303.0013/assets/correlsFig57.png)
|
| 58 | GABAergic Interneurons, PV+ |
![[Uncaptioned image]](/html/1303.0013/assets/correlsFig58.png)
|
| 59 | GABAergic Interneurons, PV+ |
![[Uncaptioned image]](/html/1303.0013/assets/correlsFig59.png)
|
| 60 | GABAergic Interneurons, PV+, P7 |
![[Uncaptioned image]](/html/1303.0013/assets/correlsFig60.png)
|
| Index | Description | Brain-wide heat maps of correlations |
|---|---|---|
| 61 | GABAergic Interneurons, PV+, P10 |
![[Uncaptioned image]](/html/1303.0013/assets/correlsFig61.png)
|
| 62 | GABAergic Interneurons, PV+, P13-P15 |
![[Uncaptioned image]](/html/1303.0013/assets/correlsFig62.png)
|
| 63 | GABAergic Interneurons, PV+, P25 |
![[Uncaptioned image]](/html/1303.0013/assets/correlsFig63.png)
|
| 64 | GABAergic Interneurons, PV+ |
![[Uncaptioned image]](/html/1303.0013/assets/correlsFig64.png)
|
9 Tables of estimated brain-wide densities
| Index | Description | Brain-wide heat maps of density profiles |
|---|---|---|
| 1 | Purkinje Cells |
![[Uncaptioned image]](/html/1303.0013/assets/fittingsFig1.png)
|
| 2 | Pyramidal Neurons |
![[Uncaptioned image]](/html/1303.0013/assets/fittingsFig2.png)
|
| 3 | Pyramidal Neurons |
![[Uncaptioned image]](/html/1303.0013/assets/fittingsFig3.png)
|
| 4 | A9 Dopaminergic Neurons |
![[Uncaptioned image]](/html/1303.0013/assets/fittingsFig4.png)
|
| 5 | A10 Dopaminergic Neurons |
![[Uncaptioned image]](/html/1303.0013/assets/fittingsFig5.png)
|
| 6 | Pyramidal Neurons |
![[Uncaptioned image]](/html/1303.0013/assets/fittingsFig6.png)
|
| Index | Description | Brain-wide heat maps of density profiles |
|---|---|---|
| 7 | Pyramidal Neurons |
![[Uncaptioned image]](/html/1303.0013/assets/fittingsFig7.png)
|
| 8 | Pyramidal Neurons |
![[Uncaptioned image]](/html/1303.0013/assets/fittingsFig8.png)
|
| 9 | Mixed Neurons |
![[Uncaptioned image]](/html/1303.0013/assets/fittingsFig9.png)
|
| 10 | Motor Neurons, Midbrain Cholinergic Neurons |
![[Uncaptioned image]](/html/1303.0013/assets/fittingsFig10.png)
|
| 11 | Cholinergic Projection Neurons |
![[Uncaptioned image]](/html/1303.0013/assets/fittingsFig11.png)
|
| 12 | Motor Neurons, Cholinergic Interneurons |
![[Uncaptioned image]](/html/1303.0013/assets/fittingsFig12.png)
|
| Index | Description | Brain-wide heat maps of density profiles |
|---|---|---|
| 13 | Cholinergic Neurons |
![[Uncaptioned image]](/html/1303.0013/assets/fittingsFig13.png)
|
| 14 | Interneurons |
![[Uncaptioned image]](/html/1303.0013/assets/fittingsFig14.png)
|
| 15 | Drd1+ Medium Spiny Neurons |
![[Uncaptioned image]](/html/1303.0013/assets/fittingsFig15.png)
|
| 16 | Drd2+ Medium Spiny Neurons |
![[Uncaptioned image]](/html/1303.0013/assets/fittingsFig16.png)
|
| 17 | Golgi Cells |
![[Uncaptioned image]](/html/1303.0013/assets/fittingsFig17.png)
|
| 18 | Unipolar Brush cells (some Bergman Glia) |
![[Uncaptioned image]](/html/1303.0013/assets/fittingsFig18.png)
|
| Index | Description | Brain-wide heat maps of density profiles |
|---|---|---|
| 19 | Stellate Basket Cells |
![[Uncaptioned image]](/html/1303.0013/assets/fittingsFig19.png)
|
| 20 | Granule Cells |
![[Uncaptioned image]](/html/1303.0013/assets/fittingsFig20.png)
|
| 21 | Mature Oligodendrocytes |
![[Uncaptioned image]](/html/1303.0013/assets/fittingsFig21.png)
|
| 22 | Mature Oligodendrocytes |
![[Uncaptioned image]](/html/1303.0013/assets/fittingsFig22.png)
|
| 23 | Mixed Oligodendrocytes | N/A |
| 24 | Mixed Oligodendrocytes |
![[Uncaptioned image]](/html/1303.0013/assets/fittingsFig24.png)
|
| Index | Description | Brain-wide heat maps of density profiles |
|---|---|---|
| 25 | Purkinje Cells |
![[Uncaptioned image]](/html/1303.0013/assets/fittingsFig25.png)
|
| 26 | Neurons |
![[Uncaptioned image]](/html/1303.0013/assets/fittingsFig26.png)
|
| 27 | Bergman Glia |
![[Uncaptioned image]](/html/1303.0013/assets/fittingsFig27.png)
|
| 28 | Astroglia |
![[Uncaptioned image]](/html/1303.0013/assets/fittingsFig28.png)
|
| 29 | Astroglia |
![[Uncaptioned image]](/html/1303.0013/assets/fittingsFig29.png)
|
| 30 | Astrocytes |
![[Uncaptioned image]](/html/1303.0013/assets/fittingsFig30.png)
|
| Index | Description | Brain-wide heat maps of density profiles |
|---|---|---|
| 31 | Astrocytes |
![[Uncaptioned image]](/html/1303.0013/assets/fittingsFig31.png)
|
| 32 | Astrocytes |
![[Uncaptioned image]](/html/1303.0013/assets/fittingsFig32.png)
|
| 33 | Mixed Neurons |
![[Uncaptioned image]](/html/1303.0013/assets/fittingsFig33.png)
|
| 34 | Mixed Neurons |
![[Uncaptioned image]](/html/1303.0013/assets/fittingsFig34.png)
|
| 35 | Mature Oligodendrocytes |
![[Uncaptioned image]](/html/1303.0013/assets/fittingsFig35.png)
|
| 36 | Oligodendrocytes |
![[Uncaptioned image]](/html/1303.0013/assets/fittingsFig36.png)
|
| Index | Description | Brain-wide heat maps of density profiles |
|---|---|---|
| 37 | Oligodendrocyte Precursors |
![[Uncaptioned image]](/html/1303.0013/assets/fittingsFig37.png)
|
| 38 | Pyramidal Neurons, Callosally projecting, P3 |
![[Uncaptioned image]](/html/1303.0013/assets/fittingsFig38.png)
|
| 39 | Pyramidal Neurons, Callosally projecting, P6 |
![[Uncaptioned image]](/html/1303.0013/assets/fittingsFig39.png)
|
| 40 | Pyramidal Neurons, Callosally projecting, P14 |
![[Uncaptioned image]](/html/1303.0013/assets/fittingsFig40.png)
|
| 41 | Pyramidal Neurons, Corticospinal, P3 |
![[Uncaptioned image]](/html/1303.0013/assets/fittingsFig41.png)
|
| 42 | Pyramidal Neurons, Corticospinal, P6 |
![[Uncaptioned image]](/html/1303.0013/assets/fittingsFig42.png)
|
| Index | Description | Brain-wide heat maps of density profiles |
|---|---|---|
| 43 | Pyramidal Neurons, Corticospinal, P14 |
![[Uncaptioned image]](/html/1303.0013/assets/fittingsFig43.png)
|
| 44 | Pyramidal Neurons, Corticotectal, P14 |
![[Uncaptioned image]](/html/1303.0013/assets/fittingsFig44.png)
|
| 45 | Pyramidal Neurons |
![[Uncaptioned image]](/html/1303.0013/assets/fittingsFig45.png)
|
| 46 | Pyramidal Neurons |
![[Uncaptioned image]](/html/1303.0013/assets/fittingsFig46.png)
|
| 47 | Pyramidal Neurons |
![[Uncaptioned image]](/html/1303.0013/assets/fittingsFig47.png)
|
| 48 | Pyramidal Neurons |
![[Uncaptioned image]](/html/1303.0013/assets/fittingsFig48.png)
|
| Index | Description | Brain-wide heat maps of density profiles |
|---|---|---|
| 49 | Pyramidal Neurons |
![[Uncaptioned image]](/html/1303.0013/assets/fittingsFig49.png)
|
| 50 | Pyramidal Neurons |
![[Uncaptioned image]](/html/1303.0013/assets/fittingsFig50.png)
|
| 51 | Tyrosine Hydroxylase Expressing |
![[Uncaptioned image]](/html/1303.0013/assets/fittingsFig51.png)
|
| 52 | Purkinje Cells |
![[Uncaptioned image]](/html/1303.0013/assets/fittingsFig52.png)
|
| 53 | Glutamatergic Neuron (not well defined) |
![[Uncaptioned image]](/html/1303.0013/assets/fittingsFig53.png)
|
| 54 | GABAergic Interneurons, VIP+ |
![[Uncaptioned image]](/html/1303.0013/assets/fittingsFig54.png)
|
| Index | Description | Brain-wide heat maps of density profiles |
|---|---|---|
| 55 | GABAergic Interneurons, VIP+ |
![[Uncaptioned image]](/html/1303.0013/assets/fittingsFig55.png)
|
| 56 | GABAergic Interneurons, SST+ |
![[Uncaptioned image]](/html/1303.0013/assets/fittingsFig56.png)
|
| 57 | GABAergic Interneurons, SST+ |
![[Uncaptioned image]](/html/1303.0013/assets/fittingsFig57.png)
|
| 58 | GABAergic Interneurons, PV+ |
![[Uncaptioned image]](/html/1303.0013/assets/fittingsFig58.png)
|
| 59 | GABAergic Interneurons, PV+ |
![[Uncaptioned image]](/html/1303.0013/assets/fittingsFig59.png)
|
| 60 | GABAergic Interneurons, PV+, P7 |
![[Uncaptioned image]](/html/1303.0013/assets/fittingsFig60.png)
|
| Index | Description | Brain-wide heat maps of density profiles |
|---|---|---|
| 61 | GABAergic Interneurons, PV+, P10 |
![[Uncaptioned image]](/html/1303.0013/assets/fittingsFig61.png)
|
| 62 | GABAergic Interneurons, PV+, P13-P15 |
![[Uncaptioned image]](/html/1303.0013/assets/fittingsFig62.png)
|
| 63 | GABAergic Interneurons, PV+, P25 |
![[Uncaptioned image]](/html/1303.0013/assets/fittingsFig63.png)
|
| 64 | GABAergic Interneurons, PV+ |
![[Uncaptioned image]](/html/1303.0013/assets/fittingsFig64.png)
|
10 Tables of description of cell-type specific samples
| Index | Description | Age of animal | Reference |
|---|---|---|---|
| 1 | Purkinje Cells | P60 | [17] |
| 2 | Pyramidal Neurons | P60 | [17] |
| 3 | Pyramidal Neurons | P60 | [17] |
| 4 | A9 Dopaminergic Neurons | Adult (precise age not given) | [20] |
| 5 | A10 Dopaminergic Neurons | Adult (precise age not given) | [20] |
| 6 | Pyramidal Neurons | Adult (precise age not given) | [19] |
| 7 | Pyramidal Neurons | Adult (precise age not given) | [19] |
| 8 | Pyramidal Neurons | Adult (precise age not given) | [19] |
| 9 | Mixed Neurons | Adult (precise age not given) | [19] |
| 10 | Motor Neurons, Midbrain Cholinergic Neurons | Adult (precise age not given) | [19] |
| 11 | Cholinergic Projection Neurons | Adult (precise age not given) | [19] |
| 12 | Motor Neurons, Cholinergic Interneurons | Adult (precise age not given) | [19] |
| 13 | Cholinergic Neurons | Adult (precise age not given) | [19] |
| 14 | Interneurons | Adult (precise age not given) | [19] |
| 15 | Drd1+ Medium Spiny Neurons | Adult (precise age not given) | [19] |
| 16 | Drd2+ Medium Spiny Neurons | Adult (precise age not given) | [19] |
| 17 | Golgi Cells | Adult (precise age not given) | [19] |
| 18 | Unipolar Brush cells (some Bergman Glia) | Adult (precise age not given) | [19] |
| 19 | Stellate Basket Cells | Adult (precise age not given) | [19] |
| 20 | Granule Cells | Adult (precise age not given) | [19] |
| 21 | Mature Oligodendrocytes | Adult (precise age not given) | [19] |
| 22 | Mature Oligodendrocytes | Adult (precise age not given) | [19] |
| 23 | Mixed Oligodendrocytes | Adult (precise age not given) | [19] |
| 24 | Mixed Oligodendrocytes | Adult (precise age not given) | [19] |
| 25 | Purkinje Cells | Adult (precise age not given) | [19] |
| 26 | Neurons | Adult (precise age not given) | [19] |
| 27 | Bergman Glia | Adult (precise age not given) | [19] |
| 28 | Astroglia | Adult (precise age not given) | [19] |
| 29 | Astroglia | Adult (precise age not given) | [19] |
| 30 | Astrocytes | P7-P8 | [20] |
| 31 | Astrocytes | P17 | [20] |
| 32 | Astrocytes | P17 | [20] |
| 33 | Mixed Neurons | P7 | [20] |
| 34 | Mixed Neurons | P16 | [20] |
| 35 | Mature Oligodendrocytes | P17 | [20] |
| 36 | Oligodendrocytes | P7 | [20] |
| 37 | Oligodendrocyte Precursors | P7 | [20] |
| Index | Description | Age of animal | Reference |
|---|---|---|---|
| 38 | Pyramidal Neurons, Callosally projecting, P3 | P3 | [21] |
| 39 | Pyramidal Neurons, Callosally projecting, P6 | P6 | [21] |
| 40 | Pyramidal Neurons, Callosally projecting, P14 | P14 | [21] |
| 41 | Pyramidal Neurons, Corticospinal, P3 | P3 | [21] |
| 42 | Pyramidal Neurons, Corticospinal, P6 | P6 | [21] |
| 43 | Pyramidal Neurons, Corticospinal, P14 | P14 | [21] |
| 44 | Pyramidal Neurons, Corticotectal, P14 | P14 | [21] |
| 45 | Pyramidal Neurons | P60 | [23] |
| 46 | Pyramidal Neurons | P60 | [23] |
| 47 | Pyramidal Neurons | P60 | [23] |
| 48 | Pyramidal Neurons | P60 | [23] |
| 49 | Pyramidal Neurons | P60 | [23] |
| 50 | Pyramidal Neurons | P60 | Unpublished |
| 51 | Tyrosine Hydroxylase Expressing | P45 | Unpublished |
| 52 | Purkinje Cells | P45 | Unpublished |
| 53 | Glutamatergic Neuron (not well defined) | P60 | [23] |
| 54 | GABAergic Interneurons, VIP+ | P60 | [23] |
| 55 | GABAergic Interneurons, VIP+ | P60 | [23] |
| 56 | GABAergic Interneurons, SST+ | P60 | [23] |
| 57 | GABAergic Interneurons, SST+ | P60 | [23] |
| 58 | GABAergic Interneurons, PV+ | P60 | [23] |
| 59 | GABAergic Interneurons, PV+ | P60 | [23] |
| 60 | GABAergic Interneurons, PV+, P7 | P7 | [16] |
| 61 | GABAergic Interneurons, PV+, P10 | P10 | [16] |
| 62 | GABAergic Interneurons, PV+, P13-P15 | P15 | [16] |
| 63 | GABAergic Interneurons, PV+, P25 | P25 | [16] |
| 64 | GABAergic Interneurons, PV+ | P45 | [16] |
11 Tables of anatomical origin of the cell-type-specific samples
For each of the cell-type-specific samples analyzed in this study, the
following two tables give a brief description of the cell types, the
region from which those cell types were extracted according to the
coarsest (or ’big12’) version of the Allen Reference Atlas, and the
finest region to which it can be assigned according to the data
provided in the studies
[16, 17, 18, 19, 20, 21, 22, 23].
| Index | Description | Region in the ARA (’big12’) | Finest label in the ARA |
|---|---|---|---|
| 1 | Purkinje Cells | Cerebellum | Cerebellar cortex |
| 2 | Pyramidal Neurons | Cerebral cortex | Primary motor area; Layer 5 |
| 3 | Pyramidal Neurons | Cerebral cortex | Primary somatosensory area; Layer 5 |
| 4 | A9 Dopaminergic Neurons | Midbrain | Substantia nigra_ compact part |
| 5 | A10 Dopaminergic Neurons | Midbrain | Ventral tegmental area |
| 6 | Pyramidal Neurons | Cerebral cortex | Cerebral cortex; Layer 5 |
| 7 | Pyramidal Neurons | Cerebral cortex | Cerebral cortex; Layer 5 |
| 8 | Pyramidal Neurons | Cerebral cortex | Cerebral cortex; Layer 6 |
| 9 | Mixed Neurons | Cerebral cortex | Cerebral cortex |
| 10 | Motor Neurons, Midbrain Cholinergic Neurons | Midbrain | Peduncolopontine nucleus |
| 11 | Cholinergic Projection Neurons | Pallidum | Pallidum_ ventral region |
| 12 | Motor Neurons, Cholinergic Interneurons | Medulla | Spinal cord |
| 13 | Cholinergic Neurons | Striatum | Striatum |
| 14 | Interneurons | Cerebral cortex | Cerebral cortex |
| 15 | Drd1+ Medium Spiny Neurons | Striatum | Striatum |
| 16 | Drd2+ Medium Spiny Neurons | Striatum | Striatum |
| 17 | Golgi Cells | Cerebellum | Cerebellar cortex |
| 18 | Unipolar Brush cells (some Bergman Glia) | Cerebellum | Cerebellar cortex |
| 19 | Stellate Basket Cells | Cerebellum | Cerebellar cortex |
| 20 | Granule Cells | Cerebellum | Cerebellar cortex |
| 21 | Mature Oligodendrocytes | Cerebellum | Cerebellar cortex |
| 22 | Mature Oligodendrocytes | Cerebral cortex | Cerebral cortex |
| 23 | Mixed Oligodendrocytes | Cerebellum | Cerebellar cortex |
| 24 | Mixed Oligodendrocytes | Cerebral cortex | Cerebral cortex |
| 25 | Purkinje Cells | Cerebellum | Cerebellar cortex |
| 26 | Neurons | Cerebral cortex | Cerebral cortex |
| 27 | Bergman Glia | Cerebellum | Cerebellar cortex |
| 28 | Astroglia | Cerebellum | Cerebellar cortex |
| 29 | Astroglia | Cerebral cortex | Cerebral cortex |
| 30 | Astrocytes | Cerebral cortex | Cerebral cortex |
| 31 | Astrocytes | Cerebral cortex | Cerebral cortex |
| 32 | Astrocytes | Cerebral cortex | Cerebral cortex |
| 33 | Mixed Neurons | Cerebral cortex | Cerebral cortex |
| 34 | Mixed Neurons | Cerebral cortex | Cerebral cortex |
| 35 | Mature Oligodendrocytes | Cerebral cortex | Cerebral cortex |
| 36 | Oligodendrocytes | Cerebral cortex | Cerebral cortex |
| 37 | Oligodendrocyte Precursors | Cerebral cortex | Cerebral cortex |
| Index | Description | Region in the ARA (’big12’) | Finest label in the ARA |
|---|---|---|---|
| 38 | Pyramidal Neurons, Callosally projecting, P3 | Cerebral cortex | Cerebral cortex |
| 39 | Pyramidal Neurons, Callosally projecting, P6 | Cerebral cortex | Cerebral cortex |
| 40 | Pyramidal Neurons, Callosally projecting, P14 | Cerebral cortex | Cerebral cortex |
| 41 | Pyramidal Neurons, Corticospinal, P3 | Cerebral cortex | Cerebral cortex |
| 42 | Pyramidal Neurons, Corticospinal, P6 | Cerebral cortex | Cerebral cortex |
| 43 | Pyramidal Neurons, Corticospinal, P14 | Cerebral cortex | Cerebral cortex |
| 44 | Pyramidal Neurons, Corticotectal, P14 | Cerebral cortex | Cerebral cortex |
| 45 | Pyramidal Neurons | Cerebral cortex | Cerebral cortex, Layer 5 |
| 46 | Pyramidal Neurons | Cerebral cortex | Cerebral cortex, Layer 5 |
| 47 | Pyramidal Neurons | Cerebral cortex | Primary somatosensory area; Layer 5 |
| 48 | Pyramidal Neurons | Cerebral cortex | Prelimbic area and Infralimbic area; Layer 5 (Amygdala) |
| 49 | Pyramidal Neurons | Hippocampal region | Ammon’s Horn; Layer 6B |
| 50 | Pyramidal Neurons | Cerebral cortex | Primary motor area |
| 51 | Tyrosine Hydroxylase Expressing | Pons | Pontine central gray |
| 52 | Purkinje Cells | Cerebellum | Cerebellar cortex |
| 53 | Glutamatergic Neuron (not well defined) | Cerebral cortex | Cerebral cortex; Layer 6B (Amygdala) |
| 54 | GABAergic Interneurons, VIP+ | Cerebral cortex | Prelimbic area and Infralimbic area |
| 55 | GABAergic Interneurons, VIP+ | Cerebral cortex | Primary somatosensory area |
| 56 | GABAergic Interneurons, SST+ | Cerebral cortex | Prelimbic area and Infralimbic area |
| 57 | GABAergic Interneurons, SST+ | Hippocampal region | Ammon’s Horn |
| 58 | GABAergic Interneurons, PV+ | Cerebral cortex | Prelimbic area and Infralimbic area |
| 59 | GABAergic Interneurons, PV+ | Thalamus | Dorsal part of the lateral geniculate complex |
| 60 | GABAergic Interneurons, PV+, P7 | Cerebral cortex | Primary somatosensory area |
| 61 | GABAergic Interneurons, PV+, P10 | Cerebral cortex | Primary somatosensory area |
| 62 | GABAergic Interneurons, PV+, P13-P15 | Cerebral cortex | Primary somatosensory area |
| 63 | GABAergic Interneurons, PV+, P25 | Cerebral cortex | Primary somatosensory area |
| 64 | GABAergic Interneurons, PV+ | Cerebral cortex | Primary motor area |
References
- [1] M. Bota, H.-W. Dong, L.W. Swanson, From gene networks to brain networks, Nature neuroscience (2003) 6 (8), 795–9.
- [2] E.S. Lein, M. Hawrylycz, N. Ao, M. Ayres, A. Bensinger, A. Bernard, A.F. Boe, M.S. Boguski, K.S. Brockway, E.J. Byrnes, L. Chen, L. Chen, T.M. Chen, M.C. Chin, J. Chong, B.E. Crook, A. Czaplinska, C.N. Dang, S. Datta, N.R. Dee, et al., Genome-wide atlas of gene expression in the adult mouse brain. Nature 445, 168–176 (2007).
- [3] L. Ng, M. Hawrylycz, D. Haynor, Automated high-throughput registration for localizing 3D mouse brain gene expression using ITK, Insight-Journal (2005).
- [4] S.M. Sunkin and J.G. Hohmann, Insights from spatially mapped gene expression in the mouse brain, Human Molecular Genetics, 2007, Vol. 16, Review Issue 2.
- [5] L. Ng, S.D. Pathak, C. Kuan, C. Lau, H. Dong, A. Sodt, C. Dang, B. Avants, P. Yushkevich, J.C. Gee, D. Haynor, E. Lein, A. Jones and M. Hawrylycz, Neuroinformatics for genome-wide 3D gene expression mapping in the mouse brain, IEEE/ACM Trans. Comput. Biol. Bioinform. (2007), Jul-Sep 4(3) 382–93.
- [6] M. Hawrylycz, R.A. Baldock, A. Burger, T. Hashikawa, G.A. Johnson, M. Martone, L. Ng, C. Lau, S.D. Larsen, J. Nissanov, L. Puelles, S. Ruffins, F. Verbeek, I. Zaslavsky1, J. Boline, Digital Atlasing and Standardization in the Mouse Brain, PLoS Computational Biology 7 (2) (2011).
- [7] A.R. Jones, C.C. Overly and S.M. Sunkin, The Allen Brain Atlas: 5 years and beyond, Nature Reviews (Neuroscience), Volume 10 (November 2009), 1.
- [8] M. Hawrylycz, L. Ng, D. Page, J. Morris, C. Lau, S. Faber, V. Faber, S. Sunkin, V. Menon, E.S. Lein, A. Jones, Multi-scale correlation structure of gene expression in the brain, Neural Networks 24 (2011) 933–942.
- [9] H.-W. Dong, The Allen reference atlas: a digital brain atlas of the C57BL/6J male mouse, Wiley, 2007.
- [10] L. Ng, A. Bernard, C. Lau, C.C. Overly, H.-W. Dong, C. Kuan, S. Pathak, S.M. Sunkin, C. Dang, J.W. Bohland, H. Bokil, P.P. Mitra, L. Puelles, J. Hohmann, D.J. Anderson, E.S. Lein, A.R. Jones, M. Hawrylycz, An anatomic gene expression atlas of the adult mouse brain, Nature Neuroscience 12, 356–362 (2009).
- [11] L. Ng et al., NeuroBlast: a 3D spatial homology search tool for gene expression, BMC Neuroscience 2007, 8(Suppl 2):P11.
- [12] P. Grange, J.W. Bohland, M. Hawrylycz and P.P. Mitra, Brain Gene Expression Analysis: a MATLAB toolbox for the analysis of brain-wide gene-expression data, [arXiv:1211.6177 [q-bio.QM]].
- [13] The Brain Gene Expression Atlas MATLAB toolbox is downloadable from http://brainarchitecture.org/allen-atlas-brain-toolbox.
- [14] P. Grange, M. Hawrylycz, P.P. Mitra, Computational neuroanatomy and co- expression of genes in the adult mouse brain, analysis tools for the Allen Brain Atlas, Quantitative Biology (2013), in press, [arXiv:1301.1730 [q-bio.QM]].
- [15] P. Grange, P.P. Mitra, Computational neuroanatomy and gene expression: optimal sets of marker genes for brain regions, IEEE, in CISS 2012, 46th annual conference on Information Science and Systems (Princeton).
- [16] B.W. Okaty, M.N. Miller, K. Sugino, C.M. Hempel, S.B. Nelson, Transcriptional and electrophysiological maturation of neocortical fast-spiking GABAergic interneurons, J. Neurosci. (2009) 29(21) 7040-52.
- [17] M.J. Rossner, J. Hirrlinger, S.P. Wichert, C. Boehm, D. Newrzella, H. Hiemisch, G. Eisenhardt, C. Stuenkel, O. von Ahsen, K.A. Nave, Global transcriptome analysis of genetically identified neurons in the adult cortex, J. Neurosci. 2006 26(39) 9956-66.
- [18] J.D. Cahoy, B. Emery, A. Kaushal, L.C. Foo, J.L. Zamanian, K.S. Christopherson, Y. Xing, J.L. Lubischer, P.A. Krieg, S.A. Krupenko, W.J. Thompson, B.A. Barres, A transcriptome database for astrocytes, neurons, and oligodendrocytes: a new resource for understanding brain development and function, J. Neurosci. 2008 28(1) 264-78.
- [19] J.P. Doyle, J.D. Dougherty, M. Heiman, E.F. Schmidt, T.R. Stevens, G. Ma, S. Bupp, P. Shrestha, R.D. Shah, M.L. Doughty, S. Gong, P. Greengard, N. Heintz, Application of a translational profiling approach for the comparative analysis of CNS cell types, Cell (2008) 135(4) 749-62.
- [20] C.Y. Chung, H. Seo, K.C. Sonntag, A. Brooks, L. Lin, O. Isacson Cell type-specific gene expression of midbrain dopaminergic neurons reveals molecules involved in their vulnerability and protection. Hum. Mol. Genet. (2005) 14: 1709–1725.
- [21] P. Arlotta, B.J. Molyneaux, J. Chen, J. Inoue, R. Kominami et al. (2005) Neuronal subtype-specific genes that control corticospinal motor neuron development in vivo, Neuron 45: 207–221.
- [22] M. Heiman, A. Schaefer, S. Gong, Peterson JD, Day M, Ramsey KE, Suárez-Fariñas M, Schwarz C, Stephan DA, Surmeier DJ, P. Greengard, N. Heintz, (2008) A translational profiling approach for the molecular characterization of of CNS cell types, Cell 135: 738–748.
- [23] K. Sugino, C.M. Hempel, M.N. Miller, A.M. Hattox, P. Shapiro, C. Wu, Z.J. Huang, S.B. Nelson, Molecular taxonomy of major neuronal classes in the adult mouse forebrain, Nature Neuroscience 9, 99-107 (2005).
- [24] B.W. Okaty, K. Sugino, S.B. Nelson, A Quantitative Comparison of Cell-Type-Specific Microarray Gene Expression Profiling Methods in the Mouse Brain, PLoS One (2011) 6(1).
- [25] P. Grange, J.W. Bohland, H. Bokil, S. Nelson, B. Okaty, K. Sugino, L. Ng, M. Hawrylycz and P.P. Mitra, A cell-type based model explaining co-expression patterns of genes in the brain, [[arXiv:1111.6217] [q-bio.QM]].
- [26] C.K. Lee, S.M. Sunkin, C.C. Kuan, C.L. Thompson, S. Pathak, L. Ng, C. Lau, S. Fischer, M. Mortrud, C. Slaughterbeck, A. Jones, E. Lein, M. Hawrylycz, Quantitative methods for genome-scale analysis of in situ hybridization and correlation with microarray data, Genome Biol. (2008); 9(1): R23.
- [27] Research, Inc. CVX: Matlab software for disciplined convex programming, version 2.0 beta. http://cvxr.com/cvx, September 2012.
- [28] M. Grant and S. Boyd, Graph implementations for nonsmooth convex programs, Recent Advances in Learning and Control (a tribute to M. Vidyasagar), V. Blondel, S. Boyd, and H. Kimura, editors, pages 95-110, Lecture Notes in Control and Information Sciences, Springer, 2008. http://stanford.edu/boyd/graphdcp.html.
- [29] J.W. Bohland, H. Bokil, C.B. Allen, P.P. Mitra, The Brain Atlas Concordance Problem: Quantitative Comparison of Anatomical Parcellations, PLoS ONE (2009).
- [30] J.W. Bohland, H. Bokil, C.-K. Lee, L. Ng, C. Lau, C. Kuan, M. Hawrylycz, P.P. Mitra, Clustering of spatial gene expression patterns in the mouse brain and comparison with classical neuroanatomy, Methods, Volume 50, Issue 2, February 2010, Pages 105-112.
- [31] I. Menashe, P. Grange, E.C. Larsen, S. Banerjee-Basu and P.P. Mitra, Co-expression profiling of autism genes in the mouse brain, PLoS Comput. Biol. 9(7): e1003128.