Formation of Kinneyia via shear-induced instabilities in microbial mats
Abstract
Kinneyia are a class of microbially mediated sedimentary fossils. Characterised by clearly defined ripple structures, Kinneyia are generally found in areas that were formally littoral habitats and covered by microbial mats. To date there has been no conclusive explanation of the processes involved in the formation of these fossils. Microbial mats behave like viscoelastic fluids. We propose that the key mechanism involved in the formation of Kinneyia is a Kelvin-Helmholtz type instability induced in a viscoelastic film under flowing water. A ripple corrugation is spontaneously induced in the film and grows in amplitude over time. Theoretical predictions show that the ripple instability has a wavelength proportional to the thickness of the film. Experiments carried out using viscoelastic films confirm this prediction. The ripple pattern that forms has a wavelength roughly three times the thickness of the film. This behaviour is independent of the viscosity of the film and the flow conditions. Laboratory-analogue Kinneyia were formed via the sedimentation of glass beads, which preferentially deposit in the troughs of the ripples. Well-ordered patterns form, with both honeycomb-like and parallel ridges being observed, depending on the flow speed. These patterns correspond well with those found in Kinneyia, with similar morphologies, wavelengths and amplitudes being observed.
I Introduction
Biofilms are ubiquitous. Found in environments ranging from Antarctic ice Friedmann and Weed (1987); Thomas and Dieckmannm (2002) to the walls of deep sea hydrothermal vents Wolff (1977) and the human body Hall-Stoodley and Stoodley (2009), biofilms represent one of the earliest life forms on Earth. Recent discoveries provide evidence that fossils of microbial origin date back to 3,450 million years ago Allwood et al. (2006), suggesting that biofilms have been present throughout the majority of the Earth’s history.
Microbial mats can be seen as thick biofilms. They range in thickness from a few millimetres to a few centimetres, depending on the habitat, growth conditions and bacteria that form them Gerdes et al. (2000); Neu and Lawrence (1997). One of the most successful mat forming bacteria is cyanobacteria due to its large morphologic variability and capacity for biostabilisation (increasing sediment stability or reducing erosion) Gerdes (2007). However, mat formation is not limited to cyanobacteria and can result from organisms including bacteria, archaea Zolghadr et al. (2010), protozoans, algae de Brouwer et al. (2005) and fungi Verstrepen and Klis (2006). The term ‘microbial mat’ will be used here to describe any macroscopic cohesive microbial community growing on, adhering to, or enmeshing an inorganic substrate Krumbein et al. (2003).
Modern microbial mats are commonly found growing on rock, soil and granular carbonatic and siliciclastic surfaces in water-based habitats and are preferentially observed to grow in the intertidal to lower supratidal zones of riverine and marine environments Gerdes et al. (2000); Gerdes (2007) as well as hypersaline lagoons Allen et al. (2009). Microbial mats can enhance stabilisation of sandy substrata via the secretion of adhesive mucilages, which glue the sediment grains together, reducing the erodability of the sediment Schieber (2007); Gehling (1999); Pfluger (1999); Noffke et al. (2001); Paterson (1994). The prevalence of biofilm systems, in particular cyanobacteria, have made them successful at leaving traces in sediments. This is readily observed in the host sediments of modern microbial mats Gerdes (2007).
Microbially induced sedimentary structures (MISS) can be grouped depending on the role that the microbial mat had in the formation process Noffke (2010) and arise from physical processes including biostabilisation Cuadrado et al. (2011), baffling and trapping Black (1933); Reid et al. (2000), binding Noffke et al. (2008) and growth Aref (1998); Gerdes et al. (2000). The patterns and structures arise due to the presence of microbial mats. In the absence of a mat no structures are expected to form. MISS are highly diverse Noffke (2011), with features ranging from the millimetre to metre length scales. They include wrinkle structures, palimpsest ripples, roll up structures and laminar structures Noffke et al. (2001, 1996). Recently Bouougri and Porada Bouougri and Porada (2012) documented various structures including crack patterns and crumpled layers, which form when strong winds blow over microbial mats. While chemical processes are not considered here, recent studies on modern microbial mats have shown that microbially mediated mineral precipitation is important for the preservation of sedimentary structures Cuadrado et al. (2012); Darroch et al. (2012). In siliciclastic environments precipitation of hydrated alumino-silicates from the mats may also result in cementation and lithification of the surrounding sediments, potentially also playing a stabilizing role in fossil preservation Meyer et al. (2012); Anderson et al. (2011); Laflamme et al. (2011).
I.1 Fossilised microbial mats
Structures similar to those observed in modern living mats are also observed in the ancient geologic record Bouougri and Porada (2007); Gerdes (2007); Noffke (2010). Sedimentary features in the clastic sedimentary rock records from the Precambrian era point towards the prevalence of microbial mats during this part of the Earth’s history, particularly in storm-affected subtidal environments and the intertidal zone Mata and Bottjer (2009); Noffke (2010). The abundance of MISS on Precambrian, particularly Proterozoic, siliciclastic bedding planes suggests that microbial mats were widespread at that time Bose et al. (2012). The absence of metazoan grazing and bioturbation may also have made it more likely that mats from this period were preserved Seilacher (1999). Microbially induced structures are also observed in Phanerozoic siliciclastic sediments Mata and Bottjer (2009), although not as widely as in the Proterozoic geologic record Porada and Bouougri (2007); Samanta et al. (2011); Eriksson et al. (2012); Parizot et al. (2005); Noffke (2010).
The presence and influence of microbial mats can be inferred from sediment properties that are uncharacteristic of sand and mud deposited via a purely physical process Schieber (1999); Cuadrado et al. (2012); Dupraz et al. (2009); Bailey et al. (2006); Bouougri and Porada (2002). In ancient siliciclastic biolaminates, former microbial mats are indicated by darker layers rich in iron-oxides, black carbonaceous materials Bouougri and Porada (2007); Noffke (2010); Noffke et al. (2002) and pyrite Pfluger and Gresse (1996). These compounds are produced in modern mats by the metabolic activity of micro-organisms living in and below the mat Dupraz et al. (2004); Sarkar et al. (2008); Schieber and Glamoclija (2007). In sediments below and above the mat layers, isolated sedimentary grains and mica flakes surrounded by sericitic layers have been attributed to the presence of microbial mats and bacteria, which trapped and bound the grains Black (1933); Noffke et al. (2003a); Draganits and Noffke (2004). Isolated and orientated sediment grains can indicate biofilms, which initially formed around the grains and have subsequently grown into full mats, rotating and trapping grains in the process Noffke et al. (1997); Noffke (2011). Other microbial mat signatures include the presence of tunnel patterns by undermat miners Crimes and Germs (1982); Gingras et al. (2011), structures related to mat growth and destruction processes, such as shrinkage cracks Schieber (1999) and wavy laminae. In some cases fossilised microbial filaments Noffke et al. (2003b); Callow and Brasier (2009), biomat fragments Steiner and Reitner (2001) and microbial death masks can also act as indicators Darroch et al. (2012).
I.2 Physical properties of modern microbial mats
The presence of microbial mats has been preserved in the ancient geologic record. However, deriving or deducing their exact material properties from fossil findings is not possible. This makes clear-cut statements about the behaviour and properties of ancient microbial mats problematic. Modern microbial mats are dense, cohesive organic layers that act as a single unit. They are formed of microbes held together by extracellular polymeric substances (EPS) Wingender et al. (1999), which participate in the binding of cells and the formation of microbial aggregates. EPS act as a cohesive gel-like network, provide a scaffold for the cells and make up 50-90% of the total organic material in the film Flemming and Wingender (2010). EPS have a number of functions Flemming and Wingender (2010). They are responsible for adhesion of the mat to surfaces Donlan (2002) and provide mechanical stability for the microbial colony Mayer et al. (1999). EPS can also stabilise clastic sediment surfaces Schieber (2007).
The composition, chemical and physical properties of EPS, and therefore microbial colonies, can vary widely. Recent investigations of modern microbial mats however, have revealed some well conserved features. Modern microbial mats behave like viscoelastic films Vinogradov et al. (2004); Rupp et al. (2005); Shaw et al. (2004); Lieleg et al. (2011); they undergo both reversible elastic responses and irreversible deformation. For example, microbial colonies grown for long periods under turbulent flow conditions have been known to display a rippled surface texture Stoodley et al. (1999). Lieleg et al. Lieleg et al. (2011) have shown that biofilms display elastic-like responses for high frequency stimuli and viscous-fluid responses when low frequency stimuli are applied. In the context of microbial mats, this means that for short term exposure of the mat to shear stress the mat responds elastically; when the applied stress is removed the mat returns to its original shape. For sustained exposure to shear stress, on the other hand, internal physical stresses are dissipated through viscous flow. This reduces the possibility of structural failure and uncontrolled detachment of the mat under shear. The shear modulus G and viscosity of microbial mats are seen to vary over seven orders of magnitude Shaw et al. (2004). However, the stress relaxation time is strikingly well conserved across a wide range of biofilms and found to be approximately 18 min. The timescale is essentially the time over which a biofilm, deformed by external forces, will ‘forget its original shape’.
From these observations two general conclusions about the properties of microbial mats can be made Shaw et al. (2004). Firstly, microbial mats behave as viscoelastic films, with little or no influence from biological processes on short time scales. This suggests that the physical properties are solely determined by the EPS. Secondly, the relaxation time of the viscoelastic medium is universally about 18 mins, the typical lifetime of the temporary crosslinks in the EPS.
Comparison between modern and ancient microbial structures suggest that ancient microorganisms existed with the same diversity as today Noffke (2010). It is not unreasonable therefore that ancient and modern microbial mats shared similar general material characteristics. For the purpose of this paper it is assumed that ancient microbial mats can be modelled as viscoelastic polymeric materials with viscosities and relaxation times similar to those of modern microbial mats. The properties of the polymer films are given in section III A.
I.3 Kinneyia
Wrinkle and ripple-like structures are perhaps the most documented microbially mediated sedimentary structures Porada and Bouougri (2007); Mata and Bottjer (2009); Pruss et al. (2004); Parizot et al. (2005); Noffke et al. (2001). Observed wrinkle-structures have widely varying morphologies, characteristics, formation processes and preservation modes. Patterns can develop in positive or negative relief Banerjee and Jeevankumar (2005) and can occur on or within the rock bed Noffke et al. (2001). There are many different hypotheses as to how wrinkle structures formed, but all agree that a cohesive mat is present at the sediment surface. This is confirmed by the observation of a large variety of wrinkle structures in modern microbial environments Noffke (2010); Gerdes et al. (1993); Noffke (1999, 1998).
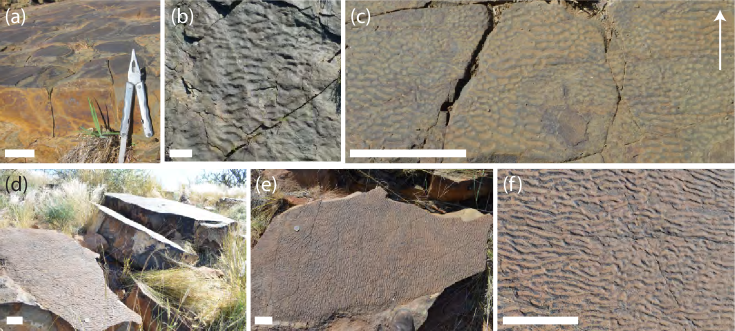
The focus of this paper is Kinneyia. To avoid confusion with other types of wrinkle structures, here only Kinneyia as defined by Porada et al. Porada et al. (2008) are considered. Kinneyia are a sub-class of sedimentary fossils with clearly defined ripple features (e.g. figure 1). Kinneyia are dominantly linear structures found on the upper bedding planes of sandstone or siltstone layers. These bedding layers are much thicker than the amplitude of the Kinneyia pattern and are interpreted as storm or flood event deposits (figure 1a). The upper layer of the event deposit is generally observed to be covered with a thin topset veneer thought to have sedimented after the event deposit at high flow velocity and shallow water depths. Thin sections made from Kinneyia from Sweden Porada et al. (2008) show that the depth of the veneer is proportional to the amplitude of the ripple structure, with the bottom of the veneer layer coinciding with the troughs of the Kinneyia.
The Kinneyia pattern is characterised by an undulating ripple-like structure (figure 1c) with a wavelength on the millimetre to centimetre scale (2-20 mm). The ripple shape deviates slightly from a sinusoidal wave, with flattened crests and rounded troughs most commonly described in the literature. However, rounded and even sawtooth-shaped crests are also seen Porada et al. (2008). The relative widths of the troughs and the ridges varies widely from sample to sample Pfluger (1999). The ripple-pattern is generally well ordered with the crests orientated parallel to one another. Honeycomb-like patterns with round or elongated pits are also seen with the two morphologies often coexisting on different areas of the same sample Porada and Bouougri (2007); Hagadorn and Bottjer (1999). The Kinneyia patterns often have one preferred crest orientation. In Kinneyia from Öland, this orientation was observed to run perpendicular to the paleocurrents from which the event layers were deposited Martinsson (1965). However, in some examples a second orientation direction is observed at to the first Porada et al. (2008). This led Porada et al. to suggest that some interference phenomena is involved in their formation Porada et al. (2008).
I.4 Suggested mechanisms for Kinneyia formation
Initially, it was assumed that an abiotic mechanism was responsible for the ripple-like patterns observed in Kinneyia. Proposed mechanisms range from perturbation of cohesive sediments in shallow water by wind Singh and Wunderlich (1978), to erosion of sediments by waves Shrock (1948) and foam induced patterns Allen (1966). However, none of these mechanisms satisfactorily explain the observed Kinneyia ripple patterns. Hagadorn and Bottjer Hagadorn and Bottjer (1997, 1999) were the first to suggest that the formation of wrinkle-structures and Kinneyia may in some way involve microbial mats. This assumption was made due to the observed decrease in grain density near the surface of the wrinkled sedimentary fossils, which suggested that sediments were bound at the surface by an organic matrix. The ripples of Kinneyia are often seen to have very steep sides, which it is suggested would be unstable without some ’glue’ or microbial mat to bind the grains together once a critical slope is reached. Hagadorn and Bottjer’s conclusion was also made due to the discovery of similar wrinkle patterns in modern microbial mats found growing in the Great Basin, USA Hagadorn and Bottjer (1999). The modern patterns had a wavelength of a few millimetres with both rounded and pointed ridges, which extend for tens of centimetres, being observed.
Pflüger went on to propose a microbially mediated gas bubble model for the formation of Kinneyia Pfluger (1999). He suggested that gas rising from a sedimentary substrate can be trapped by a microbial mat, and collect to form bubbles. Using a mixture of water-saturated sand and sodium bicarbonate, Pflüger was able to directly observe a process whereby the bubbles destabilize the sediment leaving trace patterns. Gas domes, polydisperse round shapes up to tens of centimetres in diameter, are observed in modern and ancient microbial mats Gerdes (2007). However, gas domes are no longer thought to be responsible for the formation of Kinneyia, as their patterns do not correspond well with the well-defined elongated ridge and troughs structures of Kinneyia.
The most recent model for the development of Kinneyia is that of Porada et al., who proposed that the pattern forms in liquefied sediment confined beneath microbial mats. Like Pflüger Pfluger (1999), Porada et al. assumed that the microbial mats acts as a barrier to gas and groundwater trapped in the underlying sediment. Here however, the bacteria are assumed to form dispersed colonies in the sediments, where the mats have adhered and grown downwards. The gas then accumulates in pore spaces between the colonies, leading to a local anisotropy in the water saturated sediment on the microscale. Cyclic stressing, from oscillatory water flow, of the overlying microbial layer, causes the underlying sediments to liquefy. This is due to an oscillating pore pressure induced by the change in water depth with tide cycling. The liquefied sand layer is assumed to be several centimetres thick with the overlying mat being 3 cm thick. The oscillatory pressure changes induce ripple structures in both the liquefied sand and microbial mat. The wavelength of the ripples is on the order of 1 m for the sand and a few centimetres for the mat. The ripple pattern in the mat induces further local variations in the pore pressure causing seepage and grain lifting. If the liquefied sediment layer becomes very thin, then replication of the overlying small wavelength microbial ripples can occur in this underlying liquefied layer. This condition is satisfied periodically at the seaward boundary of the mat during each tidal cycle. This model requires a very specific number of criteria to be met, along with significant grain lifting, for the formation of Kinneyia on the scale of a few millimetres to centimetres to occur. When these conditions are not met, ripple patterns on the metre scale are instead predicted.
In the model of Porada et al. the small-scale ripple patterns are induced first in the overlying mat and then transferred into the underlying sediment. Observation of modern microbial mats, however, suggest that it is not always possible to make a clear distinction between these two layers. Mats are often seen to develop from biofilms which initially form around individual sediment grains and subsequently grow together into a thick layer. The sediments are thus an integral part of the microbial mat. This is particularly the case for mat growth after storm events.
Here we propose a simple model for the formation of Kinneyia ripple patterns, where the key mechanism is a Kelvin-Helmholtz instability (KHI) induced in the mat under flowing water. A KHI naturally gives rise to an undulating structure on the lengthscales typical of Kinneyia. Evidence from analogue experiments is presented and compared with detailed measurements of fossilised Kinneyia. It should be noted that our model does not contradict that of Porada et al., but is in fact indirectly implied, although not discussed.
II Formation of Kinneyia via a Kelvin-Helmholtz type instability
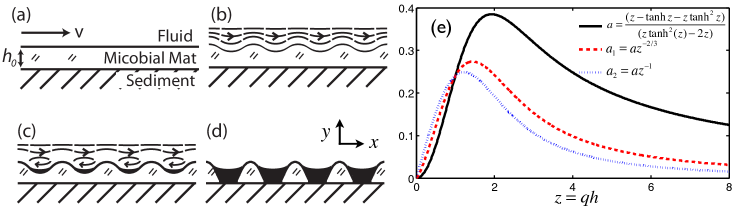
Kinneyia are generally found on upper bedding planes in littoral environments that have experienced recent storm deposits Porada et al. (2008). For the purposes of this model we shall therefore consider a planar microbial mat, or biofilm, on a solid substrate subject to some flow in the overlying fluid (figure 2a). The microbial mat is considered to behave as a viscoelastic fluid Shaw et al. (2004). The system can be approximated by two immiscible fluids (water and microbial mat), with different viscosities and flowing at different velocities over a rigid substrate. The question is then: what happens at the interface between these two fluids?
It is well known that spontaneous destabilisation of a fluid-fluid interface may occur in a two fluid system where the layers respond differently to shear. A well defined instability forms giving rise to a harmonic interfacial corrugation (figure 2b). This KHI occurs ubiquitously in nature Casanova et al. (2011); Hasegawa et al. (2004); Smyth and Moum (2012) for example in cloud layers Dalin et al. (2010). Typically, a KHI is studied using fluids of different densities, however, differences in viscosity also lead to instability.
The system being studied is sketched in figure 2. Water flows with far-field velocity in the -direction over a viscoelastic film of thickness . A flat film/water interface is a solution of the pertinent hydrodynamical equations, but an unstable one. Consider a small periodic perturbation at the interface between the two layers. Qualitatively the stream lines are compressed at the peaks and expanded at the valleys of the perturbation (figure 2b). Due to mass conservation, this requires an increased flow velocity at the peaks and a decreased velocity at the valleys. According to Bernoulli’s law this gives rise to a decrease in pressure at the crests and an increase in pressure in the valleys. The pressure differences drive flow in the film from troughs to peaks. Hence small thickness variations in the microbial mat can be amplified over time. For a small perturbation of the interface , where and is the wave number of the perturbation. The amplitude is assumed to vary slowly, such that the fluid dynamics can be treated quasi-statically. The velocity, , within the viscous layer of the mat is given by Stokes’ equation
| (1) |
where is the viscosity of the microbial mat and the pressure within it. The elastic response is neglected here, since only long time dynamics are being considered. The film is taken to be incompressible, such that everywhere. From this, it follows that . The base of the mat has no-slip boundary conditions, such that , while the upper boundary is taken to be free, such that .
Assuming separation of variables, the general solution to Laplace’s equation for the pressure in the mat is
| (2) |
where and are constants, which will be determined. The components of the velocity field that are consistent with the boundary conditions are
| (3) |
for some functions , . For an incompressible fluid the velocity field can be expressed by derivatives of a scalar stream function as . From this, and Eqn. 1, it is derived that and . The solution to this latter biharmonic equation yields
| (4) |
where , , and are constants. The no-slip lower boundary condition = = 0 implies that and . Combining Eqns. 1 – 4 the constants and are found to be and . The free boundary condition at gives
| (5) |
Thus
| (6) |
If the pressure at the interface is now taken to be
| (7) |
| (8) |
Introducing this back into Eqn. 4 gives
| (9) |
The equation of motion for the interface is . Thus, and . The growth rate is
| (10) |
The most rapidly growing mode is given by the maximum of . Since the expression in brackets is sharply peaked around , the maximum will not be strongly dependent on the exact form of .
To be more specific, however, an estimate for needs to be found. Calculating the pressure distribution above the perturbation exactly, requires the full boundary layer theory to be considered. A treatment of this problem was carried out by Bordner Bordner (1978). He found that the pressure scales as , where is the thickness of the disturbance sublayer in the fluid flowing above the mat. The expression for is given by
| (11) |
where is the mean surface shear stress at the boundary. and are the viscosity and density of the flowing liquid respectively. is then given by
| (12) |
The maximum of is then . Sediment deposited from the flowing water will accumulate in the troughs of the corrugation. The corresponding pressure contribution is then proportional to the wavelength, such that . This would yield a maximum of at . The expected value of should lie between these values, and depend on the relative strength of the contributions. These growth rate predictions are shown in figure 2e. In terms of the wavelength of the most unstable mode, an instability of wavelength approximately 4–5 times the mat thickness is predicted.
A Kelvin-Helmholtz type instability of a microbial mat therefore leads robustly to the formation of a ripple instability under any shear flow. The most unstable wavelength of the instability is predicted to be proportional to, and a few times, the film thickness, but is insensitive to either the fluid flow speed or mat viscosity. This complies well with the observation that Kinneyia patches often exhibit reduced wavelengths at their boundaries, where the mat can be assumed to have been thinner. Once the pressure variation is firmly established viscous flow within the film leads to an increasing corrugation amplitude. When the amplitude of the ripple reaches a certain threshold, eddies will form in the valleys of the undulation (figure 2c). Some of the clastic sediments carried by the overlying fluid as it flows, will settle in the troughs due to the back flow and stagnation points arising from the eddies. Accumulation of sediments in the troughs may also act as an additional driving force for the instability; the sediment is denser than the microbial mat and the surrounding water. The growth of the ripple pattern is thereby accelerated and steep slopes develop between the troughs and the crests. As the microbial mat dies, remains of the EPS glue the sediments together, preserving the Kinneyia structures that are found in the geologic record.
III Experimental procedure
To test the hypothesis that Kinneyia arise from KHIs in microbial mats, analogue experiments were carried out where the microbial mat was replaced with an abiotic polymeric viscoelastic film and subjected to flowing water.
III.1 Materials and methods
Experiments were carried out using a viscoelastic cross-linked poly(vinyl alcohol) (PVA) film. The PVA films were made by fully dissolving PVA (Sigma-Aldrich, molecular weight 145 kg/mol) in de-ionized (Millipore) water at C. The mixture was cooled and crosslinked using sodium borate solution (Borax, Sigma-Aldrich). The ratio of PVA to sodium borate was kept constant at 10:1 w/w. White paint (titania-based) was added to the PVA (2 g/100 ml) prior to crosslinking to create opaque films. PVA solutions of 3, 4 and 5% by weight were mixed. The rheological properties of the films were characterised, at C, using a parallel-plate rheometer (Stresstech, Rheosystems). Viscosities were measured in the linear regime for applied stresses of 0.01-100 Pa. The viscosities of the cross-linked solutions were measured to be Pa s, Pa s and Pa s for 3, 4 and 5% solutions respectively. The relaxation time of the PVA solutions were found to be 15-18 s, 115-338 s and 1200-1450 s respectively. The variation arises from small differences in PVA and sodium borate concentrations between subsequent batches of the solutions. A relaxation time of 1200-1450 s corresponds well with the properties of modern microbial mats, which are universally observed to have a relaxation time of around 1020 s Shaw et al. (2004). The viscosities of modern mats are seen to vary from 10-109 Pa s.
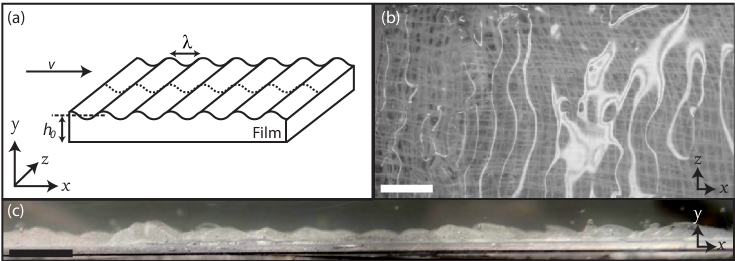
Two different flow setups were built to probe the behaviour of the films. A schematic diagram of a deformed PVA film subjected to water flow can be seen in figure 3a. The first setup consisted of a small flow cell (9 6 2 cm, x z y) connected to a fluid reservoir via a centrifugal pump. The PVA film was placed onto a porous glass substrate (Robu Glas) in the flow cell and left for 1 hr to relax. The height of the substrate could be altered, allowing the thickness of the film to be varied. A valve directly in front of the pump allowed the flow speed to be adjusted. Flow speeds of 0.05, 0.12, 0.18 and 0.24 m/s were used. Glass windows in the flow cell allowed optical observation of the ripple formation. The profile of the film was monitored in situ using an oblique 532 nm laser sheet and imaged every 60 s using a Nikon D5100 digital SLR camera mounted directly above the flow cell. The position of the laser line was extracted from the resulting images with a resolution of mm in the x-direction and mm in the z-direction. The wavelength was calculated from the first non-zero peak of the 1D autocorrelation function, the inverse fourier transform of the power spectrum, of the extracted laser line. The temperature of the reservoir varied from C between experiments, but was kept at C during each experiment using a Julabo FT402 temperature controller. All flow experiments were carried out at room temperature (C).
The second setup was a larger flow trough, allowing for a bigger sample (20 20 cm) to be observed. This setup was used to qualitatively observe how the patterns developed when sediments were added into the system. The sediments used were glass beads with a diameter of mm. Again the height of the substrate could be altered to change the thickness of the film. The upper water surface was in this case free. The thickness of the flowing water layer was cm depending on the flow speed. Experiments were run at flow speeds of 0.024, 0.085 and 0.17 m/s. Sediment was deposited uniformly (0.05 g/cm) over the PVA surface 60 s after the water flow had started. A camera directly above the sample was used to monitor the development of the instabilities.
III.2 Fossil measurements
For comparison with the experimental data, Kinneyia were studied from two sites in Namibia. Both sites date to the terminal Proterozoic Vingerbreek Member, Schwarzrand Subgroup, Nama Group. The first site was located at Haruchas farm, Namibia [24∘ 21’ 46.3” S; 16∘ 24’ 21.6” E] Noffke et al. (2002). The outcrop is approximately 3 6 m in area and is covered with small Kinneyia patches ranging in size from a few cm2 to around 400 cm2 (e.g. figure 1c). The Kinneyia cover 50-60% of the outcrop. The outcrop sits in a modern dry river bed on top of an event deposit cm thick (figure 1a). This deposit is thought to have arisen from a storm event Porada et al. (2008) and overlies an older rippled substrate, which indicates the flow direction. The older ripples run parallel to the Kinneyia ripples, but have a larger wavelength (10-20 cm) and a smoother sinusoidal undulation (see figure 1b). Examples of Kinneyia from this specific locality at Haruchas have previously been presented in the literature Porada et al. (2008).
The second fossil site was located at Neuras farm, Namibia [24∘ 24’ 11.3” S; 16∘ 15’ 8.7” E]. The Kinneyia here are found on two isolated rock outcrops located on a small cliff overlooking a river bed. In this case the event deposit on which the Kinneyia were observed was 35 cm thick. The structures observed at Neuras were more extensive than those at Haruchas and were seen to cover areas in excess of 1 m2. The source of the Kinneyia at Neuras could not be directly observed. However, both Neuras and Haruchas are located along the same storm-affected Proterozoic shoreline.
Replicas of the fossils were made to allow detailed measurements to be made without destroying or removing the outcrops. The areas were cleaned and then cast with Mold Star® pourable silicone rubber (Smooth-on). The rubber was left to cure for 45 min before being peeled back to create a negative replica mold of the underlying structure. Solid positive replicas were produced from these molds using Smooth-Cast® 300 (Smooth-on) in the laboratory.
Surface profile measurements of the Kinneyia were carried out using a stylus profilometer (Dektak XT Bruker). Areas 400-2500 mm2 were scanned to create 3D height maps. The 3D map was created by stitching together a series of 2D line traces taken at 50 µm intervals. The resolution in the line traces was 3 µm in the horizontal direction and 10 nm in the vertical direction. The 2D auto-correlation functions of the topographs were computed using Matlab. An angle-dependent auto-correlation function was found by averaging over any azimuthal angle . The orientation of the pattern was defined as the value of at which the radial auto-correlation function was at a maximum and the first non-trivial peak of the radial auto-correlation function as the wavelength of the Kinneyia ripples. The peak-to-trough amplitude of the ripples was measured directly from the line scans.
IV Results and Discussion
IV.1 Lab-made Kinneyia
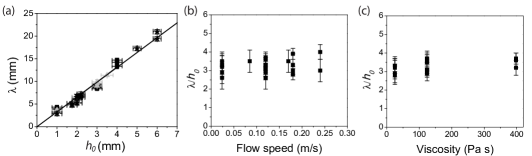
Ripple patterns are observed to form at the film/water interface in flat PVA films subjected to water flow conditions (figure 3b,c). These instabilities are visible within tens of seconds of flow initiation. The growth rate of the instabilities depends on the viscosity of the film. Figure 4a shows the wavelength of the instability that forms as a function of the film thickness . The wavelength was monitored using a laser sheet (figure 3a) and was found from the first non-zero peak of the 1D autocorrelation function of the deflected laser line. The data points in figure 4a are an average of the wavelengths calculated from successive images taken every 60 s over a 20-45 minute period. The error bars indicate the standard deviation in the wavelength measured from these images over the course of the experiment. For films with initial thicknesses of 1 to 4 mm, the wavelength of the ripple pattern that forms is 3 to 14 mm, respectively. The line in figure 4a shows a linear least-squares fit to the data with a confidence range of . No dependency of the wavelength on either the viscosity of the film or the flow rate is observed (figure 4b,c). This is in agreement with the theory presented here, which predicts that the wavelength is only dependent on the thickness of the film.
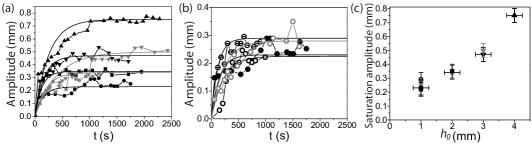
The growth of the interfacial ripples as a function of time is indicated in figure 5a. The peak-to-trough amplitude of the ripples was measured directly from the laser line. The amplitude grows with time, eventually saturating. The amplitude saturates on the same timescale as the relaxation time of the polymer. The saturation timescale was not observed to be dependent on the film thickness or the flow rate (figure 5a,b). The saturation amplitude varies linearly with the film thickness (figure 5c). A small increase in the saturation amplitude is observed with increasing flow rate (figure 5b). However, this increase is within the experimental error. The data shown in figure 5 were obtained by following the growth of individual ripples along the instability. While the amplitude should not be taken as an absolute value for all ripples formed under the given conditions, they are representative and show the trends observed in the experimental data.
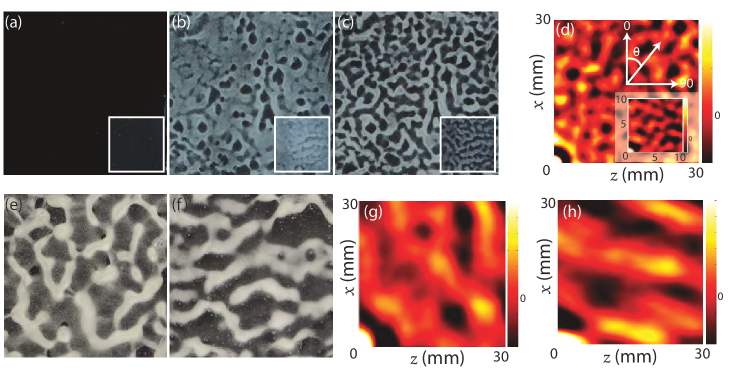
In our model of Kinneyia formation eddies in the ripple valleys lead to enhanced sedimentation (figure 2c). To test the effects of sedimentation in our PVA films, glass beads were added to the system while the water was flowing. The glass beads used were large enough for sedimentation to occur. As the instabilities developed, the beads collected in the troughs of the pattern (figure 6). The resulting, experimentally produced, PVA Kinneyia (hereafter lab-Kinneyia) that form are well-ordered and exhibit an interconnected pattern of elongated ridges. The same thickness-wavelength relationship observed in the other experiments (figure 4a) is found. Overspill of the PVA, from the sample chamber, leads to the development of patterns in regions with two different thicknesses on the same sample. The patterns that develop have the same morphology, but different wavelengths (inset figure 6b,c). This shows that Kinneyia patterns with different wavelengths can arise under the same flow conditions due to thickness variations across the sample.
Figure 6e, f shows the lab-Kinneyia that formed in 6 mm thick films at low and high flow speeds. The pattern in figure 6e is qualitatively similar, but with a longer wavelength, to that shown in figure 6c for the 2 mm thick film. The patterns in figure 6c and 6e were formed at the same flow speed. Increasing the flow speed appears to result in an increase in the order of the pattern, with a transition from honeycomb-like patterns to parallel ridges perpendicular to the flow direction. The increase in order is observed in the 2D autocorrelation functions of the resulting patterns (figure 6g,h). The patterns generated in the lab-Kinneyia shown in figure 6 qualitatively resemble the Kinneyia found in Namibia e.g. figures 1 and 7. The results suggest that the different patterns may arise from variations in the flow conditions under which the microbial mat or film is deformed.
IV.2 Kinneyia
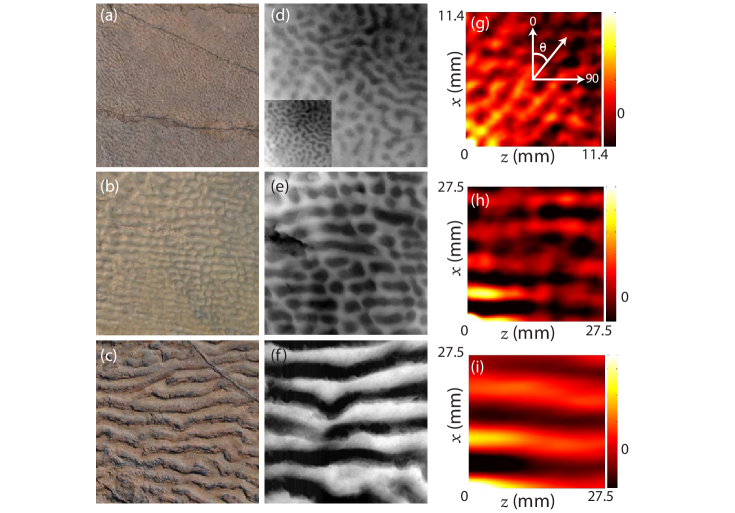
Figure 7 shows representative height profiles of the Kinneyia replicas made at Neuras and Haruchas. In each case images of the fossil (figure 7a-c) and map scan (figure 7d-f) are shown alongside the 2D autocorrelation function of the map scan (figure 7g-i) . Morphologies range from small circular-shaped patterns (figure 7a) to elongated ridges extending across the whole fossil (figure 7c). Intermediate patterns containing circular and elongated ridges are also seen (figure 7b).
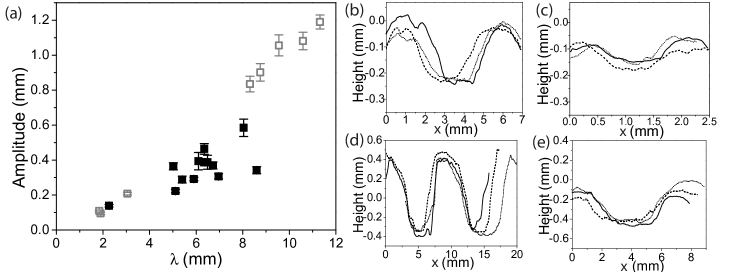
Analysis of the profilometry measurements from the Kinneyia can be seen in figure 8. The points in figure 8a give the wavelength and corresponding amplitude for each area scanned. The data show that as the wavelength of the ripple increases so to does the amplitude. This is in agreement with the trends observed in the analogue PVA flow experiments (figures 4 and 5). The amplitude measured from the fossils however, can only be taken as a lower limit for the amplitude of the instability when it first formed. Compaction after burial may have considerably decreased the amplitude of the ripples. In addition, the outcrops at Haruchas and Neuras are unprotected from the elements and subject to erosion. It is therefore likely that the original amplitude was higher. It is not possible however, to quantify the effects of either compaction or erosion. The amplitude of the Kinneyia ripples (figure 8a) are higher than those for the PVA experiments (figure 5). The PVA experiments from figure 5 do not take into account the effect of sedimentation, which was qualitatively observed to enhance the growth and break up of the ripples (figure 2d). Comparison of figure 8a and figure 4a suggests that the microbial mats involved in Kinneyia formation were mm thick. This thickness range corresponds well with the literature values for modern mats Neu and Lawrence (1997); Gerdes et al. (2000). While the original thickness of the ancient microbial mats involved in Kinneyia formation can not be measured directly from the fossils, these measurements suggest that the ancient microbial mats had similar thicknesses.
Example line traces from four Kinneyia samples are shown in figure 8b-e. Line scans for fossils with wavelengths varying from 1.8 to 10.6 mm are shown. The line scans in figures 8c and 8d correspond to the fossils shown in figures 7a and 7c respectively. It has previously been stated that Kinneyia ripples are characterised by sinusoidal waves with flattened crests and rounded troughs Porada et al. (2008), although no direct evidence for this has been provided. While in some cases the line scans do indicate flattened crests and rounded troughs (e.g. figure 8e), this morphology is not universal. Troughs and crests can be both “rounded” and “flattened”. However, in all cases a periodic wave is observed. When considering the shape of the ripples, in particular the shape of the crests, factors that may have altered their shape over time should be taken into account. It is not unreasonable to assume that rounded crests may become more flattened due to the effects of erosion or compaction. Erosion could presumably also lead to flattened crests becoming more rounded.
The orientation of the ripples was measured from the autocorrelation function of the three-dimensional map scans (figure 7g-i). For well-ordered ripples peaks are observed at and (e.g. figure 7h,i). Here 0∘ is defined to be perpendicular to the ripples (x-axis), while runs parallel to the ripples (z-axis), as indicated by the arrows in figure 7g. In well-ordered patterns the peaks at and correspond to the wavelength and mean extent of the ripples respectively. For more disordered ripples (e.g. figure 7a) additional peaks are observed at other angles in the two-dimensional autocorrelation function. The angle at which the additional peaks are observed defines an additional orientation direction of the ripples and is indicated by the arrow in figure 7g. varies slightly from sample to sample, but lies between 30∘ and 50∘ with a mean value of 335∘. A secondary orientation was also noted by Porada et al. Porada et al. (2008). A similar secondary orientation is observed in the lab-made Kinneyia shown in figure 6.
There are a number of possible origins for this secondary orientation, including multi-directional flows arising from tidal rips or differences in the forward motion of the tide and the subsequent backwash, changes in the flow direction or the presence of obstacles in the flow path. Another possibility is that the secondary orientation is induced by the ripples themselves. Pinning of the upper air/water surface to the PVA ripple crests is observed in the analogue PVA/sediment experiments when the amplitude of the ripple becomes comparable to the height of the flowing water layer. This induces small wakes, at the air/water interface, locally changing the flow direction of the water. Over time this secondary flow could influence the orientation of the ripples that form in the film. However, a full experimental and theoretical study of the 2D stability of Kinneyia ripples is beyond the scope of the current paper.
The robustness of the mechanism put forward here suggests that Kinneyia type structures should be abundantly found in modern biomats. However, wrinkle patternss are only very occasionally observed in modern biomats and generally have morphologies that differ from Kinneyia patterns. To resolve this apparent contradiction, one should bear in mind that, for some so far unknown reason, Kinneyia fossils are intimately linked to storm deposits, which represent rather scarse events. In fact, Kinneyia is a comparably rare fossil. In addition, the omnipresence of grazing animals and rapid bioturbation since the Cambrian may have rendered the conditions for Kinneyia formation increasingly unfavorable, to the point of their virtual absence today.
Another, very speculative but nevertheless interesting, line of thought concerns the rheological properties of biomats. Although modern biofilms may appear to be viscoelastic media to a rheometer, we know that active mechano-response is well conserved at least in modern eucaryotes. Strictly speaking, biomats must therefore be viewed as active matter, possibly stalling the instability observed in abiotic films. As we do not know the history of mechano-response evolution, the mechanical properties of biomats may have been, subtly but distinctly, different when Kinneyia fossils formed.
V Conclusions
Destabilisation of viscoelastic films under shear by flowing water results in the formation of sinusoidal ripple-like structures. The key process involved in the ripple formation is a Kelvin-Helmholtz instability, which arises from the spontaneous destabilisation of a fluid-fluid interface due to shear, when the two fluids have different viscosities. The wavelength of the ripples is dependent on the thickness of the film, but not on the film’s viscosity or the flow speed. Changes in the flow speed result in changes in the ordering of the ripples, with both honeycomb-like patterns and well-ordered parallel ripples being observed. The wavelength and morphology of the ripples corresponds well with the patterns seen in Kinneyia structues. The experimental results from the lab-Kinneyia suggest that the microbial mats involved in Kinneyia formation were mm thick. This fits well with the thicknesses of modern biofilms and microbial mats found in the literature Gerdes et al. (2000); Neu and Lawrence (1997).
The formation of Kinneyia via a Kelvin-Helmholtz instability accurately replicates the pattern formation process in viscoelastic microbial mats. The littoral areas where Kinneyia are frequently observed would have been perfect habitats for microbial mats to develop and grow. Storm events would have provided strong hydrodynamic flows, deforming the mats in an undulative manner and would also have provided the sediments necessary to preserve this pattern through rapid burial. Both the experiments and theoretical predications here suggest that Kinneyia-like rippling is a universal behaviour, explaining the abundance of Kinneyia in the ancient geologic record.
Acknowledgements.
The authors would like to thank Reinhold Wittig for his help when carrying out the field work in Namibia.References
- Allen [1966] J.R.L. Allen. A beach structure due to wind-driven foam. J. Sediment. Petrol., 37:691–692, 1966.
- Allen et al. [2009] M. A. Allen, F. Goh, B. P. Burns, and B.A. Neilan. Bacterial, archaeal and eukaryotic diversity of smooth and pustular microbial mat communities in the hypersaline lagoon of shark bay. Geobiology, 7:82–96, 2009. doi: 10.1111/j.1472-4669.2008.00187.x.
- Allwood et al. [2006] A. C. Allwood, M. R. Walter, B.S. Kamber, C.P. Marshall, and I.W. Burch. Stromatolite reef from the early archaean era of australia. Nature, 441:714–718, 2006. doi: 10.1038/nature04764.
- Anderson et al. [2011] E.P. Anderson, J. D. Schiffbauer, and S. Xiao. Taphonomic study of ediacaran organic-walled fossils confirms the importance of clay minerals and pyrite in burgess shale-type preservation. Geology, 39:643–646, 2011. doi: 10.1130/G31969.1.
- Aref [1998] M.A.M. Aref. Holocene stromatolites and microbial laminites associated with lenticular gypsum in a marine-dominated environment, Ras El Shetan area, Gulf of Aqaba, Egypt. Sedimentology, 45:245–262, 1998. doi: 10.1046/j.1365-3091.1998.00136.x.
- Bailey et al. [2006] J.V. Bailey, F.A. Corsetti, D.J. Bottjer, and K.N. Marenco. Microbially-mediated environmental influences on Metazoan colonization of matground ecosystems: Evidence from the lower Cambrian Harkless formation. Palaios, 21:215–226, 2006. doi: 10.2110/palo.2005-p05-51e.
- Banerjee and Jeevankumar [2005] S. Banerjee and S. Jeevankumar. Microbially originated wrinkle structures on sandstone and their stratigraphic context: Palaeoproterozoic Koldaha Shale, central India. Sediment. Geol., 176:211–224, 2005. doi: 10.1016/j.sedgeo.2004.12.013.
- Black [1933] M. Black. The algal sediments of Andros Island, Bahamas. Philos. T. .Roy. Soc.B, 222:165–192, 1933.
- Bordner [1978] G. L. Bordner. Nonlinear analysis of laminar boundary layer flow over a periodic wavy surface. Phys. Fluids, 21:8581471, 1978. doi: 10.1063/1.862409.
- Bose et al. [2012] P. K. Bose, P. G. Eriksson, S. Sarkar, D. T. Wright, P. Samanta, S. Mukhopadhyay, S. Mandal, S. Banerjee, and W. Altermann. Sedimentation patterns during the Precambrian: A unique record? Mar. Petrol. Geol., 33:34–68, 2012. doi: 10.1016/j.marpetgeo.2010.11.002.
- Bouougri and Porada [2002] E.H. Bouougri and H. Porada. Mat-related sedimentary structures in Neoproterozoic peritidal passive margin deposits of the West African Craton (Anti-Atlas, Morocco). Sediment. Geol., 153:85–106, 2002. doi: 10.1016/S0037-0738(02)00103-3.
- Bouougri and Porada [2007] E.H. Bouougri and H. Porada. Siliciclastic biolaminites indicative of widespread microbial mats in the Neoproterozoic Nama Group of Namibia. J. Afr. Earth Sci., 48:38–48, 2007. doi: 10.1016/j.jafrearsci.2007.03.004.
- Bouougri and Porada [2012] E.H. Bouougri and H. Porada. Wind-induced mat deformation structures in recent tidal flats and sabkhas of SE-Tunisia and their significance for environmental interpretation of fossil structures. Sediment. Geol., 263:56–66, 2012. doi: 10.1016/j.sedgeo.2011.12.011.
- Callow and Brasier [2009] R.H.T Callow and M.D. Brasier. Remarkable preservation of microbial mats in Neoproterozoic siliciclastic settings. Implications for Ediacaran taphonomic models. Earth-Sci. Rev., 96:297–219, 2009. doi: 10.1016/j.earscirev.2009.07.002.
- Casanova et al. [2011] J. Casanova, J. Jose, E. Garcia-Berro, S.N. Shore, and A.C. Calder. Kelvin-Helmholtz instabilities as the source of inhomogeneous mixing in nova explosions. Nature, 478:490–492, 2011. doi: 10.1038/nature10520.
- Crimes and Germs [1982] T.P. Crimes and G.J.B. Germs. Trace fossils from the Nama group (Precambrian-Cambrian) of southwest Africa. J. Paleontol., 56:890–907, 1982.
- Cuadrado et al. [2012] D.G. Cuadrado, N.B. Carmona, and C.N. Bournod. Mineral precipitation on modern siliciclastic tidal flats colonized by microbial mats. Sediment. Geol., 271-272:58–66, 2012. doi: 10.1016/j˙sedgeo.2012.06.005.
- Cuadrado et al. [2011] D.G. Cuadrado, N.B. Carmona, and C. Bournod. Biostabilization of sediments by microbial mats in a temperate siliciclastic tidal flat, Bahia Blanca estuary (Argentina). Sediment. Geol., 237:95 – 101, 2011. doi: 10.1016/j.sedgeo.2011.02.008.
- Dalin et al. [2010] P. Dalin, N. Pertsev, S. Frandsen, O. Hansen, H. Andersen, A. Dubietis, and R. Balcinus. A case study of the evolution of a Kelvin-Helmholtz wave and turbulence in noctilucent clouds. J. Atmos. Sol-terr. Phy., 72:1129–1138, 2010. doi: 10.1016/j.astp.2010.06.011.
- Darroch et al. [2012] S.A.F. Darroch, M. Laflamme, J.D. Schiffbauer, and D.E.G. Briggs. Experimental formation of a microbial death mask. Palaois, 27:293–303, 2012. doi: 10.2110/palo.2011.p11-059r.
- de Brouwer et al. [2005] J.F.C. de Brouwer, K. Wolfstein, G.K. Ruddy, T.E.R. Jones, and L.J. Stal. Biogenic stabilization of intertidal sediments: The importance of extracellular polymeric substances produced by benthic diatoms. Microb. Ecol., 49:501–512, 2005. doi: 10.1007/s00248-004-0020-z.
- Donlan [2002] R.M. Donlan. Biofilms: Microbial life on surfaces. Emerg. Infect. Dis., 8:881–890, 2002.
- Draganits and Noffke [2004] E. Draganits and N. Noffke. Siliciclastic stromatolites and other microbially induced sedimentary structures in an early Devonian Barrier-Island environment (Muth Formation, NW Himalayas). J. Sediment. Res., 74:191–202, 2004. doi: 10.1306/091903740191.
- Dupraz et al. [2004] C. Dupraz, P.T. Visscher, L.K. Baumgartner, and R.P. Reid. Microbe-mineral interactions: early carbonate precipitation in a hypersaline lake (Eleuthera Island, Bahamas). Sedimentology, 51:745–765, 2004. doi: 10.1111/j.1365-3091.2004.00649.x.
- Dupraz et al. [2009] C. Dupraz, R.P. Reid, O. Braissant, A.W. Decho, R.S. Norman, and P.T. Visscher. Process of carbonate precipitation in modern microbial mats. Earth-Sci. Rev., 96:141–162, 2009. doi: 10.1016/j.earscirev.2008.10.005.
- Eriksson et al. [2012] P.G. Eriksson, R. Bartman, O. Catuneanu, R. Mazumder, and N. Lenhardt. A case study of microbial mat-related features in coastal epeiric sandstones from the Paleoproterozoic Pretoria Group (Transvaal Supergroup, Kaapvaal craton, South Africa); The effect of preservation (reflecting sequence stratigraphic models) on the relationship between mat features and inferred paleoenvironment. Sediment. Geol., 263:67–75, 2012.
- Flemming and Wingender [2010] Hans-Curt Flemming and Jost Wingender. The biofilm matrix. Nat. Rev. Microbiol., 8:623–633, 2010. doi: 10.1038/nrmicro2415.
- Friedmann and Weed [1987] E.I. Friedmann and R. Weed. Microbial trace-fossil formation, biogenous, and abiotic weathering in the Antarctic cold desert. Science, 236:703–705, 1987. doi: 10.1126/science.11536571.
- Gehling [1999] J.G. Gehling. Microbial mats in Terminal Proterozoic siliciclastics: Ediacaran death masks. Palaios, 14:40–57, 1999.
- Gerdes [2007] G. Gerdes. Structures left by modern microbial mats in their host sediments. In J. Schieber, P.K. Bose, P.G. Eriksson, S. Banjeree, S. Sarkar, W. Altermann, and Catuneau O., editors, Atlas of microbial mat features preserved within the clastic rock record, pages 5–38. Elsevier, 2007.
- Gerdes et al. [1993] G. Gerdes, M. Claes, K. Dunajtschik-Piewak, H. Riege, W. Krumbein, and H.E. Reineck. Contribution of microbial mats to sedimentary surface structures. Facies, 29:61–74, 1993.
- Gerdes et al. [2000] G. Gerdes, T. Klenke, and N. Noffke. Microbial signatures in peritidal siliciclastic sediments: a catalogue. Sedimentology, 47(2):279–308, 2000. doi: 10.1046/j.1365-3091.2000.00284.x.
- Gingras et al. [2011] M. Gingras, J.W. Hagadorn, A. Seilacher, S.V. Lalonde, E. Pecoits, D. Petrash, and K.O. Konhauser. Possible evolution of mobile animals in association with microbial mats. Nat. Geosci., 4:372–375, 2011. doi: 10.1038/NGEO1142.
- Hagadorn and Bottjer [1997] J.W. Hagadorn and D.J. Bottjer. Wrinkle structures: Microbially mediated sedimentary structures common in subtidal siliciclastic settings at the Proterozoic-Phanerozoic transition. Geology, 25:1047–1050, 1997.
- Hagadorn and Bottjer [1999] J.W. Hagadorn and D.J. Bottjer. Restriction of a late Neoproterozoic biotope: Suspect-microbial structures and trace fossils at the Vendian-Cambrian transition. Palaios, 14:73–85, 1999. doi: 10.2307/3515362.
- Hall-Stoodley and Stoodley [2009] L. Hall-Stoodley and P. Stoodley. Evolving concepts in biofilm infections. Cell. Microbiol., 11(7):1034–1043, 2009. doi: 10.1111/j.1462-5822.2009.01323.x.
- Hasegawa et al. [2004] H. Hasegawa, M. Fujimoto, T.D. Pan, H. Reme, A. Boalogh, M.W. Dunlop, C. Hashimoto, and R. TanDokoro. Transport of solar wind into Earth’s magnetopshere through rolled up Kelvin-Hemholtz vortices. Nature, 430:755–758, 2004. doi: 10.1038/nature02799.
- Krumbein et al. [2003] W.E. Krumbein, U. Brehm, G. Gerdes, A. Gorbushina, G. Levit, and K.A. Palinska. Biofilm, biodictyon, biomat microbialites, oolites, stromatolites, geophysiology, global mechanism, parahistology. In Fossil and recent biofilms, pages 1–27. Kluwer Academic Publishers, 2003.
- Laflamme et al. [2011] M. Laflamme, J. D. Schiffbauer, D. E. G Briggs, and G. M. Narbonne. Microbial biofilms and the preservation of ediacara biota. Lethaia, 44:203–213, 2011. doi: 10.1111/j.1502-3931.2010.00235.x.
- Lieleg et al. [2011] O. Lieleg, M. Caldara, R. Baumgaertel, and K. Ribbeck. Mechanical robustness of Pseudomonas aeruginosa biofilms. Soft Matter, 7:3307–3314, 2011. doi: 10.1039/c0sm01467b.
- Martinsson [1965] A Martinsson. Aspects of Middle Cambrian Thanatotope on Öland. Geol. Foren. Stock. For., 87:181–230, 1965. doi: 10.1080/11035896509448903.
- Mata and Bottjer [2009] S.A. Mata and D.J. Bottjer. The paleoenvironment distribution of Phanerozoic wrinkle structures. Earth-Sci. Rev., 96:181–195, 2009.
- Mayer et al. [1999] C. Mayer, R. Moritz, C. Kirschner, W. Borchard, R. Maibaum, J. Wingender, and H.C. Flemming. The role of intermolecular interactions: studies on model systems for bacterial biofilms. Int. J. Biol. Macromol., 26:3 – 16, 1999. doi: 10.1016/S0141-8130(99)00057-4.
- Meyer et al. [2012] M. Meyer, J. D. Schiffbauer, S. Xiao, Y. Cai, and H. Hua. Taphonomy of the upper ediacaran enigmatic ribbon-like fossil shaanxilithes. Palaios, 27:354–372, 2012. doi: 10.2110/palo.2011.p11-098r.
- Neu and Lawrence [1997] T.R. Neu and J.R. Lawrence. Development and structure of microbial biofilms in river water studied by confocal laser scanning microscopy. FEMS Microbiol. Ecol., 24:11–25, 1997. doi: 10.1111/j.1574-6941.1997.tb00419.x.
- Noffke [1998] N. Noffke. Multidirected ripple marks from biological and sedimentological processes in modern lower supratidal deposits (Mellum Island, southern North Sea). Geology, 26:879–882, 1998.
- Noffke [1999] N. Noffke. Erosional remnants and pockets evolving from biotic-physical interactions in a Recent lower supratidal environment. Sediment. Geol., 123:175 – 181, 1999. doi: 10.1016/S0037-0738(98)00135-3.
- Noffke [2010] N. Noffke. Geobiology: Microbial mats in sandy deposits from the Archean era to today. Springer-Verlag Berlin Heidelberg, 2010.
- Noffke [2011] N. Noffke. A Modern Perspective on Ancient Life: Microbial Mats in Sandy Marine Settings from the Archean Era to Today. In S.D. Golding and M. Glikson, editors, Earliest Life on Earth: Habitats, Environments and Methods of Detection, pages 171–182. Springer Netherlands, 2011. doi: 10.1007/978-90-481-8794-2˙7.
- Noffke et al. [1996] N. Noffke, G. Gerdes, T. Klenke, and W.E. Krumbein. Microbially induced sedimentary structures - examples from modern sediments of siliciclastic tidal flats. Zbl. Geol. Palaeontol, 1:307–316, 1996.
- Noffke et al. [1997] N. Noffke, G. Gerdes, T. Klenke, and W.E. Krumbein. A microscopic sedimentary succession of graded sand and microbial mats in modern siliciclastic tidal flats. Sediment. Geol., 110:1 – 6, 1997. doi: 10.1016/S0037-0738(97)00039-0.
- Noffke et al. [2002] N. Noffke, A.H. Knoll, and J.P. Grotzinger. Sedimentary controls on the formation and preservation of microbial mats in siliciclastic deposits: A case study from the Upper Neoproterozoic Nama Group, Namibia. Palaois, 17:533–544, 2002.
- Noffke et al. [2003a] N. Noffke, G. Gerdes, and T. Klenke. Benthic cyanobacteria and their influence on the sedimentary dynamics of peritidal depositional systems (siliciclastic, evaporitic salty, and evaporitic carbonatic). Earth-Sci. Rev., 62:163–176, 2003a.
- Noffke et al. [2003b] N. Noffke, R. Hazen, and N. Nhleko. Earths earliest microbial mats in a siliciclastic marine environment. Geology, 31:673–676, 2003b. doi: 10.1130/G19704.1.
- Noffke et al. [2008] N. Noffke, N. Beukes, D. Bower, R.M. Hazen, and D.J.P. Swift. An actualistic perspective into Archean worlds -(cyano-)bacterially induced sedimentary structures in the siliciclastic Nhlazatse Section, 2.9 Ga Pongola Supergroup, South Africa. Geobiology, 6:5–20, 2008. doi: 10.1111/j.1472-4669.2007.00118.x.
- Noffke et al. [2001] N. Noffke, G. Gerdes, T. Klenke, and W.E. Krumbein. Microbially induced sedimentary structures - A new category within the classification of primary sedimentary structures. J. Sediment. Res., 71:649–656, 2001. doi: 10.1306/2DC4095D-0E47-11D7-8643000102C1865D.
- Parizot et al. [2005] M. Parizot, P.G. Eriksson, T. Aifa, S. Sarkar, S. Banerjee, O. Catuneanu, W. Altermann, A.J. Bumby, E.M. Bordy, J.L. Van Rooy, and A.J. Boshoff. Suspected microbial mat-related crack-like sedimentary structures in the Palaeoproterozoic Magaliesberg formation sandstones, South Africa. Precambrian Res., 138:274–296, 2005.
- Paterson [1994] D.M. Paterson. Microbial mediation of sediment structure and behaviour. In L.J. Stal and P. Caumette, editors, Microbial Mats, volume G35 of NATO ASI Series, pages 97–109. Springer Verlag, Berlin, 1994.
- Pfluger [1999] F. Pfluger. Matground structures and redox facies. Palaios, 14:25–39, 1999. doi: 10.2307/3515359.
- Pfluger and Gresse [1996] F. Pfluger and P.G. Gresse. Microbial sand chips - A non-actualistic sedimentary structure. Sediment. Geol., 102:263–274, 1996. doi: 10.1016/0037-0738(95)00072-0.
- Porada and Bouougri [2007] H. Porada and E. H. Bouougri. Wrinkle structures - a critical review. Earth-Sci. Rev., 81:199–215, 2007. doi: 10.1016/j.earscirev.2006.12.001.
- Porada et al. [2008] H. Porada, J. Ghergut, and E.H. Bouougri. Kinneyia-type wrinkle structures - Critical review and model of formation. Palaios, 23:65–77, 2008. doi: 10.2110/palo.2006.p06-095r.
- Pruss et al. [2004] S. Pruss, M. Fraiser, and D.J. Bottjer. Proliferation of early Triassic wrinkle structures: Implications for environmental stress following the end-Permian mass extinction. Geology, 32:461–464, 2004. doi: 10.1130/G20354.1.
- Reid et al. [2000] R.P. Reid, P.T. Visscher, A.W. Decho, J.F. Stolz, B.M. Bebout, D. Dupraz, I.G. Macintyre, H.W. Paerl, J.L. Pinckney, L. Prufert-Bebout, T.F. Steppe, and D.J. DesMarais. The role of microbes in accretion, lamination and early lithification of modern marine stromatolites. Nature, 406:989–992, 2000.
- Rupp et al. [2005] C.J. Rupp, C.A. Fux, and P. Stoodley. Viscoelasticity of Staphylococcus aureus biofilms in response to fluid shear allows resistance to detachment and facilitates rolling migration. Appl. Environ. Microbiol., 71:2175–2178, 2005. doi: 10.1128/AEM.71.4.2175-2178.2005.
- Samanta et al. [2011] P. Samanta, S. Mukhopadhyay, A. Mondal, and S. Sarkar. Microbial mat structures in profile: The Neoproterozoic Sonia Sandstone, Rajasthan, India. J. Asian Earth Sci., 40:542 – 549, 2011. doi: 10.1016/j.jseaes.2010.10.008.
- Sarkar et al. [2008] S Sarkar, P. K. Bose, P. Samanta, P Sengupta, and P.G. Eriksson. Microbial mat mediated structures in the Ediacaran Sonia Sandstone, Rajasthan, India and their implications from Proterozoic sedimentation. Precambrian Res., 162:248–263, 2008. doi: 10.1016/j.precamres.2007.07.019.
- Schieber [1999] J. Schieber. Microbial mats in terrigenous clastics: The challenge of identification in the rock record. Palaios, 14:3–12, 1999. doi: 10.2307/3515357.
- Schieber [2007] J. Schieber. Microbial mats on muddy substrates - Examples of possible sedimentary features and underlying processes. In J. Schieber, P.K. Bose, P.G. Eriksson, S. Banjeree, S. Sarkar, W. Altermann, and Catuneau O., editors, Atlas of microbial mt features preserved within the siliciclastic rock record. Elsevier, 2007.
- Schieber and Glamoclija [2007] J. Schieber and M. Glamoclija. Microbial mats built by iron bacteria: a modern example from southern Indiana. In J. Schieber, P.K. Bose, P.G. Eriksson, S. Banjeree, S. Sarkar, W. Altermann, and Catuneau O., editors, Atlas of microbial mat features preserved within the siliciclastic rock record. Elsevier, 2007.
- Seilacher [1999] A. Seilacher. Biomat-related lifestyles in the Precambrian. Palaios, 14:86–93, 1999.
- Shaw et al. [2004] T. Shaw, M. Winston, C.J. Rupp, I. Klapper, and P. Stoodley. Commonality of elastic relaxation times in biofilms. Phys. Rev. Lett., 93:098102, 2004. doi: 10.1103/PhysRevLett.93.098102.
- Shrock [1948] R.R. Shrock. Sequence in layered rocks. McGraw Hill, New York, 1948.
- Singh and Wunderlich [1978] I.B. Singh and F. Wunderlich. On the terms wrinkle marks (Runzelmarken), millimetre ripples and mini ripples. Senck. Marit., 10:75–83, 1978.
- Smyth and Moum [2012] W.D. Smyth and J.N. Moum. Ocean-mixing by Kelvin-Hemholtz instability. Oceanography, 25:140–149, 2012. doi: 10.5670/oceanog.2012.49.
- Steiner and Reitner [2001] M. Steiner and J. Reitner. Evidence of organic structures in Ediacara-type fossils and associated microbial mats. Geology, 29:1119–1122, 2001.
- Stoodley et al. [1999] P Stoodley, Z Lewandowski, J. D. Boyle, and H.M. Lappin-Scott. The formation of migratory ripples in a mixed species bacterial biofilm growing in turbulent flow. Environ. Microbiol., 1, 1999.
- Thomas and Dieckmannm [2002] D.N. Thomas and G.S. Dieckmannm. Antarctic sea ice - a habitat for extremophiles. Science, 295:641–644, 2002.
- Verstrepen and Klis [2006] K.J. Verstrepen and F.M. Klis. Flocculation, adhesion and biofilm formation in yeasts. Mol. Microbiol., 60:5–15, 2006. doi: 10.1111/j.1365-2958.2006.05072.x.
- Vinogradov et al. [2004] A.M. Vinogradov, M. Winston, C.J. Rupp, and P. Stoodley. Rheology of biofilms formed from the dental plaque pathogen Streptococcus mutans. Biofilms, 1:49–56, 2004. doi: 10.1017/S1479050503001078.
- Wingender et al. [1999] J. Wingender, T.R. Neu, and H.C. Flemming, editors. Microbial extracellular polymeric substances. Springer-Verlag Berlin Heidelberg, 1999.
- Wolff [1977] T. Wolff. Diversity and faunal composition of the deep-sea benthos. Nature, 267:780–785, 1977.
- Zolghadr et al. [2010] B. Zolghadr, A. Klingl, A. Koerdt, A.J.M. Driessen, R. Rachel, and S.V. Albers. Appendage-mediated surface adherence of Sulfolobus solfataricus. J. Bacteriol., 192:104–110, 2010. doi: 10.1128/JB.01061-09.