Resonant inelastic X-ray scattering study of intra-band charge excitations in hole-doped high- cuprates
Abstract
We have performed resonant inelastic x-ray scattering (RIXS) near the Cu- edge on cuprate superconductors La2-xSrxCuO4, La2-xBaxCuO4, La2-xSrxCu1-yFeyO4 and Bi1.76Pb0.35Sr1.89CuO6+δ, covering underdoped to heavily overdoped regime and focusing on charge excitations inside the charge-transfer gap. RIXS measurements of the 214 systems with keV have revealed that the RIXS intensity at 1 eV energy transfer has a minimum at and maxima at and for all doping points regardless of the stripe ordered state, suggesting that the corresponding structure is not directly related to stripe order. Measurements with keV on metallic La1.7Sr0.3CuO4 and Bi1.76Pb0.35Sr1.89CuO6+δ exhibit a dispersive intra-band excitation below 4 eV, similar to that observed in the electron-doped Nd1.85Ce0.15CuO4. This is the first observation of a dispersive intra-band excitation in a hole doped system, evidencing that both electron and hole doped systems have a similar dynamical charge correlation function.
pacs:
74.72.Gh, 78.70.Ck, 74.25.JbI Introduction
Among the many functional physical properties in strongly correlated electron systems, high- superconductivity continues to pose long-term challenges and attract many researchers. Elementary excitations in high- superconducting cuprates, such as spin and charge excitations, are important subjects in condensed matter physics not only for understanding superconductivity but also for a more fundamental understanding of strongly correlated electron systems.
To date, spin excitations in high- cuprates have been extensively studied by neutron scattering Birgeneau et al. (2006) and more recently by Resonant Inelastic X-ray Scattering (RIXS) at Cu- edge, Braicovich et al. (2010); Le Tacon et al. (2011); Dean et al. (2012) while charge excitations have been studied by optical spectroscopy Uchida et al. (1991) and RIXS at Cu- edge. Kim et al. (2002) In addition to its ability to determine the energy and momentum of excitations, recent RIXS studies at the Cu- edge have demonstrated the ability of RIXS to detect very low energy charge fluctuations in the (Y,Nd)Ba2Cu3O6+y system.Ghiringhelli et al. (2012) Moreover, the RIXS technique near the Cu- edge is sensitive to charge excitations triggered by the core hole potential in the intermediate state of the RIXS process. In fact, RIXS near the Cu- edge has been successfully utilized to measure charge excitations across the charge transfer (CT) gap in various strongly correlated electron systems, Kim et al. (2002); Abbamonte et al. (1999); Hasan et al. (2000); Lu et al. (2005); Ishii et al. (2005a, 2007) with excitation energy typically in 2-4 eV range, depending on the particular system and doping levels. One characteristic feature of the high- cuprates is that the continuum-like charge excitation appears inside the CT gap upon hole or electron doping. Wakimoto et al. (2005); Ellis et al. (2011) Recent technical developments towards finer energy resolution have enabled us to study this in-gap charge excitations in more detail.
High- cuprates are one of the most suitable systems to study charge excitations inside the CT gap since it can be approximated by a single-band model, and therefore making theoretical handling relatively easy. Ishii et al. Ishii et al. (2005b) have reported a dispersive intra-band excitation inside the CT gap in the electron-doped system Nd1.85Ce0.15CuO4. Based on comparison with theoretical calculations, they claimed that this dispersive excitation is consistent with the dynamical charge-charge correlation function . On the other hand, such a dispersive feature inside the CT gap has not been reported in hole-doped high- cuprates. Instead, it has been reported that the continuum-like excitation of La2-xSrxCuO4 near 1 eV at high-symmetry points increases with doping, Wakimoto et al. (2005); Ellis et al. (2011) showing an anomalous increase across the 1/8 doping point. Ellis et al. (2011) Our previous measurements showed that the charge excitation near 1 eV is enhanced at the and positions in stripe-ordered La1.875Ba0.125CuO4 and La1.88Ba0.12CuO4, while such behavior is absent in La1.92Ba0.08CuO4. Wakimoto et al. (2009)
In order to reconcile these experimental facts, we have carried out RIXS measurements near the Cu- absorption edge using single crystals of La2-x(Sr,Ba)xCuO4 (LSCO, LBCO) covering a wide hole concentration range from to , focusing on charge excitations inside the CT gap. We used Cu- edge RIXS since it is more sensitive to charge excitations than at other absorption edges. The measurements were carried out at nearly 90 degrees scattering angle with the scattered photon direction parallel to the incident photon polarization. This scattering geometry greatly reduces the elastic intensity and enables us to study RIXS spectra at low energies ( eV). We have found that the intensity of the charge excitation near 1 eV measured with incident photon energy keV has maxima around and for all doped samples, and this intensity increases monotonically with doping. We have also carried out RIXS measurements with keV for metallic LSCO x=0.30 and Bi1.76Pb0.35Sr1.89CuO6+δ (Bi2201). By subtracting both the elastic component and high-energy RIXS intensities, we have found that the charge excitation below 4 eV has a -dependence similar to the intra-band excitation observed in the electron-doped Nd1.85Ce0.15CuO4, suggesting that both electron and hole doped systems have a similar dynamical charge correlation function.
II Experimental procedure
Compositions used for the present study were La2CuO4, La2-xBaxCuO4 (LBCO) with and 0.125, La2-xSrxCuO4 (LSCO) with and 0.30, Bi1.76Pb0.35Sr1.89CuO6+δ (Bi2201), and La1.85Sr0.16Cu0.99Fe0.01O4 (Fe-doped LSCO). The last compound shows static incommensurate magnetic and charge order induced by the substitution of Cu2+ ions with Fe3+ ions. He et al. (2011) All crystals were grown by the travelling-solvent floating-zone method. As-grown crystals were cut into disk shapes with the -axis normal to the disk.
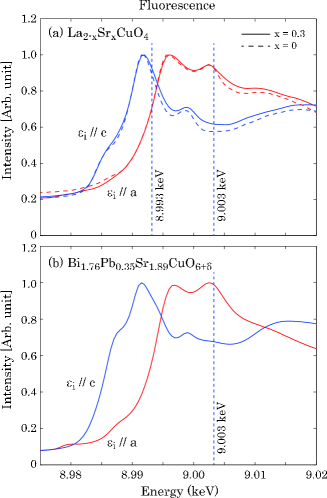
RIXS measurements for LSCO, LBCO and Bi2201 were made using the spectrometer at BL11XU beamline of SPring-8, and those for Fe-doped LSCO were made at the spectrometer at beamline 9-ID-B at the Advanced Photon Source, Argonne National Laboratory. For the measurements of LSCO and LBCO at BL11XU, the incident photon energies were either 8.993 or 9.003 keV. These energies are indicated in Fig. 1 (a) by two dashed vertical lines over the fluorescence spectra of LSCO and . Since the fluorescence spectrum is not very sensitive to hole-concentration, we have used the same incident energies across samples. For the measurements of Bi2201 at BL11XU, an incident photon energy of 9.003 keV was used. Again, this energy is indicated in Fig. 1 (b) over the fluorescence spectrum for Bi2201. For the measurements of Fe-doped LSCO at 9-ID B, we have used an incident phonon energy of 8.994 keV.
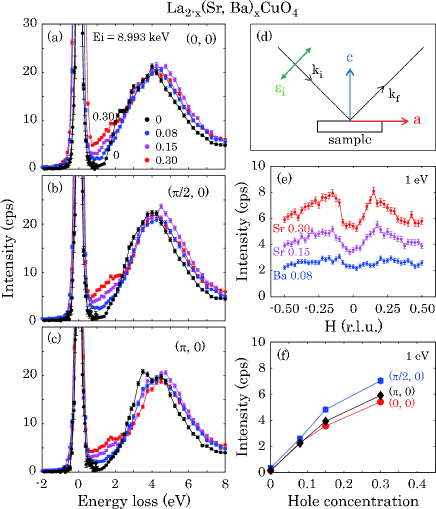
Scattering geometry used for all RIXS measurements is schematically drawn in Fig. 2 (d). Here, the plane in tetragonal notation is in the scattering plane. Since the compounds we studied are two dimensional systems, we assign the position as the -point , and the and positions as zone-boundaries and of the basal CuO2 plane, respectively. The scattering angle was kept at degrees by adjusting the -value so that the scattered photon direction is parallel to the incident photon polarization . This geometry reduces the elastic component, resulting in better access to low energy RIXS signals. The above geometry was be naturally achieved with the BL11XU spectrometer since it has a horizontal scattering arm, parallel to the horizontal . The 9-ID B spectrometer has a vertical scattering arm instead, so for these measurements we utilized a diamond phase plate to set vertical. For the experiments at BL11XU (9-ID B), a Si(111) monochromator, a secondary Si(400) (Si(444)) channel-cut monochromator, a bent Ge(337) analyzer, and a point silicon detector (a MYTHEN strip detector) were used. For both instruments, the energy resolution was meV.
We measured RIXS spectra by scanning the scattered photon energy while the incident photon energy was fixed near the Cu- edge. In addition, we measured the momentum transfer dependence of the RIXS intensity at fixed energy transfer. In this case, the incident beam angle with respect to the sample surface varies with momentum transfer. Following the argument by Pfalzer et al., Pfalzer et al. (1999) we multiplied the observed RIXS intensity by to correct for absorption so that RIXS intensities at different -positions can be directly compared. All measurements were done at K.
III Results
III.1 Measurements with keV
Our previous measurements of stripe-ordered LBCO and LSCO show an enhancement of RIXS intensity at eV near and , which corresponds to the stripe- positions. Wakimoto et al. (2009) In order to test if this is a unique feature of the striped phase, we have carried out systematic measurements with various dopings with incident photon energy keV.
Figure 2 (a)-(c) shows RIXS spectra for undoped LCO, LBCO x=0.08, LSCO x=0.15, and LSCO x=0.30, measured at the , , and positions. It is clearly shown that the RIXS intensity below eV increases with doping, as summarized in Fig. 2 (f) where RIXS intensity at 1 eV is plotted as a function of doping. Cu- edge RIXS results by Ellis et al. Ellis et al. (2011) using a (-polarization) set-up show that the increase of the RIXS intensity below eV coincides with the decrease of the shoulder of the CT peak near 3 eV. This behavior is not pronounced in the present results probably because of different polarization conditions, since in our scattering geometry we observe -polarization signals coincidentally.
To further complicate matters, the polarization dependence of the CT spectra in the carrier doped samples has not been fully understood yet. In this study we focus on the RIXS intensity below the CT gap, which appears to be qualitatively consistent between different polarization conditions.
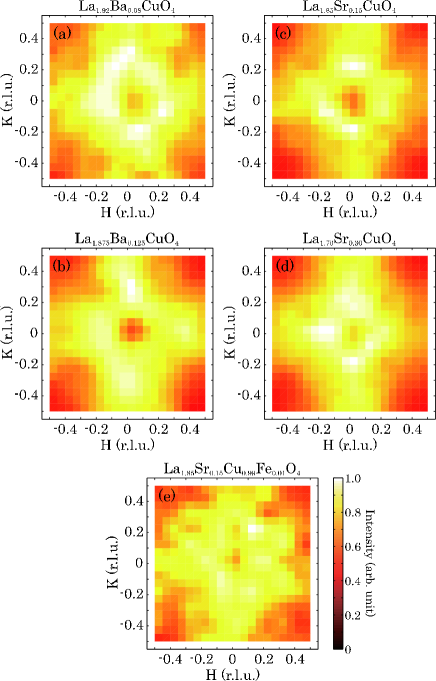
Figure 2 (e) shows RIXS profiles along -direction at 1 eV for LBCO , LSCO , and LSCO . As doping increases, the RIXS intensity increases and apparently a peak grows near , which corresponds to . Previously we report that the stripe ordered samples have an intensity maximum at . Wakimoto et al. (2009) However, those measurements were performed only for limited concentrations and at limited positions. Now, from the present detailed scan, it turns out that the maxima appear at the positions, and this structure appears not only in the stripe-ordered but also in the overdoped sample.
With more careful examination of Fig. 2 (e), small humps near also appear even in the LBCO sample. In order to test if the maximum structure is a common feature within the hole-doped 214 system, we performed mesh scans at eV for various concentrations and summarized the RIXS intensity maps in Fig. 3. Here the intensity is normalized to the maximum intensity in each mesh scan. It is seen that a ring-shaped intensity distribution resulting in intensity maxima near and appears in all LBCO and LSCO samples (Fig. 3 (a) to (d)). The Fe-doped LSCO data (Fig. 3 (e)) was obtained at 9-ID B by integrating the intensity in the energy range of eV. The ring-shaped structure also appears in this data, and therefore we can exclude spectrometer related extrinsic origin of the ring structure. Among these materials, LBCO and Fe-doped LSCO have charge-density-wave (CDW) orders: the former shows the magnetic and charge stripe orders below K, Fujita et al. (2004) and the latter shows spin-density-wave and CDW orders below 20 K. Thus, the ring structure is indeed a universal feature in the RIXS spectra measured with keV within the hole-doped 214 system regardless of the charge-stripe/CDW order.
III.2 Measurements with keV
The RIXS study of the electron-doped system Nd1.85Ce0.15CuO4 has revealed a dispersive intra-band charge excitation inside the CT-gap which is consistent with the dynamical charge-charge correlation function . Ishii et al. (2005b) To date, however, such intra-band excitation has not been identified in the hole doped systems. We have performed RIXS measurements for LSCO and overdoped Bi2201 with keV to detect such excitation. We chose these compounds for since RIXS intensity below the CT gap increases with doping, and therefore the system becomes more metallic. The present overdoped Bi2201 sample shows no superconductivity down to 2 K. We estimate that the hole concentration of this sample is more than 0.2/Cu, after the phase diagram of Pb-doped Bi2201 by Kudo et al. Kudo et al. (2009)
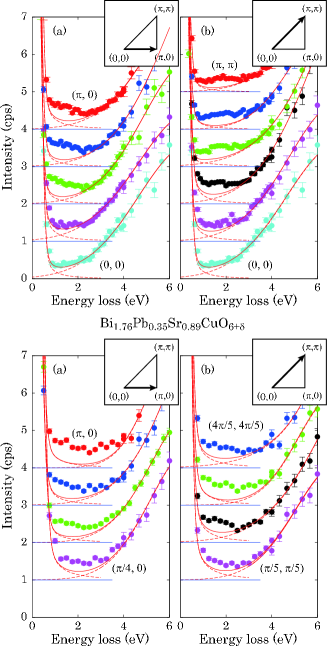
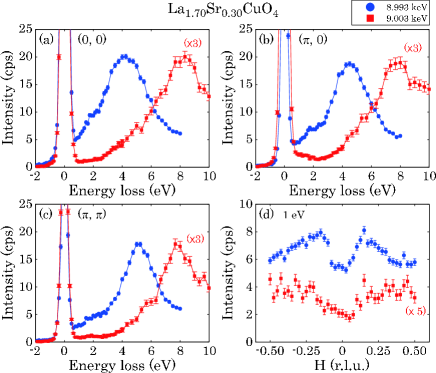
Figures 4 (a)-(c) show RIXS spectra of LSCO measured at and keV. The CT peak in the keV data, which disperses from 4 to 5 eV, is replaced by a peak at 8 eV in the 9.003 keV data. This non-dispersive excitation can be attributed to a molecular-orbital (MO) excitation. Kim et al. (2004) Although the overall RIXS intensity is smaller, the 9.003 keV data is preferable for evaluation of the intra-band excitation in the energy range below 4 eV since the MO peak is located at higher energy than the CT peak in the 8.993 keV data and the peak tail has a smaller effect in this energy range. Figure 4 (d) shows the -scan profiles measured at 1 eV energy transfer. A remarkable difference between the two different profiles is that the maximum structure at is not clear in the 9.003 keV data. However, both show that the intensity has a minimum at the point.
To extract intra-band excitation in the energy range below 4 eV, we have subtracted the elastic and MO peak components from the 9.003 keV spectra. The elastic tail was estimated from the anti-Stokes region. The MO peak tail was estimated by fitting the MO peak to a Gaussian function for the energy range above 4 eV. This is the same method used to extract the intra-band excitation described in Ref. Ishii et al., 2005b. Figure 5 shows the variation of spectra for LSCO ((a) and (b)) and Bi2201 ((c) and (d)) as changes from to and from to . The estimated elastic tail and MO peak components are indicated by dashed lines and their sum is shown as solid lines. For the data of LSCO in Figs. 5 (a) and (b), additional intensity above the solid line below 3 eV becomes observable as the -position departs from , while it is difficult to distinguish any additional intensity above the elastic tail and the MO components at . A similar behavior can be found in the data of Bi2201 in Figs. 5 (a) and (b). Here, the data at and are not shown since they are highly contaminated by a large elastic component, making the evaluation of the intra-band excitation for these points largely ambiguous. Nevertheless, for the remaining profiles, additional intensity above the solid lines is clearly recognizable.
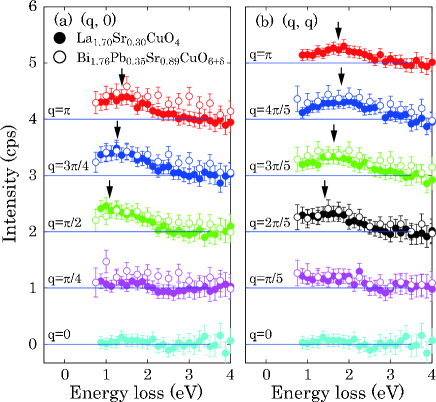
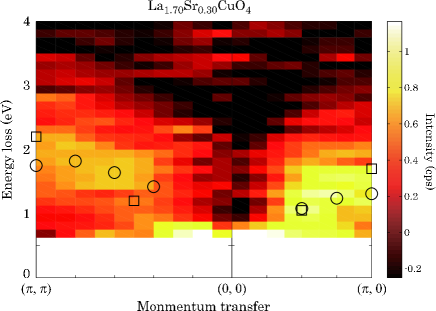
Remnant intensities after the subtraction of the elastic and MO components are summarized in Figs. 6 and 7. Figure 6 plots the remnant intensities at the -positions corresponding to those in Fig. 5. Data below 0.8 eV are removed since they are largely ambiguous due to the rapid increase of the elastic component in this energy region. The remnant intensities are nearly identical for the two samples, LSCO and overdoped Bi2201, suggesting that the observed feature is common in hole-doped systems. Arrows indicate the center of mass of the remnant intensity of LSCO determined by fitting the data to a Gaussian function. The center of mass tends to move to higher energy as increases, thus showing dispersion. Figure 7 shows a color map of the remnant intensities of LSCO . This intensity distribution remarkably resembles that of the dispersive intra-band excitation in NCCO. Ishii et al. (2005b) Here we indicate the center of mass positions by circles, together with those for NCCO indicated by squares, adopted from Ref. Ishii et al., 2005b. The intra-band excitation we have observed has a similar dispersion to that of NCCO, and thus, it is likely to have the same origin.
IV Discussion
Judging by our measurements with keV, we have identified a dispersive intra-band excitation in the hole doped systems, similar to that of the electron doped systems. The intra-band excitation in NCCO was attributed to the dynamical charge-charge correlation function . Similarly, it is natural to consider that the dispersive intra-band excitation we observe is the dynamical charge correlation function , therefore concluding that the electron and hole doped systems have similar . In fact, theoretical calculations indicate that has qualitatively similar -dependence in both electron- and hole-doped systems.Tohyama (2012); Jia et al. (2011)
It has been theoretically demonstrated that the indirect RIXS cross-section is linear with the dynamical charge correlation function at the limit where the short-lived, local core-hole potential is either weak or strong.van den Brink et al. (2006); Ament et al. (2007) On the other hand, Ishii et al.Ishii et al. (2005b) suggested that the intra-band excitation is pronounced in the RIXS spectra when the core hole is created at the carrier-doped site, and the spectra are similar to . Recently, Jia et al.Jia et al. (2011) examined detailed -dependences of the Cu- edge RIXS spectra for both hole and electron doped cuprates numerically and confirmed that the -type intra-band excitation becomes dominant in the RIXS spectra when the incident photon energy is tuned to the resonance energy of Cu sites where doped electrons/holes are located. In the electron doped case, this incident energy is located slightly below the well-screened condition, while in the hole doped case it is located slightly above the poorly-screened condition. This is consistent with the experimental fact in the present study that the type intra-band excitation of the hole-doped system was observed with the resonance energy near the poorly-screened condition, namely 9.003 keV. At these incident energies the core hole is created at the carrier-doped site and its potential does not perturb the valence electrons significantly, therefore this resonant condition is close to the aforementioned weak limit of the core-hole potential. These agreements with theoretical studies support our assertion that the dispersive intra-band excitation we observe arises from .
On the other hand, we also note some disagreements. In our measurements, the RIXS intensity around 1 eV decreases monotonically with increasing from 8.993 to 9.003 keV, while the main CT/MO peak shifts to higher energy. The incident energy of 9.003 keV we used provide a compromise between the disadvantage of decreasing intensity and the advantage of decreasing MO peak tail. However, theoretical calculations predict a monotonic increase of the contribution when changes from 8.993 to 9.003 keV, Jia et al. (2011) which disagrees with our observations. This implies that the RIXS intensity inside the CT gap in the 8.993 keV data contains appreciable contribution from another type of excitation. In this regard, Ellis et al. have hypothesized the excitation near 2 eV measured with 8.993 keV to be an inter-band excitation from a “low-lying” band below the Fermi energy to the Zhang-Rice band. The incident and final polarization conditions of x-ray photons may also affect the dependence of the RIXS intensity. However, RIXS spectra with keV taken with different polarization conditions, namely the present data and those reported in Ref. Ellis et al., 2011, are very similar. In addition, Chabot-Couture et al. Chabot-Couture et al. (2010) reported weak polarization dependence of the Cu- edge RIXS spectra of Nd2CuO4. Therefore, the polarization-dependence in cuprates is likely to be weak as well. Though polarization dependence is not taken into account in the theoretical calculations mentioned, the disagreement regarding the enhanced intensity of the intra-band region at keV between theory and our experiments can be hardly attributed to polarization effects. More detailed investigations are needed to understand the dependence of the intra-band intensity.
A characteristic feature in the 8.993 keV data is that the RIXS intensity profiles at 1 eV have maxima at in the entire hole-doping range. Previously we have hypothesized that this feature is related to the stripe ordered state,Wakimoto et al. (2009) but as we show here the maximum structure appears in all samples regardless of the existence of charge stripe order. Thus, it is unlikely that the maximum structure is originating directly from the stripe ordered phase. We have reported the enhancement of the Ni-K edge RIXS intensity near 0.5 eV at the stripe- positions in stripe ordered La5/3Sr1/3NiO4.Wakimoto et al. (2009) However, Simonelli et al.Simonelli et al. (2010) have reported the absence of such enhancements by equally sensitive RIXS measurements. Therefore, the stripe-originated charge excitation has not been confirmed in the nickelate case, either.
So far, however, we do not have enough experimental and theoretical clues to completely rule out the possibility that the maximum behavior in the cuprates arises from charge instability towards charge stripes. More RIXS studies of charge-ordered systems are necessary to elucidate the nature of charge fluctuations and charge order.
V Summary
We have carried out RIXS measurements near the Cu- absorption edge using hole-doped LSCO, LBCO and Bi2201, covering a wide hole-concentration range from undoped to overdoped, focusing on the charge excitations below the CT gap. Measurements with keV, which involves the well-screened intermediate state, have shown that the RIXS intensity near 1 eV has maxima at for all doped samples regardless of the presence of charge stripe order. This means that the maximum structure is not directly related to the charge stripe ordered state. Measurements with keV for overdoped LSCO and Bi2201 have revealed the existence of a dispersive intra-band excitation which is similar to that in the electron-doped NCCO. This excitation can be attributed to the dynamical charge-charge correlation function, which is then very similar for both the electron and hole-doped systems.
Acknowledgements.
We thank K. Tsutsui, T. Tohyama, D. Ellis, and T. Devereaux, for invaluable discussion. This work was supported by Grant-in-Aids from The Ministry of Education, Culture, Sports, Science and Technology (MEXT), Japan (No.22604007). The synchrotron radiation experiments were performed at the BL11XU at SPring-8 with the approval of the Japan Synchrotron Radiation Research Institute (JASRI) (Proposal No. 2009A3502, 2009B3502, 2010A3502, 2011B3502). Use of the Advanced Photon Source, an Office of Science User Facility operated for the U.S. Department of Energy (DOE) Office of Science by Argonne National Laboratory, was supported by the U.S. DOE under Contract No. DE-AC02-06CH11357.References
- Birgeneau et al. (2006) R. J. Birgeneau, C. Stock, J. M. Tranquada, and K. Yamada, J. Phys. Soc. Jpn. 75, 111003 (2006).
- Braicovich et al. (2010) L. Braicovich, J. van den Brink, V. Bisogni, M. M. Sala, L. J. P. Ament, N. B. Brookes, G. M. De Luca, M. Salluzzo, T. Schmitt, V. N. Strocov, et al., Phys. Rev. Lett. 104, 077002 (2010).
- Le Tacon et al. (2011) M. Le Tacon, G. Ghiringhelli, J. Chaloupka, M. M. Sala, V. Hinkov, M. W. Haverkort, M. Minola, M. Bakr, K. J. Zhou, S. Blanco-Canosa, et al., Nature Phys. 7, 725 (2011).
- Dean et al. (2012) M. P. M. Dean, R. S. Springell, C. Monney, K. J. Zhou, J. Pereiro, I. Bozovic, B. Della Piazza, H. M. Ronnow, E. Morenzoni, J. van den Brink, et al., Nature Mat. 11, 850 (2012).
- Uchida et al. (1991) S. Uchida, T. Ido, H. Takagi, T. Arima, Y. Tokura, and S. Tajima, Phys. Rev. B 43, 7942 (1991).
- Kim et al. (2002) Y.-J. Kim, J. P. Hill, C. A. Burns, S. Wakimoto, R. J. Birgeneau, D. Casa, T. Gog, and C. T. Venkataraman, Phys. Rev. Lett. 89, 177003 (2002).
- Ghiringhelli et al. (2012) G. Ghiringhelli, M. Le Tacon, M. Minola, S. Blanco-Canosa, C. Mazzoli, N. B. Brooks, G. M. De Luca, A. Frano, D. G. Hawthorn, F. He, et al., Science 337, 821 (2012).
- Abbamonte et al. (1999) P. Abbamonte, C. A. Burns, E. D. Isaacs, P. M. Platzman, L. L. Miller, S. W. Cheong, and M. V. Klein, Phys. Rev. Lett. 83, 860 (1999).
- Hasan et al. (2000) M. Z. Hasan, E. D. Isaacs, Z.-X. Shen, L. L. Miller, K. Tsutsui, T. Tohyama, and S. Maekawa, Science 288, 1811 (2000).
- Lu et al. (2005) L. Lu, G. Chabot-Couture, X. Zhao, J. Hancock, N. Kaneko, O. Vajk, G. Yu, S. Grenier, Y. Kim, D. Casa, et al., Phys. Rev. Lett. 95, 217003 (2005).
- Ishii et al. (2005a) K. Ishii, K. Tsutsui, Y. Endoh, T. Tohyama, K. Kuzushita, T. Inami, K. Ohwada, S. Maekawa, T. Masui, S. Tajima, et al., Phys. Rev. Lett. 94, 187002 (2005a).
- Ishii et al. (2007) K. Ishii, K. Tsutsui, T. Tohyama, T. Inami, J. Mizuki, Y. Murakami, Y. Endoh, S. Maekawa, K. Kudo, Y. Koike, et al., Phys. Rev. B 76, 045124 (2007).
- Wakimoto et al. (2005) S. Wakimoto, Y.-J. Kim, H. Kim, H. Zhang, T. Gog, and R. J. Birgeneau, Phys. Rev. B 72, 224508 (2005).
- Ellis et al. (2011) D. S. Ellis, J. Kim, H. Zhang, J. P. Hill, G. Gu, S. Komiya, Y. Ando, D. Casa, T. Gog, and Y.-J. Kim, Phys. Rev. B 83, 075120 (2011).
- Ishii et al. (2005b) K. Ishii, K. Tsutsui, Y. Endoh, T. Tohyama, S. Maekawa, M. Hoesch, K. Kuzushita, M. Tsubota, T. Inami, J. Mizuki, et al., Phys. Rev. Lett. 94, 207003 (2005b).
- Wakimoto et al. (2009) S. Wakimoto, H. Kimura, K. Ishii, K. Ikeuchi, T. Adachi, M. Fujita, K. Kakurai, Y. Koike, J. Mizuki, Y. Noda, et al., Phys. Rev. Lett. 102, 157001 (2009).
- He et al. (2011) R.-H. He, M. Fujita, M. Enoki, M. Hashimoto, S. Iikubo, S.-K. Mo, H. Yao, T. Adachi, Y. Koike, Z. Hussain, et al., Phys. Rev. Lett. 107, 127002 (2011).
- Pfalzer et al. (1999) P. Pfalzer, J.-P. Urbach, M. Klemm, S. Horn, M. L. denBoer, A. I. Frenkel, and J. P. Kirkland, Phys. Rev. B 60, 9335 (1999).
- Fujita et al. (2004) M. Fujita, H. Goka, K. Yamada, J. M. Tranquada, and L. P. Regnault, Phys. Rev. B 70, 104517 (2004).
- Kudo et al. (2009) K. Kudo, N. Okumura, Y. Miyoshi, T. Nishizaki, T. Sasaki, and N. Kobayashi, J. Phys. Soc. Jpn. 78, 084722 (2009).
- Kim et al. (2004) Y.-J. Kim, J. P. Hill, G. D. Gu, F. C. Chou, S. Wakimoto, R. J. Birgeneau, S. Komiya, Y. Ando, N. Motoyama, K. M. Kojima, S. Uchida, D. Casa, and T. Gog, Phys. Rev. B 70, 205128 (2004).
- Tohyama (2012) T. Tohyama (2012), eprint Private communication.
- van den Brink et al. (2006) J. van den Brink, and M. van Veenedaal Europhys. Lett. 73, 121 (2006).
- Ament et al. (2007) L. J. P. Ament, F. Forte, and J. van den Brink Phys. Rev. B 75, 115118 (2007).
- Jia et al. (2011) C. J. Jia, C. C. Chen, A. P. Sorini, B. Moritz, and T. P. Devereaux New J. Phys. 14, 113038 (2012).
- Chabot-Couture et al. (2010) G. Chabot-Couture, J. N. Hancock, P. K.. Mang, D. M. Casa, T. Gog, and M. Greven, Phys. Rev. B 82, 035113 (2010).
- Simonelli et al. (2010) L. Simonelli, S. Huotari, M. Filippi, N. L. Saini, and G. Monaco Phys. Rev. B 81, 195124 (2010).