THE MID-INFRARED AND NEAR-ULTRAVIOLET EXCESS EMISSIONS OF QUIESCENT GALAXIES ON THE RED SEQUENCE
Abstract
We study the mid-infrared (IR) and near-ultraviolet (UV) excess emissions of spectroscopically selected quiescent galaxies on the optical red sequence. We use the Wide-field Infrared Survey Explorer (WISE) mid-IR and Galaxy Evolution Explorer (GALEX) near-UV data for a spectroscopic sample of galaxies in the Sloan Digital Sky Survey Data Release 7 to study the possible connection between quiescent red-sequence galaxies with and without mid-IR/near-UV excess. Among 648 12 m detected quiescent red-sequence galaxies without H emission, 26% and 55% show near-UV and mid-IR excess emissions, respectively. When we consider only bright ( 21.5) galaxies with early-type morphology, the fraction of galaxies with recent star formation is still 39%. The quiescent red-sequence galaxies with mid-IR and near-UV excess emissions are optically fainter and have slightly smaller 4000 than those without mid-IR and near-UV excess emissions. We also find that mid-IR weighted mean stellar ages of quiescent red-sequence galaxies with mid-IR excess are larger than those with near-UV excess, and smaller than those without mid-IR and near-UV excess. The environmental dependence of the fraction of quiescent red-sequence galaxies with mid-IR and near-UV excess seems strong even though the trends of quiescent red-sequence galaxies with near-UV excess differ from those with mid-IR excess. These results indicate that the recent star formation traced by near-UV ( Gyr) and mid-IR ( Gyr) excess is not negligible among nearby, quiescent, red, early-type galaxies. We suggest a possible evolutionary scenario of quiescent red-sequence galaxies from quiescent red-sequence galaxies with near-UV excess to those with mid-IR excess to those without near-UV and mid-IR excess.
1 INTRODUCTION
It is well known that the distribution of nearby galaxies in the optical color-magnitude diagram is bimodal; quiescent, early-type galaxies populate a narrow red sequence and star-forming, late-type galaxies form a big blue cloud (e.g., Strateva et al. 2001; Blanton et al. 2003; Baldry et al. 2004; Balogh et al. 2004; Choi et al. 2007 and references therein).
Recent studies however reveal that the optical red sequence contains not only early-type galaxies with signs of recent star formation (e.g., Yi et al. 2005; Bressan et al. 2006; Schawinski et al. 2007; Clemens et al. 2009; Ko et al. 2009; Lee et al. 2010; Vega et al. 2010; Ko et al. 2012), but also late-type galaxies with optical colors reddened by dust extinction or with low level of star formation (e.g., Bamford et al. 2009; Gallazzi et al. 2009; Wolf et al. 2009; Masters et al. 2010; Ko et al. 2012). The presence of various types of galaxies on the red sequence is easily found when one examines these red-sequence galaxies at different wavelengths. The near-ultraviolet (UV) observations show a diversity of early-type galaxies depending on the amount of recent star formation (e.g., Ferreras & Silk 2000; Yi et al. 2005; Schawinski et al. 2007; Kaviraj et al. 2007). The mid-infrared (IR) observations also show that a significant fraction of nearby early-type galaxies has excess flux over the photospheric emission (e.g., Bressan et al. 2006; Clemens et al. 2009; Ko et al. 2009, 2012; Shim et al. 2011; Hwang et al. 2012).
The optical colors of galaxies can be red enough to join the red sequence just 12 Gyr after the stop of major episodes of star formation (e.g., Bower et al. 1998; Poggianti et al. 1999). However, previous studies of early-type galaxies on the red sequence showed the large scatter in the near-UV–optical color-magnitude diagrams, which cannot be explained without some amounts of recent star formation (e.g., Ferreras & Silk 2000; Deharveng et al. 2002). Thanks to the Galaxy Evolution Explorer (GALEX; Martin et al. 2005), it is generally accepted that the near-UV– optical color can be an excellent indicator of recent star formation ( 1 Gyr) even for a small amount of star formation (e.g., 1% of stellar mass). This is mainly because the near-UV light is much more sensitive to young stars than the bluest optical band. Balmer absorption lines are also useful indicators of recent star formation because they trace intermediate-age stars (strongest for A-type stars) that dominate the light of a galaxy 11.5 Gyr after active star formation stops (Dressler & Gunn 1983; Couch & Sharples 1987). Recently, Choi et al. (2009) studied the possible connection of the UV-excess early-type galaxies to E+A galaxies (i.e., post-starburst) using 1000 E+As selected from the Sloan Digital Sky Survey (SDSS; York et al. 2000) data. They found that the post-starburst systems such as E+As are characterized by the UV excess without H emission. They suggested that the Balmer absorption line used for identifying E+As can be replaced by near-UV–optical colors that are much sensitive to recent star formation.
The mid-IR emission from dusty circumstellar envelopes of asymptotic giant branch (AGB) stars is an also useful indicator of star formation history because it traces stars with ages from a few 0.1 Gyr up to the Hubble time; low- to intermediate-mass stars evolve into the AGB phase and their mid-IR emissions decrease with stellar age. Frogel et al. (1990) found that the contribution of AGB stars to the bolometric luminosity could be larger than 40% at ages from 1.1 to 3.3 Gyr, but rapidly decreases down to 5% at 10 Gyr. Recent stellar population models (e.g., Maraston 2005; Bruzual 2009) suggest that AGB stars with 0.11.5 Gyrs can contribute up to 50% of the -band light in galaxies. Although the understanding of AGB dust envelopes and their contribution to the mid-IR emission in a galaxy is far from complete (e.g., Marigo et al. 2008), recent mid-IR observations show that a significant fraction of early-type galaxies on the red-sequence have excess flux over photospheric emission (Ko et al. 2009, 2012; Shim et al. 2011; Hwang et al. 2012). Unusual polycyclic aromatic hydrocarbons (PAHs) are also detected in the mid-IR spectra of early-type galaxies (e.g., Kaneda et al. 2008; Vega et al. 2010; Panuzzo et al. 2011) even though the PAH emission is a typical feature of star-forming galaxies (e.g., Peeters et al. 2004). This unusual PAHs in early-type galaxies seems to result from because of material continuously released by intermediate-age carbon stars; these stars formed in a burst of star formation that occurred within the last few Gyrs (e.g., Vega et al. 2010). In summary, if the circumstellar envelopes of AGB stars are the main source of mid-IR emission in galaxies, the mid-IR emission is sensitive to star formation over relatively long ( 1 Gyr) timescales compared to spectroscopic star formation indicators such as nebular emission lines or Balmer absorption lines (Piovan et al. 2003; Salim et al. 2009; Kelson & Holden 2010; Donoso et al. 2012).
Around 1 Gyr after a single-burst of star formation, massive stars (O, B, and A stars) will be expired. The near-UV flux or H line index then is no longer a good tracer of star formation history in galaxies. However, the mid-IR emission can trace star formation over much longer timescales because low to intermediate mass (1 9 M⊙) stars evolve to the AGB phase, and their circumstellar dust emission is strong in the mid-IR. Therefore, the near-UV continuum and the mid-IR emission are complementary each other, and can provide a complete view of recent star formation history of galaxies.
In this paper, we study the various types of galaxies on the red sequence (i.e., optically quiescent without ongoing star formation) using near-UV and mid-IR data to understand the possible connection between them. Section 2 describes the observational data we use. We examine the near-UV and mid-IR properties of quiescent red-sequence galaxies in Section 3, and conclude in Section 4. Throughout, we use the AB magnitude system, and adopt flat CDM cosmological parameters: km s-1 Mpc-1, and .
2 THE DATA AND THE SAMPLE
2.1 Galaxy Catalog: SDSS, GALEX and WISE data
We used a spectroscopic sample of galaxies in the SDSS Data Release 7 (SDSS DR7, Abazajian et al. 2009). We complement these data with a photometric sample of SDSS galaxies whose redshift information is not available in the SDSS database, but available in the literature (Hwang et al. 2010).
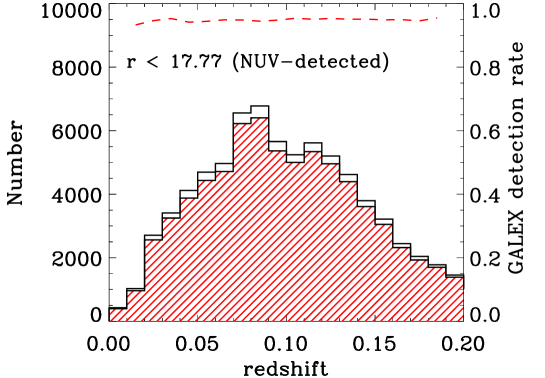
We adopted the GALEX data for these SDSS galaxies from the GALEX GR6111http://galex.stsci.edu/GR6 that provides the cross-matched table (xSDSSDR7) against the SDSS DR7. The matching tolerance is 5″(FWHM of the GALEX PSF). To avoid the contamination by nearby sources within the matching tolerance, we selected only unique matches: for a given SDSS galaxy, we choose one GALEX object that is the closest to the SDSS object and vice versa. We used only the sources covered by the Medium Imaging Survey (MIS) with a limiting magnitude of 22.7 (mag in AB) in the near-UV (Morrissey et al. 2005). Figure 1 shows the redshift distribution of the SDSS galaxies covered by GALEX MIS. Roughly 5% of the SDSS galaxies do not have GALEX counterparts; these galaxies seem faint in the near-UV, and their NUV colors are very red. Some of them might be because of dust extinction and/or higher disk inclination. To minimize the impact of those galaxies, we exclude galaxies with lower axis ratio (i.e., less than 0.6) in the following analysis.
We used the mid-IR data obtained by the WISE satellite, which covers all the sky at four mid-IR bands (3.4, 4.6, 12 and 22 m). The WISE all-sky source catalog222http://wise2.ipac.caltech.edu/docs/release/allsky/ contains photometric data for over 563 million objects. We identified WISE counterparts of the SDSS galaxies by cross-correlating them with the sources in the WISE all-sky data release with a matching tolerance of 3″( 0.5FWHM of the PSF at 3.4 m). We used the point source profile-fitting magnitudes, and restrict our analysis to the sources with 12 m flux density, mJy where the WISE photometric completeness is larger than 90 %. WISE 5 photometric sensitivity is estimated to be better than 0.08, 0.11, 1 and 6 mJy at 3.4, 4.6, 12 and 22 m in unconfused regions on the ecliptic plane (Wright et al. 2010).
We also used several value-added galaxy catalogs (VAGCs) drawn from SDSS data. We adopted the photometric parameters from the SDSS pipeline (Stoughton et al. 2002). We used Petrosian magnitudes for -band magnitudes of galaxies and model magnitudes for galaxy colors. We took the spectroscopic parameters including the 4000-Å break 4000, the Balmer absorption-line index H, and H equivalent width from the MPA/JHU DR7 VAGC333http://www.mpa-garching.mpg.de/SDSS/DR7/. We adopted galaxy morphology data and internal structure parameters (concentration index in -band and color gradient) from the Korea Institute for Advanced Study (KIAS) DR7 VAGC444http://astro.kias.re.kr/vagc/dr7/ (Choi et al. 2010). In this catalog, galaxies are divided into two morphological types based on their locations in the () color versus () color gradient space and in the -band concentration index space (Park & Choi 2005): early (ellipticals and lenticulars) and late (spirals and irregulars) types. The resulting completeness and reliability for the morphological classification reaches 90%. We performed an additional visual check of the color images of the galaxies misclassified by the automated scheme, and of the galaxies that are not included in the KIAS DR7 VAGC. In this procedure, we revised the types of blended or merging galaxies, blue but elliptical-shaped galaxies, and dusty edge-on spirals.
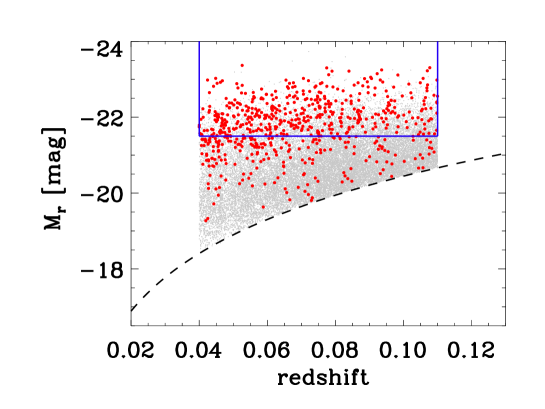
For the following analysis, we used the galaxies at 0.04 z 0.11 and 17.77 (magnitude limit for the SDSS main galaxy sample). Figure 2 shows -band absolute Petrosian magnitudes of 12 m selected galaxies with near-UV detection as a function of redshift (gray dots). Red filled circles are spectroscopically selected quiescent galaxies on optical red sequence (see the next section). We often use a volume-limited samples of galaxies with 21.5 and 0.04 z 0.11 (solid lines). At 0.04, SDSS spectroscopy is incomplete for bright galaxies due to the problem of small fixed-size aperture (Kewley et al. 2005). The visual inspection of galaxy morphology becomes uncertain with increasing redshift, so 0.11 is our upper limit (Kaviraj et al. 2007; Schawinski et al. 2007).
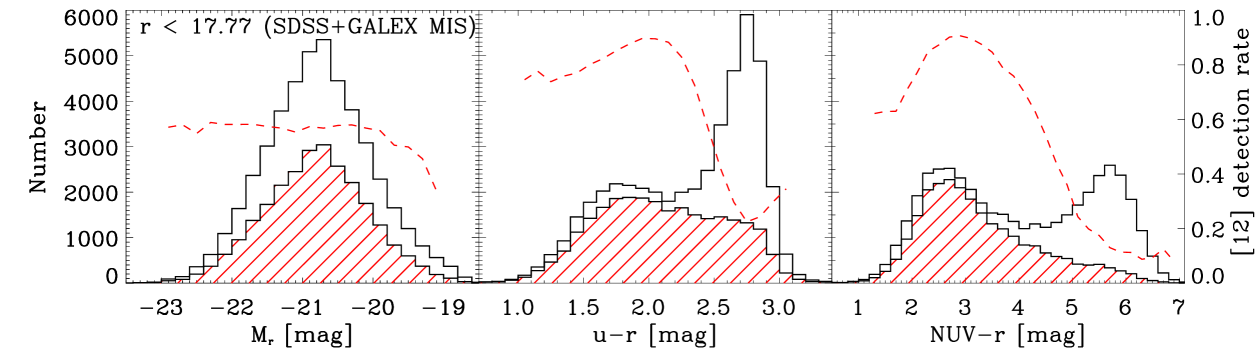
In Figure 3, we plot the distributions of absolute magnitude , color, and NUV- color for the SDSS galaxies covered by GALEX MIS. The hatched and open histograms indicate the galaxies with 12 m detection and those regardless of 12 um detection, respectively. The ratio of the two histograms represents the 12 m detection rate and is overplotted as a dashed line. The 12 m detection rate increases with -band luminosity at 20. However, it seems that the detection rate is nearly constant for galaxies at 20, which is mainly due to the bright, red galaxies with weak 12 m emission. In terms of colors, the detection rate decreases sharply at the red end because the red galaxies are likely to have weaker 12 m emission than the blue galaxies, irrespective of their luminosity. At the blue end, the detection rate is small because some fainter (less massive), blue galaxies are not detected because of -band magnitude limit. Interestingly, the detection rate peaks at intermediate colors (90%), consistent with Salim et al. (2009).
2.2 Sample: optically quiescent galaxies on the red sequence
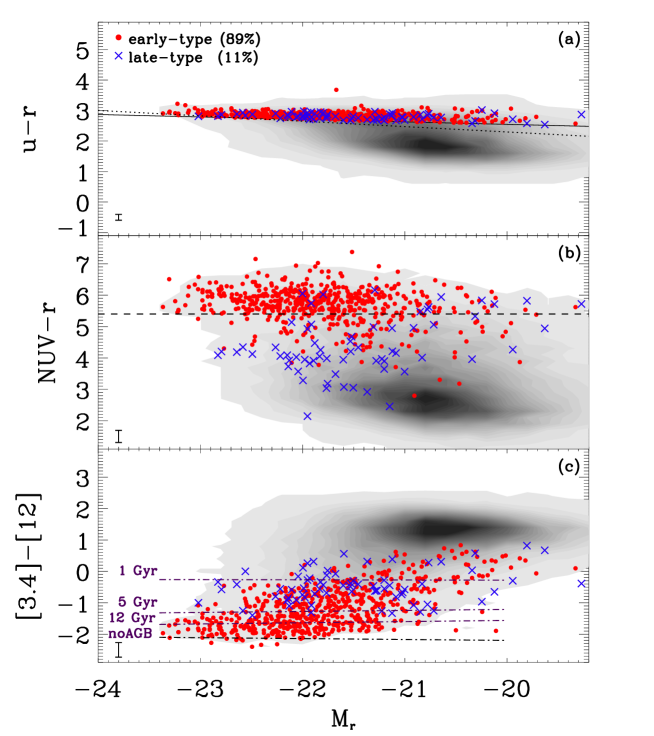
We first used an an optical color-magnitude diagram to identify red-sequence galaxies among the 12 m emitters (see the top panel in Figure 4). Among the 12 m selected galaxies, 18% (4549) are on the red sequence. Among the 12 m selected galaxies on the red sequence, 35% are brighter than = 21.5; these galaxies will be often used for comparing with the results in other studies. The top panel in Figure 4 shows the optical color-magnitude diagram for 12 m selected galaxies. The red-sequence is defined from a linear fit to the versus , by rejecting outliers iteratively based on the bi-weight calculation. The standard deviation of residuals to the fit is 0.11 mag (1), indicating a tight red sequence. The horizontal solid line indicates the color cut adopted in this study to separate red galaxies (redward of the solid line) from blue galaxies (blueward of the solid line). The color-magnitude relation is moved to a bluer color by to define the color cut. For comparison, we also plot the criterion determined in Choi et al. (2007, dotted line). Choi et al. used SDSS galaxies brighter than = 18.5, and rejected late-type galaxies with axis ratios b/a 0.6 to reduce the bias caused by internal extinction. The colors of our red-sequence galaxies are slightly redder than their cut, suggesting our color cut is more strict than previous studies. The slope of our red sequence is about 0.08, similar to that for luminous red galaxies in SDSS (Baldry et al. 2004).
We then use H equivalent width to identify the galaxies without current star formation. Among the red-sequence galaxies, we select the galaxies with H equivalent width 1 Å as “quiescent” galaxies. We also excluded galaxies with -band isophotal axis ratio less than 0.6 (see Choi et al. 2007) to reject star-forming galaxies with large dust obscuration. These processes removed about 85% of red-sequence galaxies, and left red-sequence galaxies without current star formation.
We also removed galaxies with active galactic nuclei (AGNs) that can produce UV and mid-IR emissions. As expected, most Type II AGNs are removed using the H emission line cut. we removed the remaining Type II AGNs (i.e., Seyferts, LINERs, and composites) using the spectral types determined by the criteria of Kewley et al. (2006) based on the emission-line ratio diagrams (Baldwin et al. 1981). We also removed Type I AGNs with broad Balmer lines with quasar spectral classifications provided by the SDSS pipeline (i.e., specClass = SPECQSO or SPECHIZQSO; see Stoughton et al. 2002 for more details). However, there could be still unidentified AGNs in our sample. There are some galaxies without SDSS spectra because their redshifts are from the literature. In some galaxies, the AGN signature could be hidden by dust (e.g., Lee et al. 2012). To identify these dusty AGNs, we used the WISE color-color selection criteria proposed by Jarrett et al. (2011). In summary, we identified 12 AGNs based on the optical spectra (i.e., Type I or II AGNs) and no AGNs based on the WISE color distribution. We rejected these AGNs from the galaxy sample.
In the result, we obtained 648 optically quiescent red-sequence galaxies 555Hereafter we refer to those galaxies as “quiescent red-sequence” galaxies. without H emission and the activity in galactic nuclei for the following analysis. Among them, 89% and 11% are morphologically early- and late-type galaxies, respectively.
2.3 Subsamples
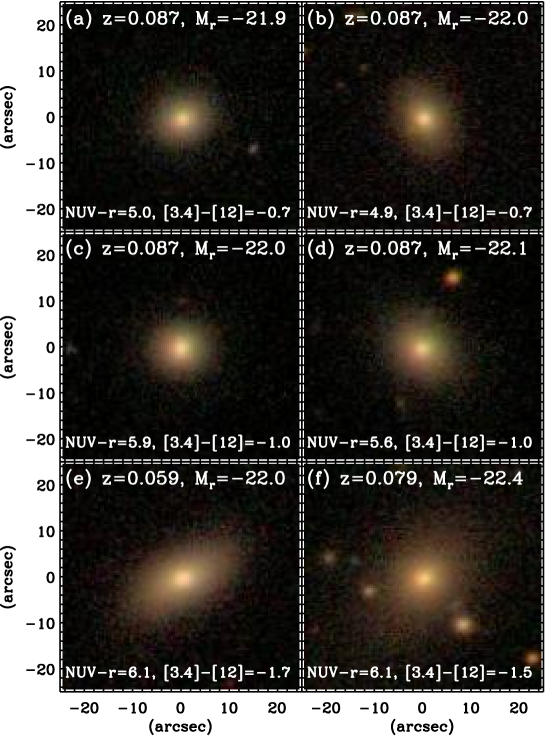
Although we exclude galaxies with H emissions and AGNs, quiescent red-sequence galaxies still show a wide range of colors in the near-UV and mid-IR (Figure 4(b,c)). This suggests that the optical red-sequence consists of various types of galaxies. We thus classify quiescent red-sequence galaxies into three subclasses based on NUV and [3.4][12] colors.
(1) quiescent red-sequence galaxies with near-UV excess: NUV 5.4. These galaxies have recent star formation (Schawinski et al. 2007). Example optical color images of these galaxies are shown in the top panel in Figure 5.
(2) quiescent red-sequence galaxies with mid-IR excess: [3.4][12] 1.3. These galaxies have mid-IR excess emission over the stellar component (Ko et al. 2012). Example color images of these galaxies are in the middle panel in Figure 5.
(3) quiescent red-sequence galaxies without near-UV and mid-IR excess: NUV 5.4 and [3.4][12] 1.3. These galaxies are completely quiescent in the optical, the near-UV and the mid-IR. Example color images of these galaxies are in the bottom panel in Figure 5.
The color images of the galaxies in three subclasses indicate that they all look like typical bulge-dominated systems with red colors and good symmetry regardless of their NUV and [3.4][12] colors (see Figure 5).
3 RESULTS AND DISCUSSION
3.1 near-UV and mid-IR Excess Emissions of Quiescent Red-sequence Galaxies
3.1.1 near-UV and mid-IR Color-Magnitude Diagrams
In Figure 4(b), we show the NUV color-magnitude diagram for quiescent red-sequence galaxies. The dashed line indicates the NUV color cut used for selecting galaxies with near-UV excess (i.e., NUV 5.4). This figure shows that 26% of quiescent red-sequence galaxies have NUV 5.4, indicating their recent star formation. The fraction decreases to 20% for bright ( 21.5), quiescent red-sequence galaxies. If we consider only early-type, bright, quiescent red-sequence galaxies, the fraction is 14 2%. This is roughly a half of the result in Schawinski et al. (2007) who found that 30% 2% of early-type galaxies with 21.5 show recent star formation. The reason for the difference between the two studies is mainly because of different sample selection; we use only bright ( 21.5) early-type galaxies on the red sequence at 17.77 by rejecting galaxies with axis ratio 0.6, but Schawinski et al. (2007) use early-type galaxies at 16.8 regardless of axis ratio.
Interestingly, 74% (52 out of 70) of late-type, quiescent red-sequence galaxies show near-UV excess emission, much larger than the fraction for early-type galaxies (i.e., 20%, 116 out of 578). The difference is larger for bright galaxies with 21.5. These results suggest that the signs of recent star formation in galaxies are closely related to galaxy morphology and optical luminosity. Some of late-type, quiescent red-sequence galaxies with near-UV excess could be disk galaxies whose star formation have been gradually quenched (e.g., Gebhardt et al. 2003) or suddenly stopped by external mechanisms including galaxy mergers within 1 Gyr.
In Figure 4(c), we show the WISE [3.4][12] versus color-magnitude diagram for quiescent red-sequence galaxies. We also overplot the predictions from Single Stellar Population (SSP) models that include the dust emission from circumstellar dust around AGB stars (dot-dashed lines; Piovan et al. 2003; hereafter P03). The optical color-magnitude relation can be well described by a single age model with a metallicity gradient. The same model fits the [3.4][12] versus color-magnitude diagram at three different stellar ages (1, 5, and 12 Gyr), shown by dot-dashed lines. The bottom line represents the SSP model without AGB dust. Interestingly, any single age model fails to reproduce the dispersion in the [3.4][12] colors (Ko et al. 2009, 2012), which suggests either the existence of younger stellar populations or some other mechanisms. The existence of excess emission at 12 m seems robust even though the detailed physics about the circumstellar dust formation and the evolution of AGB stars responsible for the excess emission is not understood completely. We then can set a threshold in mid-IR color ([3.4][12]) to consider galaxies with mid-IR excess emission over stellar emission (mid-IR excess). We adopt the cut of [3.4][12] = 1.3 (Ko et al. 2012). Galaxies redder than this cut are considered to be relatively young ( 5 Gyr) quiescent red-sequence galaxies. Among our quiescent red-sequence galaxies, 55% show mid-IR excess emission. This fraction which much higher than the for galaxies with near-UV excess emission. Interestingly, nearly all (67 out of 70) late-type, quiescent red-sequence galaxies show mid-IR excess emission, much larger than the fraction for early-type, quiescent red-sequence galaxies (51%, 292 out of 578). If we consider bright ( 21.5), early-type, quiescent red-sequence galaxies, the fraction would be 39% (156 out of 397). This is comparable to the result of Ko et al. (2012; see their Figure 25); they found that 42% of massive ( 1010 ), early-type, red-sequence galaxies in the outskirts of galaxy clusters show mid-IR excess emission.
3.1.2 near-UV and mid-IR Color-Color Diagram
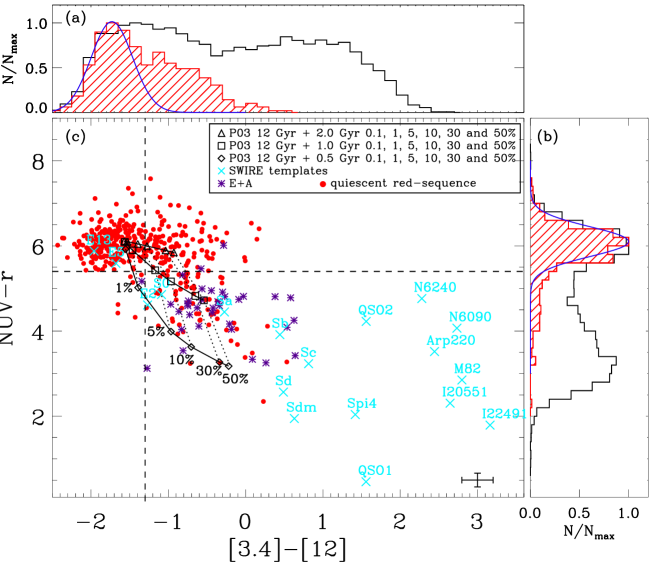
In Figure 6(a,b), we show the distributions of mid-IR and near-UV colors for quiescent red-sequence galaxies with 21.5 (hatched histograms). We use this magnitude limit to select the galaxies not affected by the 12 m detection limit (see Figure 4(c)). For comparison, we also plot the distributions of all the galaxies at 21.5 and 0.04 0.11 with open histograms. The hatched histogram in the top panel (a) shows a peak around the quiescent, old galaxies, and have a red tail consisting of galaxies with mid-IR excess. The hatched histogram in the right panel (b) also shows a peak around the quiescent, old galaxies, but have a blue tail consisting of galaxies with near-UV excess. We overplot the eye-fitted Gaussians to the histograms of quiescent, old galaxies, which give values of 0.26 for [3.4][12] colors and of 0.35 for NUV colors. These values roughly correspond to the maximum errors of colors. The cross in the lower right corner in (c) indicates median errors.
Figure 6(c) shows the [3.4][12] vs. NUV color-color distribution of 436 bright ( 21.5), quiescent red-sequence galaxies. Among them, 35 galaxies are not detected in the near-UV. Considering the GALEX MIS limiting magnitude (22.7 mag in the near-UV), these galaxies not detected in the near-UV do not have near-UV excess emission. However, 14 galaxies of them have mid-IR excess emission. The vertical and horizontal dashed lines represent the mid-IR excess cut of [3.4][12] = 1.3 and the near-UV excess cut of NUV = 5.4, respectively. Interestingly, most quiescent red-sequence galaxies with near-UV excess show mid-IR excess emission, but only 36% of quiescent red-sequence galaxies with mid-IR excess show near-UV excess emission. Among these bright ( 21.5), quiescent red-sequence galaxies, the fraction of galaxies with mid-IR excess is about 44%, roughly twice higher than the fraction of galaxies with near-UV excess (20%).
To study the physical origin of these near-UV and mid-IR excess emissions of quiescent red-sequence galaxies, we perform a two-component SSP analysis. We overplot the two-component SSP model grids that are the combination of an old (12 Gyr) underlying population with young (0.5, 1, and 2 Gyr) populations with a solar metallicity. We vary the fraction of young component to the old one. Having only 1% of 0.5 Gyr and 5% of 1 Gyr populations can make the NUV colors of galaxies be in the near-UV excess region, consistent with previous results of near-UV studies of early-type galaxies (e.g., Yi et al. 2005; Kaviraj et al. 2007). Similarly, the small amount of young (0.5 and 1 Gyr) populations also make galaxies have mid-IR excess emission. The NUV color, however, is insensitive to 2 Gyr population, while the [3.4][12] color is still sensitive to an intermediate-age (2 Gyr) population. This means that although both near-UV and mid-IR are sensitive to very recent ( 1 Gyr) star formation, only the mid-IR is sensitive to star formation over longer (up to 2 Gyr) timescales.
For comparison, we also show 12 m selected E+A galaxies from Choi et al. (2009) in Figure 6(c). E+As are post-starburst (within 1 Gyr) systems with strong Balmer absorption lines and weak H emission line. The figure shows that most E+As have near-UV and mid-IR excess emissions except two galaxies that have only mid-IR excess emission. As expected, the near-UV and mid-IR colors of E+As are consistent with predictions of 1 Gyr models with 10% of young component. This amount of young component for E+As is larger than that for quiescent red-sequence galaxies with near-UV excess. However, it should be noted that E+As are not red-sequence galaxies, so they are not in the same evolutionary stage as quiescent red-sequence galaxies.
We also show the SWIRE templates of Polletta et al. (2007) for comparison: 3 ellipticals (2, 5, 13 Gyr), 7 spirals (S0, Sa, Sb, Sc, Sd, Sdm, Spi4), 6 starbursts (M82, Arp220, N6090, N6240, I20551, I22491), and 2 AGNs (QSO1 and QSO2). These are generated with the GRASIL code (Silva et al. 1998) including dusty envelopes of AGB stars following the prescription by Bressan et al. (1998). In particular, the mid-IR spectra of spiral and starburst templates at 512 m are adopted from various observed spectra of galaxies (Polleta et al. 2007). Although the GRASIL model predicts the dust emission from evolved stars differently from P03 models, the expected near-UV and mid-IR colors for early-type (ellipticals, S0 and Sa) galaxies are broadly consistent with our data (i.e., the [3.4][12] color is redder as mid-IR weighted mean stellar age decreases).
3.1.3 near-UV and mid-IR emissions from young starburst galaxies?
Although we remove galaxies with current star formation using H emission and axis ratios (see Section 2.2), there could be a still contribution from young starburst populations to near-UV or mid-IR excess emissions. For example, the localized thin dust absorption can change NUV colors of galaxies, and the variation in the 12 m emission around deeply embedded sources can change [3.4][12] colors of galaxies (see Figure 6).
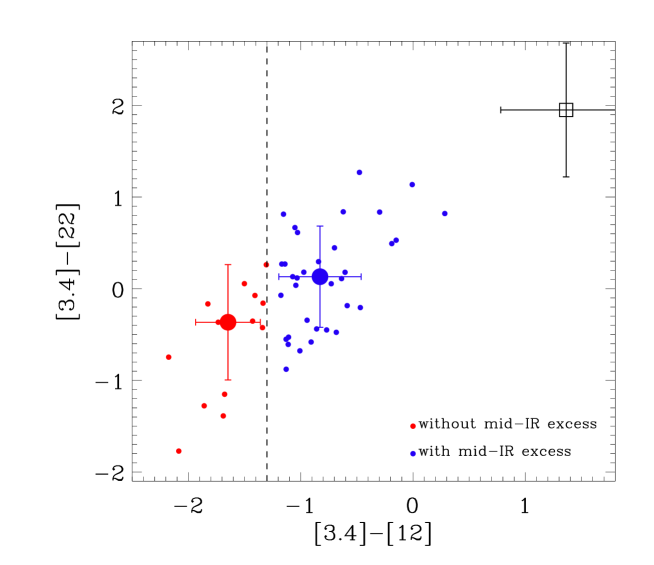
To examine this possibility, we first checked how many quiescent red-sequence galaxies are detected at 22 m. Among 436 bright, quiescent red-sequence galaxies, 385 (88%) galaxies are not detected at 22 m (i.e., signal-to-noise ratio at 22 m 3), indicating that most of them are not dusty, star-forming systems. For the remaining 51 galaxies, we plot [3.4][12] colors versus [3.4][22] colors in Figure 7 to examine how their star formation activity is different from other galaxy populations. To do that, we also plot the median value of blue, star-forming galaxies at 0.04 0.11 (open square). The figure shows that the [3.4][22] colors of quiescent red-sequence galaxies with mid-IR excess (blue filled circles) is, on average, bluer than for blue, star-forming galaxies. Half of these galaxies with mid-IR excess have [3.4][22] colors as blue as quiescent red-sequence galaxies without mid-IR excess (i.e., quiescent, old galaxies; red filled circles). These suggest that although some quiescent, red-sequence galaxies with mid-IR excess are detected at 22 m, their (recent) star formation activity is not as strong as blue, star-forming galaxies.
In summary, quiescent red-sequence galaxies can have near-UV and/or mid-IR excess emissions because of recent star formation without ongoing star formation. Their optical colors are red mainly because of their underlying old stellar populations. This can suggest that they have just arrived to the red sequence after recent star formation activity. Among the quiescent red-sequence galaxies, there could be currently weakly star-forming galaxies, but the fraction of these galaxies is very low.
3.2 Comparison of Physical Properties between mid-IR and near-UV Excess Quiescent Red-sequence Galaxies
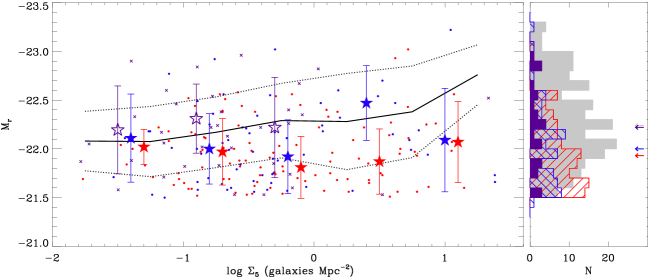
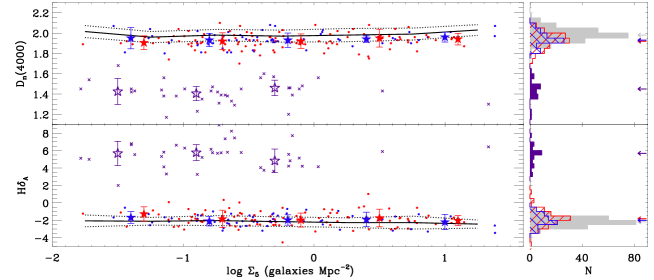
In Figure 8, we show the environmental dependence of optical properties for three classes of quiescent red-sequence galaxies: quiescent red-sequence galaxies with near-UV excess, those with mid-IR excess (but no near-UV excess), and those without near-UV and mid-IR excess. we exclude late-type galaxies in this plot to focus on the recent star formation history of bright, red early-type galaxies with near-UV and mid-IR excess emissions.
As an environmental indicator, we use a surface galaxy number density, that is defined by = 5()-1. is the projected distance to the 5th-nearest neighbor. The 5th-nearest neighbor of each target galaxy was identified among the neighbor galaxies with 20.66 (equivalent to =17.77 at = 0.11, see Figure 2) that have velocities relative to the target galaxy less than 1500 km s-1. is a useful indicator for local density (e.g., Baldry et al. 2006; Muldrew et al. 2012). It probes different scales depending on tracers; in this study, probes the physical scale of 0.5-10 Mpc (see Figure 8). If we use other environmental indicators (e.g., surface galaxy number density within a projected distance of 0.5 or 1.0 Mpc; Ko et al. 2012), our conclusion does not change.
The top panel of Figure 8 shows -band absolute magnitudes of quiescent red-sequence galaxies as a function of local density. We also show E+A galaxies in Choi et al. (2009) for comparison (open stars). The quiescent red-sequence galaxies with recent star formation (red and blue filled stars for mid-IR and near-UV excess, respectively) seem fainter (or less massive) than those without recent star formation (solid line) at nearly all density range. This difference is more significant in high and intermediate density regions. Interestingly, the -band magnitudes of galaxies with mid-IR and near-UV excess do not change much with local density, but those of galaxies without mid-IR and near-UV excess show a dependence on the local density.
In the middle panel of Figure 8, we plot the strength of the 4000-Å break 4000 (good indicator of the mean stellar age of a galaxy) and the Balmer absorption-line index H (indicator of the recent star formation activity of a galaxy; Kauffmann et al. 2003). The figure shows that the median values of 4000 for quiescent red-sequence galaxies with mid-IR and near-UV excess are similar to those without mid-IR and near-UV excess, independently of environment. There is a hint of slightly lower 4000 of those with mid-IR and near-UV excess than those without mid-IR and near-UV excess (i.e., younger age of those with mid-IR and near-UV excess than those without mid-IR and near-UV excess), but the difference is small. However, this age difference is clearly apparent in Figure 6(c); the mid-IR weighted mean stellar ages of quiescent red-sequence galaxies with mid-IR excess are larger than those with near-UV excess, and smaller than those without mid-IR and near-UV excess. Interestingly, the median values of H for quiescent red-sequence galaxies with mid-IR and near-UV excess are also comparable to those without mid-IR and near-UV excess. This suggests that Balmer lines are not sensitive to detect quiescent red-sequence galaxies with mid-IR and near-UV excess emissions. Because of definition of E+A galaxies, they have higher H values than quiescent red-sequence galaxies. However, their near-UV colors are consistent with those of quiescent red-sequence galaxies with near-UV excess (see Figure 6(c)). These suggest that quiescent red-sequence galaxies with near-UV excess might have experienced weaker starbursts (or shorter starburst duration) than E+A galaxies within 1 Gyr (Choi et al. 2009). On the other hand, quiescent red-sequence galaxies with mid-IR excess might have experienced recent star formation 1 Gyr ago, so the contribution of A-type stars to their spectra is small.
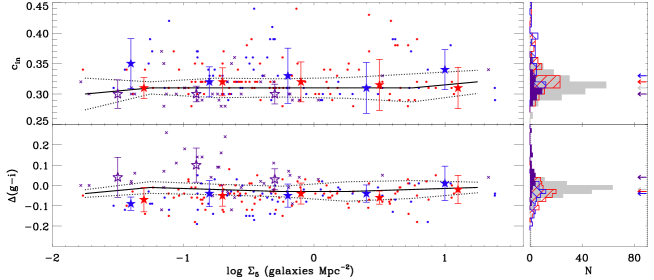
We show the -band concentration index () and () color gradient of quiescent red-sequence galaxies in the bottom panel of Figure 8. The () color gradient was defined by the color difference between the region with 0.5 and the annulus with 0.5 , where is the Petrosian radius measured in -band image. To account for the effect of flattening or inclination of galaxies, elliptical annuli were used to calculate the parameters (Choi et al. 2007). The (inverse) concentration index is defined by , where and are semimajor axis lengths of ellipses containing 50% and 90% of the Petrosian flux in the -band image, respectively.
The figure shows that all the three classes of quiescent red-sequence galaxies have similar concentration index and () color gradients regardless of local density. On the other hand, there are relatively many quiescent red-sequence galaxies with low color gradients (i.e., red cores) in low-density regions compared to high-density regions.
The environmental dependence of color gradients in quiescent red-sequence galaxies can be understood as the following. Galaxy evolution proceeds differently depending on the environment. When galaxies undergo merging events, the color gradients of progenitor galaxies (initially red core) become diluted as a consequence of mix of stellar populations (e.g., Ko & Im 2005). Because the galaxies in high-density regions may have experienced more merging events, the color gradients of galaxies there become gentler than those of galaxies in low-density regions. If we assume that quiescent red-sequence galaxies with mid-IR and near-UV excess have experienced centrally concentrated star formation within 2 Gyr, much younger stellar populations would exist in the cores of galaxies. This results in high values of color gradients (i.e., bluer core). However, the observed color gradients of quiescent red-sequence galaxies with near-UV and mid-IR are excess are similar to those without near-UV and mid-IR excess. This result indicates that the amount of young stars generated during recent star formation is not large enough to change the color gradients, or that recent star formation is not centrally concentrated. Because the near-UV and mid-IR colors are more sensitive to recent star formation than optical colors, it would be interesting to study the opticalUV or opticalIR color gradients in quiescent red-sequence galaxies. This will be discussed in a forthcoming paper. In contrast to quiescent red-sequence galaxies, E+A galaxies have positive color gradients (i.e., blue cores) and are more likely centrally concentrated (i.e., is smaller) than quiescent red-sequence galaxies, indicating recent, intense, centrally-concentrated starbursts (e.g., Yang et al. 2008).
In summary, the comparison of quiescent red-sequence galaxies with mid-IR and those with near-UV excess suggests that the two systems have similar physical properties. However, they are significantly different from E+A galaxies (i.e., post-starburst systems). Their physical properties are similar to those without mid-IR and near-UV excess, but the objects with mid-IR and near-UV excess are younger than those without mid-IR and near-UV excess. Therefore, if we assume a simple recent star formation history (based on Figure 6), near-UV excess galaxies with more than 10% of young ( 1 Gyr) component may passively evolve into mid-IR excess galaxies within 1 Gyr (i.e., no longer near-UV excess). They then may gradually migrate into galaxies without mid-IR and near-UV excess later. The E+A galaxies may evolve into quiescent red-sequence galaxies with mid-IR excess within 1 Gyr, if left alone. On the other hand, near-UV excess galaxies with less than 10% young component are likely to directly evolve into quiescent red-sequence galaxies without mid-IR and near-UV excess within 1 Gyr. Moreover, this evolution among the quiescent red-sequence galaxies is expected to occur earlier in massive galaxies.
The amount of AGB dust emission is larger for galaxies with younger ages because more massive and luminous AGB stars are alive. However, in principle, quiescent red-sequence galaxies without mid-IR and near-UV excess can also have mid-IR excess emission from low-mass stars even though the amount of mid-IR emission is small. This can suggest that the evolution from mid-IR excess galaxies to galaxies without mid-IR excess probably takes a significant amount of time. A broad distribution of mid-IR colors (compared to near-UV colors) for quiescent red-sequence galaxies in Figure 6(a) seems to support this idea.
3.3 Environmental Dependence of near-UV and mid-IR Excess Galaxies
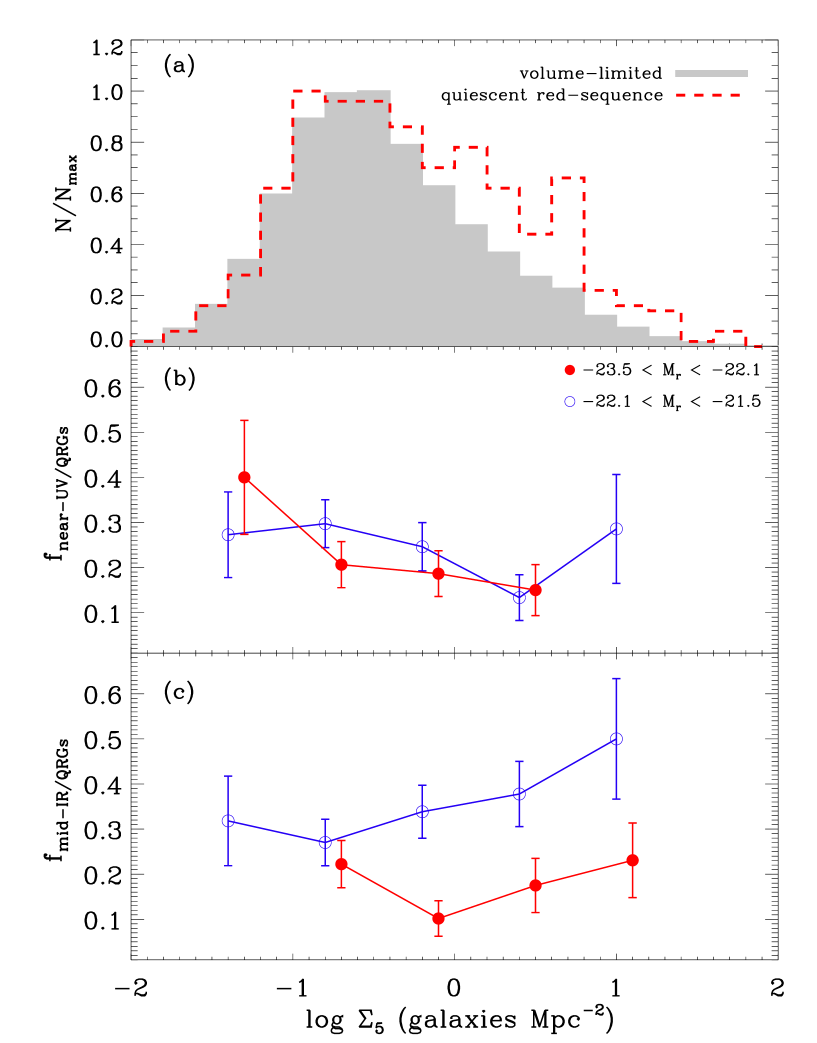
Figure 9(a) shows the distribution of local density () for the volume-limited sample of quiescent red-sequence galaxies with 21.5 (dashed line). We also plot all the galaxies with 21.5 and 0.04 0.11 (gray histogram). The histogram for quiescent red-sequence galaxies shows an excess in high-density regions compared to all the galaxies in the volume. In the middle and bottom panels, we plot the fractions of near-UV and mid-IR excess galaxies among the quiescent red-sequence galaxies as a function of local density. We divide the galaxy sample into two groups based on their -band absolute magnitudes so that each subsample has the same number of galaxies.
The middle panel (b) shows that the fraction of near-UV excess galaxies is large in low- density regions. This environmental dependence seems stronger for bright galaxies (filled circles). The figure also shows that there are a significant number of bright galaxies with near-UV excess (i.e., recent star formation at 1 Gyr) in the lowest density bin. On the other hand, faint galaxies (open circles) show a high fraction of near-UV excess galaxies in the highest density bin. It should be noted that density bins with less than three galaxies are excluded. Actually, the fraction of bright galaxies in the highest density bin is 8% (2 out of 26). This environmental dependence of near-UV excess galaxies is consistent with the results of Schawinski et al. (2007).
On the other hand, the fraction of mid-IR excess galaxies appears to increase with local density (see panel (c)). The enhancement of mid-IR excess galaxies in high-density regions is mainly because of faint galaxies (open circles); roughly a half of faint, quiescent red-sequence galaxies are mid-IR excess galaxies (i.e., recent star formation at 2 Gyr). The luminosity dependence of the fraction of mid-IR excess galaxies is consistent with the results in Ko et al. (2009, 2012); faint (low mass) galaxies are more likely to have mid-IR excess emission among red early-type galaxies. However, the environmental dependence of the fraction of mid-IR excess galaxies (i.e., higher fraction of mid-IR excess galaxies in high-density regions than in low-density regions) seems different from our previous results (i.e., low fraction of red early-type galaxies with mid-IR excess emission in high-density regions). However, this difference results from a different sample selection between the two studies. Ko et al. (2009, 2012) used only the mid-IR excess galaxies, but in this study we further divide the mid-IR excess galaxies into two subsamples based on near-UV excess. If we consider mid-IR excess galaxies without near-UV excess cut, the fraction of mid-IR excess galaxies are 58% and 25% in the lowest and highest density bins, respectively. We then have a lower fraction of quiescent red-sequence galaxies with mid-IR excess in high-density regions than in low-density regions, consistent with our previous results.
In summary, there is a strong environmental dependence of fractions of near-UV and mid-IR excess galaxies, indicating that the recent star formation activity of quiescent red-sequence galaxies are strongly affected by the environment. These results can suggest a possible scenario of recent (at least 2 Gyr) evolutionary history of bright early-type galaxies, migrating to the red sequence with quiescent mode. We can speculate that recent (within 1 Gyr) star formation of quiescent red-sequence galaxies (traced by near-UV excess) occurs in any environments, but preferentially in low-density regions at current epoch. Recent star formation in quiescent red-sequence galaxies is also common irrespective of their luminosities except bright near-UV excess galaxies in the highest density region (e.g., galaxy cluster regions). The bright, quiescent red-sequence galaxies in cluster regions seem to have no gas left to induce recent star formation or to have less frequent galaxy mergers, so they are not detected in the near-UV. However, the brightest cluster galaxies in the center of cluster can have recent star formation because of cooling intracluster gas (e.g., Hicks et al. 2010).
Quiescent red-sequence galaxies that might have experienced star formation 1 Gyr ago (traced by mid-IR excess) can also exist in any environments. However, they are found preferentially in high-density regions and most bright mid-IR excess galaxies are rare in low-density regions. The high-density regions including galaxy clusters keep accreting galaxies, and the crossing time for a galaxy in clusters is about a few Gyrs (Treu et al. 2003; Park & Hwang 2009). The near-UV excess galaxies may evolve into mid-IR excess galaxies within 1 Gyr and remain as mid-IR excess galaxies for 0.51 Gyr if left alone. These can suggest that the mid-IR excess galaxies in high-density regions are descendants of near-UV excess galaxies recently accreted from low/intermediate density regions.
4 SUMMARY AND CONCLUSIONS
We use WISE mid-IR and GALEX near-UV data for a spectroscopic sample of SDSS galaxies at 0.04 0.11 and 17.77 to study the recent star formation history of bright ( 21.5), early-type galaxies on the optical red sequence. Among the 648 quiescent red-sequence galaxies, 55% show mid-IR excess emission over the stellar component. Because we select them not to have AGNs, H emission, and highly inclined disks, the mid-IR emission mainly results from the circumstellar dust around AGB stars or from the stellar photosphere.
Among the 648 quiescent red-sequence galaxies, 26% show near-UV excess emission, indicating recent star formation within 1 Gyr. If we consider bright ( 21.5) early-type galaxies, the fraction is down to 14%. Most near-UV excess galaxies also show mid-IR excess emission, but some mid-IR excess galaxies do not show near-UV excess. This is consistent with that the mid-IR light is sensitive to star formation over longer time scales (i.e., recent star formation within 2 Gyr) than the near-UV light. If we consider bright early-type galaxies, the fraction of quiescent red-sequence galaxies with recent star formation is 39%. This suggests that the recent star formation is common among nearby, quiescent, red, early-type galaxies.
The near-UV and mid-IR excess galaxies (i.e., early-type galaxies with recent star formation) are optically fainter (or less massive) than galaxies without near-UV and mid-IR excess (i.e., early-type galaxies without near-UV and mid-IR excess emission). The mid-IR weighted mean stellar age and 4000 indicate that the near-UV and mid-IR excess galaxies are also slightly younger than galaxies without near-UV and mid-IR excess. This can suggest an evolutionary scenario of quiescent red-sequence galaxies: those with near-UV excess those with mid-IR excess those without near-UV and mid-IR excess. The near-UV and mid-IR excess galaxies show different environmental dependence; near-UV excess galaxies are preferentially found in low-density regions, but mid-IR excess galaxies are found in high density regions. This suggests strong environmental effects on the evolution of quiescent red-sequence galaxies with recent star formation.
This study provides useful observational constraints on the theoretical models about the AGB stars and their contribution to the mid-IR fluxes in galaxies. However, we do not quantify the amount of mid-IR emission attributed to AGB dust in galaxies, and do assume that the contribution from other mechanisms for mid-IR emission (e.g., low-level of dusty starburst, AGNs) is small. These will be examined in a forthcoming paper.
References
- (1) Abazajian, K. N., Adelman-McCarthy, J. K., Agüeros, M. A., et al. 2009, ApJS, 182, 543
- (2) Baldry, I. K., Glazebrook, K., Brinkmann, J., et al. 2004, ApJ, 600, 681
- (3) Baldry, I. K., Balogh, M. L., Bower, R. G., et al. 2006, MNRAS, 373, 469
- (4) Baldwin, J. A., Phillips, M. M., & Terlevich, R. 1981, PASP, 93, 5
- (5) Balogh, M., Eke, V., Miller, C., et al. 2004, MNRAS, 348, 1355
- (6) Bamford, S. P., Nichol, R. C.; Baldry, I. K., et al. 2009, MNRAS, 393, 1324
- (7) Blanton, M. R., Hogg, D. W., Bahcall, N. A., et al. 2004, ApJ, 94, 186
- (8) Bower, R. G., Kodama, T., & Terlevich, A. 1998, MNRAS, 299, 1193
- (9) Bressan, A., Granato, G. L., & Silva, L. 1998, A&A, 332, 135
- (10) Bressan, A., Panuzzo, P., Buson, L., et al. 2006, ApJ, 639, L55
- (11) Bruzual, G. 2009, Rev. Mex. Astron. Astrofis. Conf. Ser., 35, 154
- (12) Choi, Y.-Y., Park, C., & Vogeley, M. S. 2007, ApJ, 658, 884
- (13) Choi, Y.-Y., Han, D., & Kim, S. S. 2010, J. Korean Astron. Soc., 43, 191
- (14) Choi, Y., Goto, T., & Yoon, S.-J. 2009, MNRAS, 395, 637
- (15) Clemens, M. S., Bressan, A., Panuzzo, P., et al. 2009, MNRAS, 392, 982
- (16) Couch, W. J., & Sharples, R. M. 1987, MNRAS, 229, 423
- (17) Deharveng, J.-M., Boselli, A., & Donas, J. 2002, A&A,393, 843
- (18) Donoso, E., Yan, L., Tsai, C., et al. 2012, ApJ, 748, 80
- (19) Dressler, A., & Gunn, J. E. 1983, ApJ, 270, 7
- (20) Ferreras I., & Silk J., 2000, ApJ, 541, L37
- (21) Frogel, J. A., Mould, J., & Blanco, V. M. 1990, ApJ, 352, 96
- (22) Gallazzi, A., Bell, E. F., Wolf, C., et al. 2009, ApJ, 690, 1883
- (23) Gebhardt, K., Faber, S. M., Koo, D. C., et al. 2003, ApJ, 597, 239
- (24) Hicks, A. K., Mushotzky, R., & Donahue, M. 2010 ApJ, 719, 1844
- (25) Hwang, H. S., Elbaz, D., Lee, J. C., et al. 2010, A&A, 522, A33
- (26) Hwang, H. S.; Geller, M. J., Diaferio, A., & Rines, K. J. 2012, ApJ, 752, 64
- (27) Jarrett, T. H., Cohen, M., Masci, F., et al. 2011, ApJ, 735, 112
- (28) Kauffmann, G., Heckman, T. M., White, S. D. M., et al. 2003, MNRAS, 341, 54
- (29) Kaneda, H., Onaka, T., Sakon, I., et al. 2008, ApJ, 684, 270
- (30) Kaviraj, S., Schawinski, K., Devriendt, J. E. G., et al. 2007, ApJS, 173, 619
- (31) Kelson, D. D., & Holden, B. P. 2010, ApJ, 713, L28
- (32) Kewley, L. J., Jansen, Rolf A., & Geller, Margaret J. 2005, PASP, 117, 227
- (33) Kewley, L. J., Groves, B., Kauffmann, G., & Heckman, T. 2006, MNRAS, 372, 961
- (34) Ko, J., & Im, M. 2005, J. Korean Astron. Soc., 38, 149
- (35) Ko, J., Im, M., Lee, H. M., et al. 2009, ApJ, 695, L198
- (36) Ko, J., Im, M., Lee, H. M., et al. 2012, ApJ, 745, 181
- (37) Lee, J. C., Hwang, H. S., Lee, M. G., et al. 2012, ApJ, 756, 95
- (38) Lee, J. H., Lee, M. G., Park. C., & Choi. Y.-Y. 2010, MNRAS, 401, 1804
- (39) Maraston, C. 2005, MNRAS, 362, 799
- (40) Marigo, P., Girardi, L., & Bressan, A., et al. 2008, A&A, 482, 883
- (41) Martin, D. C., Fanson, J., Schiminovich, D., et al. 2005, ApJ, 619, L1
- (42) Masters, K. L., Mosleh, M., Romer, A. K., et al. 2010, MNRAS, 405, 783
- (43) Morrissey, P., Schiminovich, D., Barlow, T. A., et al. 2005, ApJ, 619, L7
- (44) Muldrew, S. I., Croton, D. J., Skibba, R. A., et al. 2012, MNRAS, 419, 2670
- (45) Panuzzo, P., Rampazzo, R., Bressan, A., et al. 2011, A&A, 528, 10
- (46) Park, C., & Choi, Y. 2005, ApJ, 635, L29
- (47) Park, C., & Hwang, H. S. 2009, ApJ, 699, 1595
- (48) Peeters, E., Mattioda, A. L., Hudgins, D. M., & Allamandola, L. J. 2004, ApJ, 617, L65
- (49) Piovan, L., Tantalo, R., & Chiosi, C. 2003, A&A, 408, 559
- (50) Poggianti, B. M, Smail, I., Dressler, A., et al. 1999, ApJ, 518, 576
- (51) Polletta, M., Tajer, M., Maraschi, L., et al. 2007, ApJ, 663, 81
- (52) Salim, S., Dickinson, M., Michael R. R., et al. 2009, ApJ, 700, 161
- (53) Schawinski, K., Kaviraj, S., Khochfar, S., et al. 2007, ApJS, 173, 512
- (54) Shim, H., Im, M., Lee, H. M., et al. 2011, ApJ, 727, 14
- (55) Silva, L., Granato, G. L., Bressan, A., & Danese, L. 1998, ApJ, 509, 103
- (56) Stoughton, C., Lupton, R. H., Bernardi, M., et al. 2002, AJ, 123, 485
- (57) Strateva, I., Ivezić, Ž, & Knapp, G. R. 2001, AJ, 122, 1861
- (58) Treu, T., Ellis, R. S., Kneib, J.-P., et al. 2003, ApJ, 591, 53
- (59) Vega, O., Bressan, A., Panuzzo, P., et al. 2010, ApJ, 721, 1090
- (60) Wolf, C., Aragón-Salamanca, A., Balogh, M., et al. 2009, MNRAS, 393, 1302
- (61) Wright, E. L., Eisenhardt, P. R. M., Mainzer, A. K., et al. 2010, AJ, 140, 1868
- (62) Yang, Y., Zabludoff, A. I., Zaritsky, D., Mihos, J. C., et al. 2008, ApJ, 688, 945
- (63) Yi, S. K., Yoon, S.-J., Kaviraj, S., et al. 2005, ApJ, 619, L111
- (64) York, D. G., Adelman, J., Anderson, J. E. Jr., et al. 2000, AJ, 120, 1579