Galaxies in X-ray Groups. III. Satellite Color and Morphology Transformations
Abstract
While the star formation rates and morphologies of galaxies have long been known to correlate with their local environment, the process by which these correlations are generated is not well understood. Galaxy groups are thought to play an important role in shaping the physical properties of galaxies before entering massive clusters at low redshift, and transformations of satellite galaxies likely dominate the buildup of local environmental correlations. To illuminate the physical processes that shape galaxy evolution in dense environments, we study a sample of 116 X-ray selected galaxy groups at with halo masses of and centroids determined with weak lensing. We analyze morphologies based on HST imaging and colors determined from 31 photometric bands for a stellar mass-limited population of 923 satellite galaxies and a comparison sample of 16644 field galaxies. Controlling for variations in stellar mass across environments, we find significant trends in the colors and morphologies of satellite galaxies with group-centric distance and across cosmic time. Specifically at low stellar mass (), the fraction of disk-dominated star-forming galaxies declines from among field galaxies to among satellites near the centers of groups. This decline is accompanied by a rise in quenched galaxies with intermediate bulge+disk morphologies, and only a weak increase in red bulge-dominated systems. These results show that both color and morphology are influenced by a galaxy’s location within a group halo. We suggest that strangulation and disk fading alone are insufficient to explain the observed morphological dependence on environment, and that galaxy mergers or close tidal encounters must play a role in building up the population of quenched galaxies with bulges seen in dense environments at low redshift.
Subject headings:
galaxies: bulges – galaxies: clusters: general – galaxies: evolution – galaxies: halos – galaxies: statistics – X-rays: galaxies: clusters1. Introduction
Galaxy properties are correlated with their environment. Dense regions host galaxies with greater masses, lower star-formation rates, and morphologies that are more bulge-dominated than in low density regions. Since the early work of Dressler (1980), studies of environmental correlations have expanded to a variety of indicators of star formation, morphology, and environment. See Blanton & Moustakas (2009) for a recent review of these correlations in the local universe.
Numerous processes may be culpable for the dependence of galaxy properties on environment (see Boselli & Gavazzi 2006 for a review). Galaxy interactions through mergers or tides can disrupt stellar kinematics and remove gas. These interactions can also apply torques that drive gas inward, perhaps feeding star formation or a central black hole. Halos can play a role through tidal forces and dynamical friction. Pressure from hot dense gas inside halos may strip gas from infalling galaxies, and shock heating in massive halos can prevent accretion of cold gas that would feed star formation.
Despite extensive observational and theoretical work, the dominant physical mechanisms responsible for the environmental correlations remain unclear. An important clue is that the scale on which these correlations appear is similar to the size of the dark matter halos hosting galaxies (e.g., Kauffmann et al., 2004; Blanton & Berlind, 2007). Relatedly, satellite galaxies have a primary role in the buildup of the red sequence in dense environments (e.g., Weinmann et al., 2006; van den Bosch et al., 2008; Wetzel et al., 2012a; Peng et al., 2012).
Since many galaxy characteristics are interrelated, it is important to study the correlations for each property independently while fixing other variables. When constraining environmental effects, one ideally controls for differences in redshift, stellar mass, halo mass, and location within a group. The colors and morphologies of galaxies are also correlated, so it is advantageous to split galaxies simultaneously by color and morphological classes to distinguish between processes that affect star formation rates and structural properties differently. Several studies have suggested that environmental processes affect star formation more significantly than morphology (e.g., Kauffmann et al., 2004; Blanton et al., 2005; Christlein & Zabludoff, 2005; Weinmann et al., 2009; Kovač et al., 2010), suggesting that the gas that feeds star formation is depleted or removed without significantly altering galactic structure or stellar kinematics.
While many of the observational studies have focused on large surveys at low redshift or on massive clusters at higher redshifts, less is known about the more common group-scale environments and their evolution over time. In this paper, we study the colors and morphologies of galaxies in groups spanning the redshift range . We focus in particular on the properties of satellite galaxies as a function of stellar mass, group-centric distance, and redshift. This sample of groups has been identified from the COSMOS field (Scoville et al., 2007) based on their extended X-ray emission and have masses determined with weak lensing in the range (Leauthaud et al., 2010). Galaxy membership has been assigned using precise photometric redshifts with a Bayesian procedure tested extensively with mock catalogs and a spectroscopic subsample (George et al., 2011). Furthermore, by finding galaxies that maximize the lensing signal on small scales we have identified central galaxies that accurately trace the center of mass of their halos (George et al., 2012). Additional studies of these groups with magnification lensing (Ford et al., 2012; Schmidt et al., 2012) and clustering (Allevato et al., 2012) have confirmed the halo mass estimates. These ingredients make for a robust characterization of group environments with which to study satellite properties and their evolution over time.
We describe the data used in this analysis in Section 2 along with mock catalogs used to estimate the purity of the satellite population analyzed. Section 3 presents the results including our primary finding of a declining fraction of blue late disk galaxies and a rise in red early types toward group centers and over cosmic time. In Section 4, we discuss the implications of these findings for the physical mechanisms that shape galaxy evolution, and put this work in the context of previous studies and possibilities for the future.
2. Data and Mocks
The COSMOS field (Scoville et al., 2007) has been the subject of a broad array of multi-wavelength imaging and spectroscopy campaigns. In this study we make use of several pieces of this data: galaxy colors, photometric redshifts, and stellar masses derived from over thirty bands of ultraviolet, optical, and infrared data (Ilbert et al., 2009, 2010; Bundy et al., 2010); galaxy morphologies determined by Scarlata et al. (2007) from high-resolution imaging taken by the Advanced Camera for Surveys (ACS) aboard the Hubble Space Telescope (Koekemoer et al., 2007); and a catalog of massive galaxy groups selected based on their X-ray emission seen with XMM-Newton and Chandra and for which halo mass profiles have been characterized using weak lensing with Hubble imaging (Leauthaud et al., 2010; George et al., 2011, 2012). Most of these data have been compiled in the group member catalog published in George et al. (2011) and we refer the reader to that paper and references therein for further details including the flux and mass limits for galaxies and groups. Here we briefly explain the stellar masses, colors, and morphologies used in this paper, as well as the identification of group centers and the mock catalogs used for validating group membership assignment and estimating the effects of contamination from field galaxies.
2.1. Group Membership and Mocks
As a measure of galaxy environment, we use a catalog of groups described in George et al. (2011). These groups have been identified through a wavelet detection of extended X-ray emission following Finoguenov et al. (2010) and the sample is an expanded version of an earlier COSMOS catalog (Finoguenov et al., 2007) with deeper X-ray data. A Bayesian membership algorithm is used to associate galaxies with groups based on precise photometric redshifts and proximity to the X-ray position, with a prior accounting for the relative field population as a function of magnitude and redshift. Following George et al. (2011), we select galaxies with membership probability among the clean sample of groups, avoiding masked regions, groups with fewer than four members, overlapping groups, and possible projections (flag_include=1 in the catalog). Halo masses for these groups have been measured with stacked weak lensing to be in the range and are correlated with X-ray luminosity (Leauthaud et al., 2010; George et al., 2012). Over this limited range in halo masses, we have not detected significant trends in galaxy properties with X-ray luminosity, but to avoid the influence of outliers we eliminate a small number of groups with halo masses estimated from their X-ray luminosities following Leauthaud et al. (2010) that are above or below the range.
We split galaxies into central, satellite, and field populations across several stellar mass and redshift bins to isolate dependences among different properties. For each group, the central galaxy is defined as the most massive group member within a projected distance of the X-ray position equal to the scale radius of a Navarro-Frenk-White (Navarro et al., 1996) profile. George et al. (2012) showed with weak lensing tests that this definition traces the halo center to within roughly , though in roughly of groups the center is still ambiguous. In this paper we do not specifically study the central galaxies in these X-ray selected halos because their abundance limits statistical constraints on the properties of this population. The remaining group members are called satellites, and are the primary focus of this work. Field galaxies are taken to be those not assigned to any extended X-ray source and are thus expected to reside in halos less massive than the X-ray detection limit ( from George et al. 2011; see Figure 1 of that paper for the X-ray flux limit as a function of redshift). Because we do not detect faint X-ray groups at high redshift, the halo mass range occupied by the field population can evolve due to this selection effect. However, at low redshift only of galaxies in our sample live in X-ray groups, so we expect the evolving halo mass limit to have only a small effect on the statistics of the field population. Table 1 gives the size of each of these samples used in our analysis.
| Stellar Mass | ||
|---|---|---|
| Type | ||
| Satellites | 237 | 218 |
| Field | 2455 | 1993 |
| Satellites | 122 | 189 |
| Field | 4497 | 3529 |
| Satellites | … | 157 |
| Field | … | 4170 |
Note. — No contamination corrections have been applied. Ellipses denote a bin below our stellar mass completeness limit.
Extensive tests of the accuracy of the photometric redshifts and membership assignment algorithm have been carried out using mock catalogs from simulations as well as a subsample of galaxies with spectroscopic redshifts (George et al., 2011). The overall purity and completeness of the member selection within is and , respectively, down to our flux limit of F814W . The accuracy of member selection depends most significantly on distance from the group center and on the flux of a galaxy. The first effect is due to the decreasing density of true members with group-centric distance, which implies that selecting galaxies uniformly with radius (out to ) will result in higher contamination from field galaxies in the outskirts. The second effect from galaxy flux arises from the decreasing precision of photometric redshifts for fainter galaxies, ranging from at F814W to at F814W . It is notable that with the many filters used in constructing these photometric redshifts, precision does not depend significantly on spectral type, so red and blue galaxies of a given magnitude are selected with similar completeness.
In our analyses of member populations, we correct for contamination from field galaxies using the mock catalogs described in George et al. (2011). A halo catalog is constructed from a LasDamas simulation (C. K. McBride et al., in preparation)111Details regarding the LasDamas “Consuelo” simulation can be found at http://lss.phy.vanderbilt.edu/lasdamas/simulations.html and populated with group members following the halo occupation model of Leauthaud et al. (2012). Mock galaxies are matched to real COSMOS galaxies in narrow bins of stellar mass and redshift to assign magnitudes in the F814W band, which in turn are used to assign mock photometric redshift errors. We estimate the purity of the member selection algorithm in bins of group-centric distance and magnitude, and assume that the colors and morphologies of contaminating field galaxies are representative of the field population at that magnitude. Contamination corrections are applied to the satellite populations only, since the field population is much larger. These corrections only account for contamination of the member list and not for incompleteness; the latter effect is smaller, does not significantly depend on group-centric distance, and should be fairly uniform across galaxy types since the precision of photometric redshifts is effectively achromatic (see Figures 2 and 5 of George et al., 2011).
2.2. Stellar Masses, Colors, and Morphologies
Stellar masses and spectral classes have been determined by fitting stellar population synthesis models to the spectral energy distributions of galaxies, varying the age, amount of dust extinction, and metallicity in the models. We use the stellar masses from Bundy et al. (2010) and color classifications from Ilbert et al. (2010), both of which are based on Bruzual & Charlot (2003) models fit with a Chabrier (2003) initial mass function but take somewhat different approaches to fitting the data. Using the unextincted rest-frame color of the best-fitting template for each galaxy, we split them into two color classes:
-
•
red:
-
•
blue: .
Ilbert et al. (2010) showed that this color cut corresponds with a specific star formation rate of roughly . It is worth emphasizing that these colors are corrected for dust extinction, so that the red sample selects a population of quiescent galaxies similar to those identified using two color cuts based on near-ultraviolet, optical, and near-infrared measurements, minimizing contamination from dusty star-forming galaxies (e.g., Bundy et al., 2010).
Galaxies are classified morphologically based on automated measurements of several structural parameters from ACS imaging in the F814W band. We use the Zurich Estimator of Structural Types (ZEST; Scarlata et al., 2007) catalog, which is derived from measurements of the asymmetry, concentration, Gini coefficient, second moment of the brightest pixels, and ellipticity. Scarlata et al. (2007) performed a principal component analysis of these measured quantities to identify the most important structural parameters, and divided galaxies into classes (early type, disk, and irregular) based on their location in this principal component space. A further subdivision of the disk category was derived by correlating measurements of the Sérsic index for a bright sample with with location in the principal component space. This parametrization provides a rough indication of the bulge-to-disk ratio, with four classes ranging from bulge-dominated to bulgeless disks. For statistical purposes, we consolidate some of these classifications into three morphological categories:
-
•
early type spheroidals and bulge-dominated disks including even relatively inclined S0 galaxies (ZEST types 1 and 2.0)
-
•
intermediate bulge+disk galaxies (ZEST type 2.1)
-
•
late disks with little or no bulge component (ZEST types 2.2 and 2.3).
Irregulars and unclassified galaxies make up a small fraction of the sample, typically not more than a few percent in any stellar mass bin. We note that morphological K-corrections, which have not been applied, should not have a large effect on our sample because the F814W band probes rest-frame optical wavelengths over our entire redshift range (e.g., Lotz et al., 2004; Cassata et al., 2005; Bundy et al., 2010).
3. Results
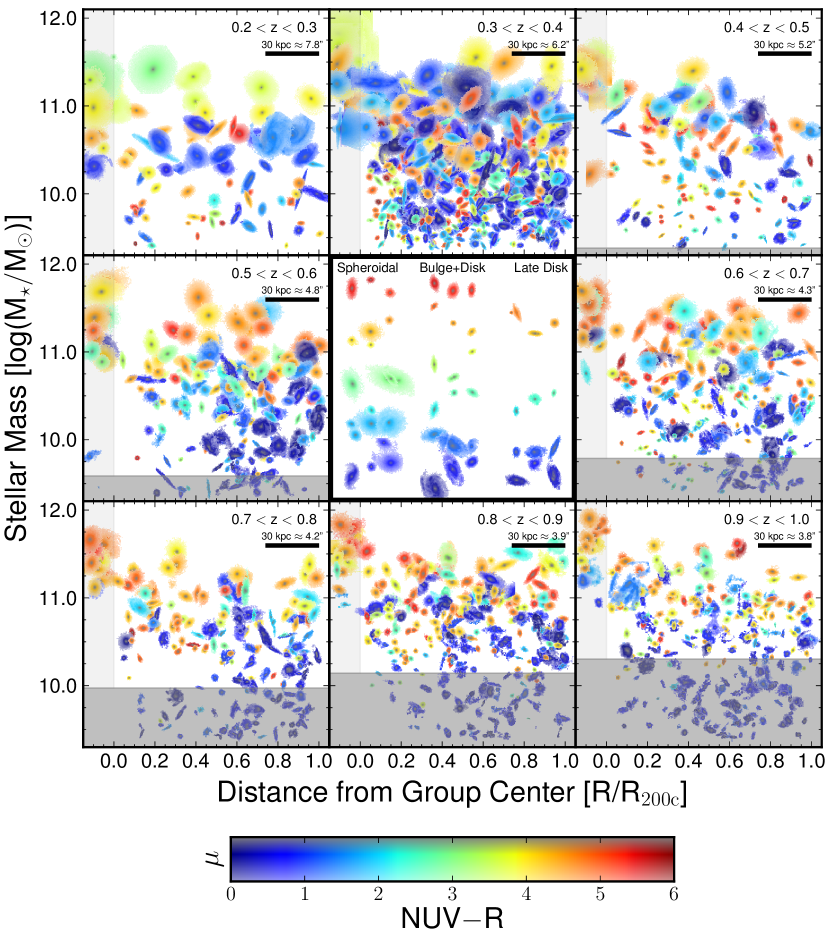
We begin our analysis with a visualization of a few properties of the galaxies in our sample. Figure 1 shows the distributions of stellar masses and group-centric distances in different redshift bins for all galaxies selected as group members. Each point represents one object and is displayed using the ACS image of the galaxy (Koekemoer et al., 2007), colored according to the average unextincted rest-frame template color. Centrals are positioned on the left of each panel with small horizontal offsets, and satellites are plotted at their distance from the corresponding central. Each image is basically the set of adjacent pixels with flux above a noise threshold shown with a logarithmic surface brightness scale that has its maximum set to the peak value for each galaxy. We note that the apparent size of a galaxy on the plot is quite sensitive to its flux since images of brighter galaxies have more pixels above the noise threshold, and this is not a perfect indicator of the physical effective radius of a galaxy. A small fraction of objects have deblending issues or edge effects from the cutout image size, but we note that the images are processed independently for visualization and analysis purposes.
Several trends are evident when visualizing galaxies in this manner. Stellar mass is a strong determinant of galaxy properties; massive galaxies are more likely to be large, red, and spheroidal. Physical properties also depend on the location within a group. Central galaxies are massive (by definition), but also typically red and elliptical. Blue centrals tend to be less massive than red centrals at high redshifts even within the fairly narrow range of halo masses studied here, as discovered by Tinker et al. (2012). Satellites closer to group centers are more likely to be red and show fewer spiral features than in the outskirts, particularly at low stellar masses. There is a relative dearth of low mass satellites near group centers; this could be a hint of satellite depletion due to mergers, but challenges in measuring photometry of faint objects near massive extended central galaxies could be a contributing factor so further investigation is needed. Similar evidence of mass segregation and the influence of mass and environment on star formation has been seen in groups and clusters out to (Muzzin et al., 2012; Presotto et al., 2012). Many of these trends can be seen across the entire redshift range studied here, indicating that both stellar mass and halo environment play a role in determining galaxy properties at least since . Sample variance due to the finite survey volume does affect our ability to measure absolute redshift trends as the number densities vary significantly due to large-scale structures (particularly evident at ), but the relative fractions of different populations should be less affected.
The central panel of Figure 1 shows a few examples of the three morphological classifications from ZEST, chosen randomly to span the range of colors seen from redshifts and with . While these classifications do not always agree with one’s visual impression, there are clear differences in structural parameters among the classes, and correlations between these automated measurements and a galaxy’s position in a group can provide an interesting test of the dependence of morphology on environment. We emphasize that the ZEST morphologies are correlated with, but not identical to, traditional visual classification of ellipticals and spirals. We compare results from multiple morphological indicators in Section 3.3.
3.1. Radial Trends: Blue Late Disks into Red Bulge+disks
We can quantify some of the trends from Figure 1 by measuring the fraction of galaxies of a given color and morphology as a function of stellar mass, group-centric distance, and redshift. Figure 2 shows the fraction of galaxies in each of the six combinations of color and morphology categories described in Section 2.2. For example, the cyan triangles represent the fraction of galaxies in the stellar mass and redshift range shown that are both blue and have late disk morphology. This population makes up the majority among field galaxies (shown at ) but its fraction declines among satellites, contributing less than of the satellite population at . Meanwhile, the proportion of red bulge+disk galaxies rises from in the field to among satellites in the inner radial bin.
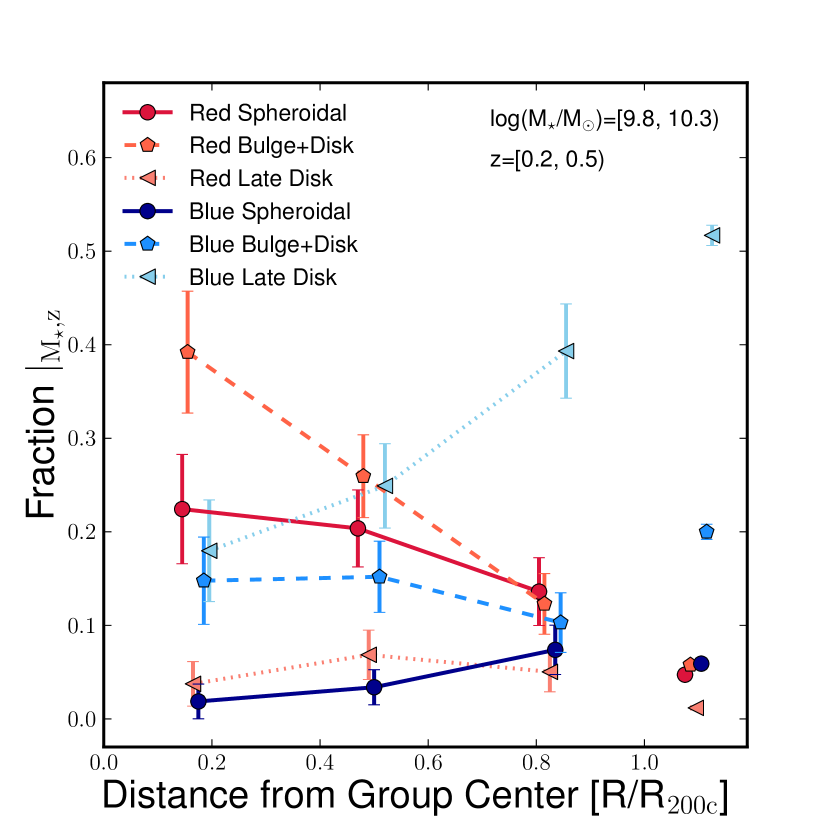
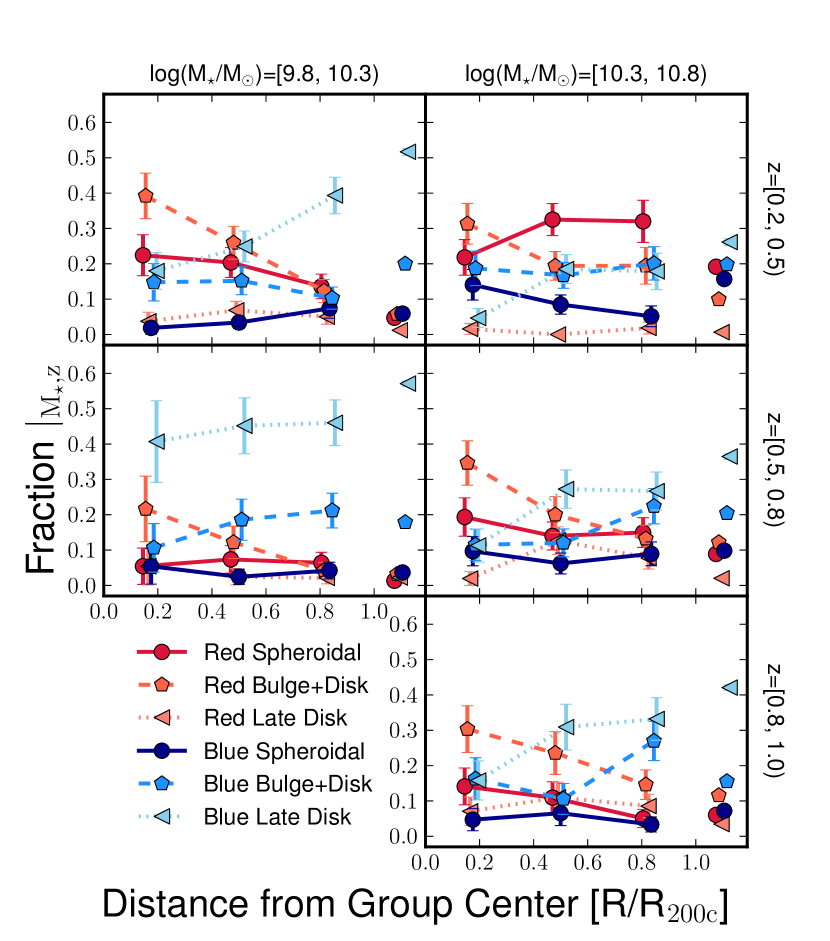
Figure 2 highlights the most significant environmental trends in our sample by focusing on low mass, low redshift galaxies. We repeat the exercise in Figure 3 with higher mass and redshift bins to study how these trends vary. The broad picture is similar; blue late disks dominate in the field while the red bulge+disk population becomes more prominent toward group centers. Among low mass galaxies at , the blue late disks dominate everywhere, while more massive galaxies at lower redshift have a substantial population of red spheroidals. Red late disks and blue spheroidals do not make up a large portion of galaxies at any mass or redshift studied. The red fraction can be determined from these plots by summing the three red lines, and similarly the spheroidal fraction is the sum of the solid lines with circular markers. The red fraction rises toward group centers for low mass galaxies, but is relatively flat among massive galaxies. We note that the abscissa for these plots is the projected group-centric distance, and that the true radial trends measured in spherical shells are likely more significant than observed.
3.2. Redshift Trends
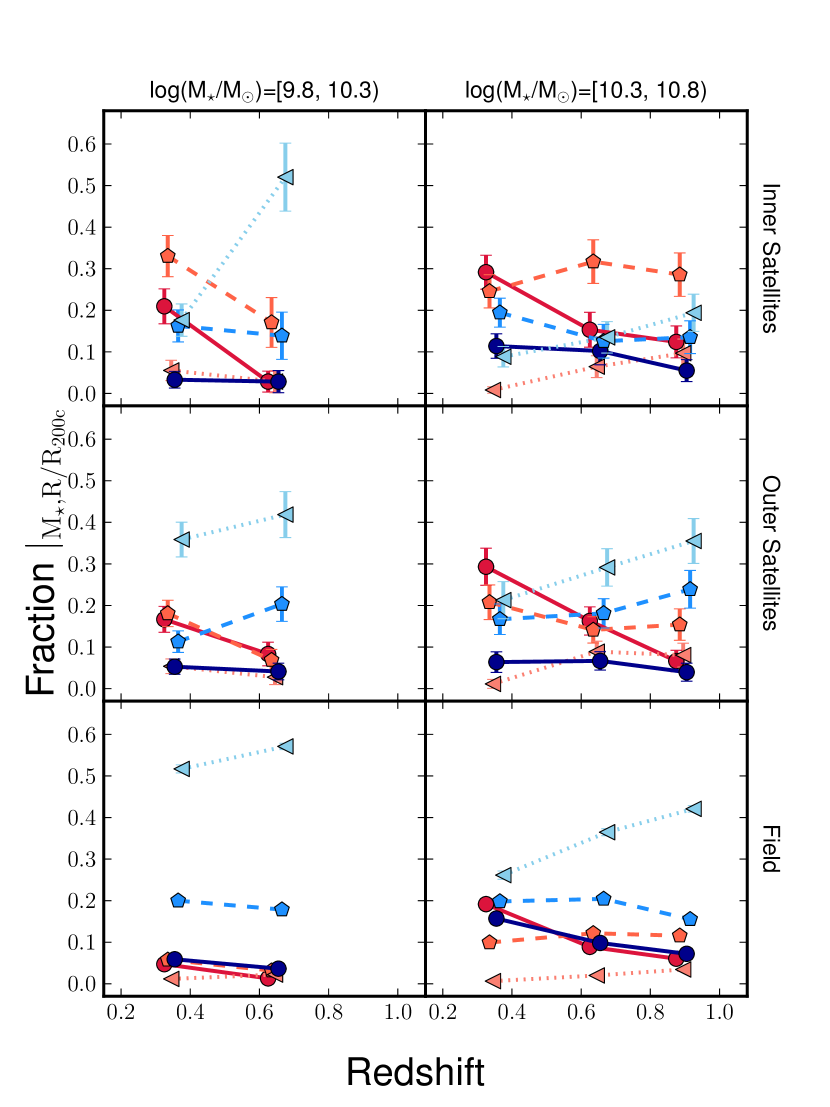
Since satellites tend to fall toward halo centers, group-centric distance is related to the timescale that galaxies have been inside the group. The range of redshifts sampled with this data set provides another measure of time to study evolution. Figure 4 is a transpose of Figure 3 to show the redshift trends in the distribution of colors and morphologies. Again, there is a decline in blue late disks among low-mass satellites near the centers of groups, now compensated by a rise in both red spheroidals and red bulge+disks. This trend weakens away from group centers and at higher masses.
3.3. Checks for Systematics
3.3.1 Environment
There are several possible biases or other effects in the data to consider in order to ensure the robustness of these results. First, we revisit the contamination of our satellite sample due to interloping field galaxies, discussed in Section 2.1. In Figures 2, 3, and 4 we have plotted values of population fractions for satellites corrected for contamination estimated from mock catalogs. Contamination corrections are always smaller than the statistical error bars estimated via bootstrapping, except for low mass blue disk galaxies where it is greater than the error because the field population is so large. Though the sample of satellites near is significantly contaminated by field galaxies, the corrections to the relative fractions of each galaxy type are small because the field populations are not markedly different from the outer satellites.
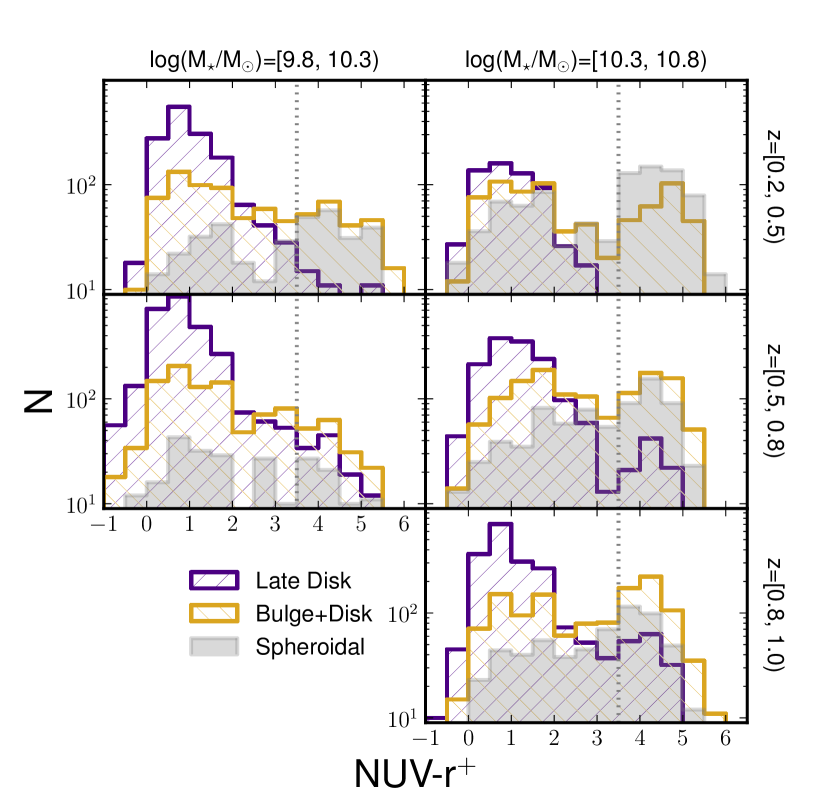
3.3.2 Color Distribution
When classifying galaxies by their spectral energy distributions (SEDs), our primary aim is to distinguish star-forming galaxies from those that are quenched. Though traditional indicators from emission lines or spectral breaks are not directly available from photometry, the 31-band SEDs used here provide a wealth of information about spectral types, including an estimate of dust extinction that separates star-forming galaxies that appear red due to dust from those that are truly passive. The template-based, extinction-corrected colors used in this paper generally have a bimodal distribution with the color cut from Section 2.2 falling on the red end of the “green valley.” The color distributions for different morphological types are shown in Figure 5. Shifting the cut slightly in either direction shifts the amplitude of the red fraction in Figures 2, 3, and 4 up or down, but the trends with group-centric distance and redshift do not vary significantly. We have tested an alternative “red sequence” selection suggested by Ilbert et al. (2010), , using rest-frame absolute magnitudes but applying no extinction correction. The transformation of blue late disks into red bulge+disks among low mass satellites is still evident. Similarly, applying the two-color cut in the , plane used by Bundy et al. (2010) does not qualitatively change our results.
3.3.3 Morphologies
Morphological classification is a challenging problem and significant scatter exists between the types assigned to galaxies in both visual and automated analyses. In general, visual analyses emphasize the presence or absence of spiral features, categorizing objects as spirals or ellipticals, often with an intermediate class of S0s grouped with ellipticals. Automated analyses measure structural parameters such as concentration and asymmetry which are then generally tied to a training set of visual classifications. The correlation between the properties measured is imperfect, so we test the impact on our results of using a variety of automated morphological classifications, all based on the ACS F814W imaging. The alternative classifications come from Tasca et al. (2009), which presented three separate techniques.
The differences between the results of each catalog and those from the ZEST classification used in this paper are driven by how bulge+disk galaxies are classified, since the other catalogs do not split the spiral/disk category into multiple bins as ZEST does. For instance, among the satellites used for Figure 2, the ZEST classifications are spheroidal, bulge+disk, late disk, and irregular or unclassified. The three separate classifications for these galaxies from Tasca et al. (2009) vary between E/S0s and spirals. When bulge+disk galaxies are mostly classified as E/S0s, the spheroidal populations (both blue and red) in Figures 3 and 4 are significantly elevated but show similar trends with group-centric distance and redshift. In the opposite case where bulge+disk galaxies are mostly treated as disks, the spheroidal fraction is essentially unchanged. While the dominant population in each panel of Figure 3 and 4 can change depending on which category the intermediate bulge+disk galaxies fall into, the radial trend in low mass satellites is unchanged; the blue late type fraction declines toward group centers and is compensated with a rise in red early types. The redshift trend for this transition is strongest for low mass satellites near group centers and weakens toward larger radii and stellar masses. Though the scatter between morphological classifications signals that our results should be interpreted and compared to others with caution, the significant trends with group-centric distance and redshift for the intermediate bulge+disk galaxies suggests that the ZEST classification has identified a population in transition.
3.3.4 A Population of Blue Spheroidals
While the tests described above suggest that our measures of environment, color, and morphology are robust, we do note a puzzling population of massive blue spheroidals that can be seen most clearly in the bottom right panel of Figure 4 as well as the right column of Figure 5. Those plots suggests that half of all spheroidals in that stellar mass range are blue, exceeding measurements in other studies (e.g. Kaviraj et al., 2007, 2008; Bamford et al., 2009; Schawinski et al., 2009; Ilbert et al., 2010), but see also Cross et al. (2004) who found a large fraction of blue ellipticals in a luminosity-selected sample at moderate redshift. We see a similarly large blue fraction among spheroidals at higher masses (, not plotted) where spheroidals make up a higher proportion of all galaxies, and most prominently at low redshift (). Visual inspection of the ACS images of these galaxies suggest that show spiral or irregular features, although the structural parameters measured by the automated classifiers are all consistent with the red spheroidal population. We have also investigated the UV-optical and optical-IR colors of these massive blue spheroidals prior to template fitting, in addition to optical spectra for of these objects described in George et al. (2011). These data suggest that blue spheroidals are not typical star-forming galaxies but may have a small amount of recent star formation to which rest-frame UV measurements are particularly sensitive (e.g. Kaviraj et al., 2007, 2008). Another possible explanation is that there are unusual stellar populations that are not represented in the template fits used to derive our colors (see e.g. Smith et al., 2012, for a discussion of galaxy properties contributing to the “UV upturn”). While this population is interesting in its own right, it is most prominent at high stellar masses and does not show a strong dependence on environment, so we do not consider it further here.
4. Discussion and Conclusions
Our results indicate a complex relationship between color, morphology, stellar mass, and group-centric distance. Trends in color and morphology are distinct, and the use of a single property as proxy for galaxy type does not capture the whole picture. The most interesting trend seen is the shift in dominance among the low mass population from blue late disk galaxies in the outskirts to red bulge+disk types in group interiors. If part of one population was merely disappearing from the sample, either due to changes in mass or merging with other galaxies, then the other populations would all be expected to grow by an equal factor. The fact that the decline in one population is roughly balanced by the rise of a single other population suggests a transformation process. We now discuss these results in the context of past analyses, the physical implications of the present work, and future avenues to clarify the role of environment in galaxy evolution.
4.1. Connection to Previous Observations
There is a long history of research into the covariance between the stellar masses, colors, morphologies, and environments of galaxies and its evolution with time. After controlling for differences in stellar mass or luminosity, numerous studies at low redshift have found that color is more strongly correlated with environment than morphology (e.g., Kauffmann et al., 2004; Blanton et al., 2005; Christlein & Zabludoff, 2005; van den Bosch et al., 2008; Bamford et al., 2009; Skibba et al., 2009; Weinmann et al., 2009). The implication of these studies is that the well-known correlation between morphology and environment is secondary to correlations between morphology and stellar mass or color, with the latter properties more physically linked to environment. Still, some of these studies find residual correlations between morphology and environment after controlling for color and stellar mass or luminosity, particularly at low masses and among late to intermediate morphologies (Blanton et al., 2005; Weinmann et al., 2009; Skibba et al., 2012).
Moving from large low-redshift studies to moderate redshifts (), Balogh et al. (2009) and McGee et al. (2011) have shown that groups still host a higher fraction of red galaxies than the field, while Wilman et al. (2009) found an elevated S0 fraction in groups with a mildly significant rise with group-centric distance. This radial trend in morphology is the opposite of that seen in Figure 3 but may be due to a smaller sample size or the use of luminosity-weighted centroids, which have been shown to be a poorer tracer of halo centers measured by weak lensing when compared with the most massive galaxy used in this catalog (George et al., 2012).
Environmental trends at fixed stellar mass have been seen to weaken at higher redshift (e.g., Poggianti et al., 2008; Tasca et al., 2009; Cucciati et al., 2010; Iovino et al., 2010; Kovač et al., 2010), though recent analyses have shown clear differences between the fraction of star-forming galaxies across environments over a range of stellar masses at least up to (Cooper et al., 2010; Peng et al., 2010; George et al., 2011; Knobel et al., 2012). Tasca et al. (2009) and Kovač et al. (2010) have compared the dependence of colors and morphologies on local density and in groups in the COSMOS field, finding a stronger effect on color than on morphology, similar to the low redshift results and suggesting a longer timescale for structural transformations than for quenching star-formation. Muzzin et al. (2012) and Presotto et al. (2012) have also shown that the quenched fraction among satellites depends significantly on group-centric distance at these redshifts.
The results presented here extend this work to include radial trends in colors and morphologies from . Our X-ray group catalog gives a large, clean, and fairly representative selection of halos (Finoguenov et al., 2010), and has been well-calibrated based on its weak lensing signal (Leauthaud et al., 2010; George et al., 2012). We detect significant trends in both color and morphology with group-centric distance. Some previous studies measured weak or insignificant gradients in morphology by using a simple dichotomy of spirals and ellipticals, and we can reproduce these results when using a coarse morphological binning (see discussion in Section 3.3.3). But in contrast to those results, we see clear morphological gradients at fixed stellar mass and color once the morphological classification considers differences in the bulge content of disk galaxies.
The importance of this intermediate morphology between pure disks and spheroidals has been noted before in the context of S0 galaxies which have been known to dominate the evolution in the morphology-density relation (Dressler et al., 1997; Postman et al., 2005; Smith et al., 2005; Boselli et al., 2006; Moran et al., 2007; Oesch et al., 2010; Lackner & Gunn, 2013). Smith et al. (2005) also showed that morphological evolution occurs later in less dense regions than in the densest regions associated with clusters, with little evolution at intermediate densities from to followed by an increase in early types at lower redshift. There is a significant overlap between the intermediate bulge+disk population in our analysis and visually classified S0 galaxies although these bulge+disk galaxies are often classified slightly later along the Hubble sequence (Scarlata et al., 2007). Our results in Figure 4 broadly corroborate those of Smith et al. (2005) and add that color and stellar mass are also important dimensions when studying these trends.
4.2. Implications for Physical Mechanisms of Galaxy Transformation
The radial gradients and redshift trends measured in Section 3 suggest a transformation among low mass satellites from blue late disks into red bulge+disks and spheroidals. The mechanism for this transformation must affect both color and morphology, or more physically, the star formation rate and stellar kinematics. Some processes (see e.g. Boselli & Gavazzi, 2006, for a review) halt star formation without significantly altering stellar structure, such as gas removal via ram pressure stripping or weak tidal interactions, suppression of gas accretion within dense shock-heated environments, or quasar feedback. On the other hand, galaxy mergers and strong tidal interactions can affect both the distribution of gas needed to form stars as well as the stellar morphology. A third possibility is that color and morphology changes are physically coupled; bulge growth could stabilize a galaxy against disk fragmentation and suppress star formation (Martig et al., 2009), or gas loss may leave a disk unable to dissipate energy from tidal interactions or may drive instabilities leading to bulge growth. Yet another scenario is that a bulge only appears more prominent after a galaxy is quenched because the previously star-forming disk has faded.
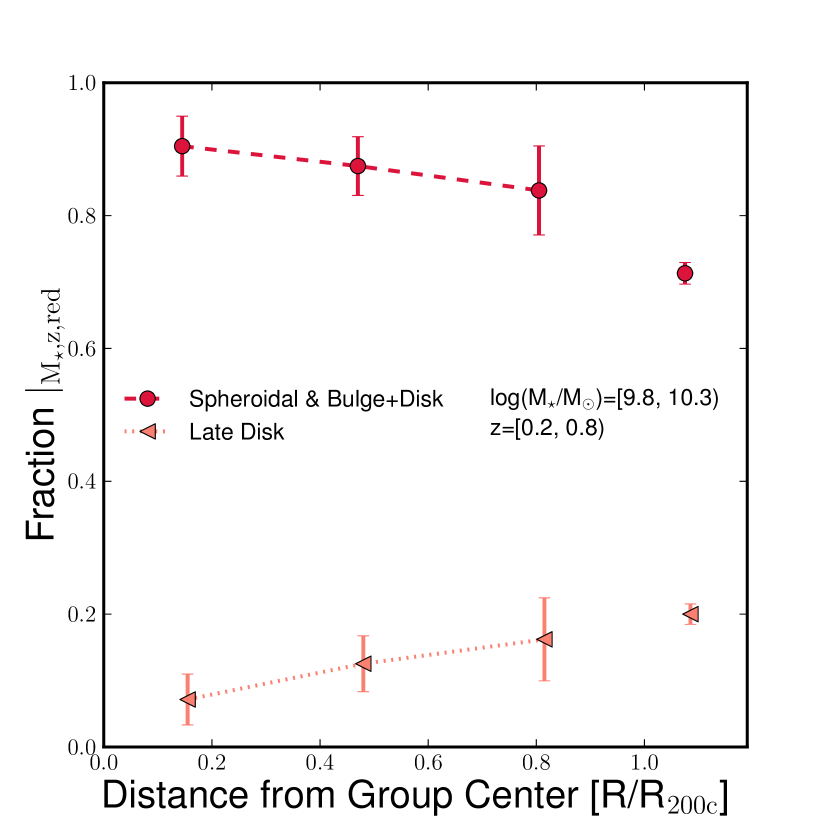
We can test these models by studying the morphological dependence on environment among quenched galaxies. Mechanisms like gas stripping or disk fading that do not directly affect morphology should produce a higher fraction of quenched galaxies in dense environments, but among quenched galaxies the morphological distribution should be constant across environments. On the other hand, if quenched galaxies in dense environments have more bulge-dominated morphologies than quenched field galaxies, it would suggest that mergers or strong tidal interactions altering the structure of galaxies occur in addition to, or in conjunction with, the suppression of star formation. The results of this test are plotted in Figure 6, where we show the fractions of red galaxies that are early and late type as a function of environment. We have used a broad redshift range and combined the spheroidal and bulge+disk categories to reduce statistical errors for this smaller population of red galaxies. Figure 6 demonstrates that quenched satellites, particularly those in the inner regions of groups, are more likely to be bulge-dominated than their field counterparts.
We interpret this to mean that some physical process in dense environments is driving bulge growth. Though some field studies (Bundy et al., 2010; Masters et al., 2010) have already noted a tendency of passive disks to be more concentrated than star-forming disks, we find that the morphological evolution of quenched galaxies is even stronger in groups. Our result is consistent with previous arguments favoring bulge growth over disk fading based on the higher typical luminosities of galaxies with intermediate morphologies compared to late types (Christlein & Zabludoff, 2004; Burstein et al., 2005). The data presented here show that even at fixed mass there must be bulge enhancement that accompanies quenching in groups.
The results of Figure 3 suggest that the timescale for the morphological transition from late disk to bulge+disk must be comparable to the timescale for quenching in order to turn blue late disks directly into red bulge+disk galaxies. For example, if quenching occurred via gas stripping or removal at a rate faster than any structural changes, we would expect to see blue late disks turning into red late disks. Instead we observe a growth in red galaxies with earlier morphologies whenever blue late disks decline. The fraction of blue late disks plummets by more than a factor of two in among inner satellites (top left panel of Figure 4), while the fraction of red late disks is nearly constant and the fraction of red bulge+disks grows. Similarly, we do not detect a large population of blue bulge+disk galaxies which might be expected if bulge growth happened faster than quenching. These observations suggest that some morphological evolution occurs on a similar timescale as quenching.
At the same time, the morphological transformation observed at low stellar masses has not fully turned many disks into spheroidals. The bulge+disk galaxies are still categorized as disks in the top level ZEST classification. This echoes earlier results finding a buildup of S0s in clusters but weaker evolution in the relative abundance of ellipticals (e.g., Dressler et al., 1997). Though the fraction of red spheroidals does not correlate significantly with group-centric distance (Figure 3), it does grow globally with time (Figure 4). This may indicate that different processes are responsible for producing bulge+disks and spheroidals.
The discreteness of morphological classification makes detailed comparison of transformations in morphology and color somewhat difficult, but the structural evolution appears to contrast with that in color, where a clear bimodality separates red and blue states and the relatively low intermediate population suggests a fast quenching timescale once it begins (e.g., Wetzel et al. 2012a, though see Balogh et al. 2011). One could test the hypothesis that galaxies pass through an intermediate state between blue late disk and red bulge+disk by measuring the time since quenching based on the SEDs of galaxies in these intermediate states. Is there a difference in the mean color of blue bulge+disks and blue late disks, or between red bulge+disks and red late disks? Figure 5 does not show conclusive differences in the colors of these populations, and the satellite sample size is too small to constrain differences in the distribution of colors within the red and blue populations. More detailed analysis with spectroscopic data could better constrain such evolutionary models.
The group environment can play an important role in building up the well-studied color-morphology-density relations in nearby clusters. A group of mass at should grow through mergers by an average of dex to (Fakhouri et al., 2010), so some of our high redshift groups will be the progenitors of massive clusters and others may accrete onto them. For comparison, a typical star-forming galaxy should grow by dex in stellar mass between each of our three redshift bins and by dex from to (Elbaz et al., 2011). Wetzel et al. (2012b) show that the dominant population of satellites in the most massive halos at were already satellites in groups when accreted. Our results demonstrate that both the color and morphology of these satellites are influenced in the group environment, showing the importance of “preprocessing” of galaxies prior to entering massive clusters. The bulge+disk population we see here is not quite as morphologically evolved as the growing S0 population seen at low redshift and in massive clusters, but likely precedes it.
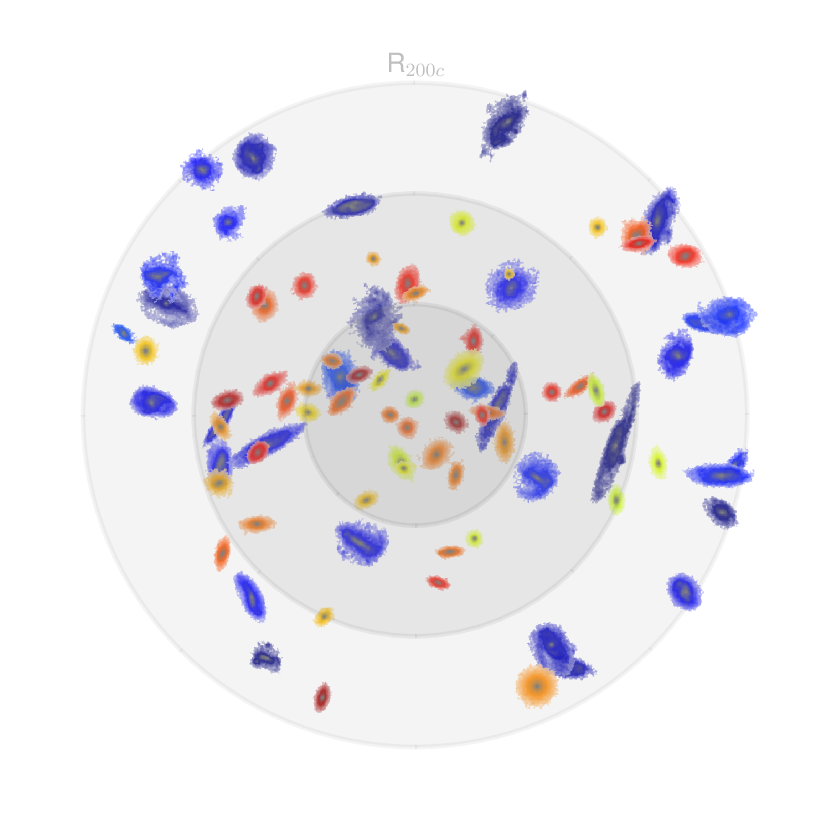
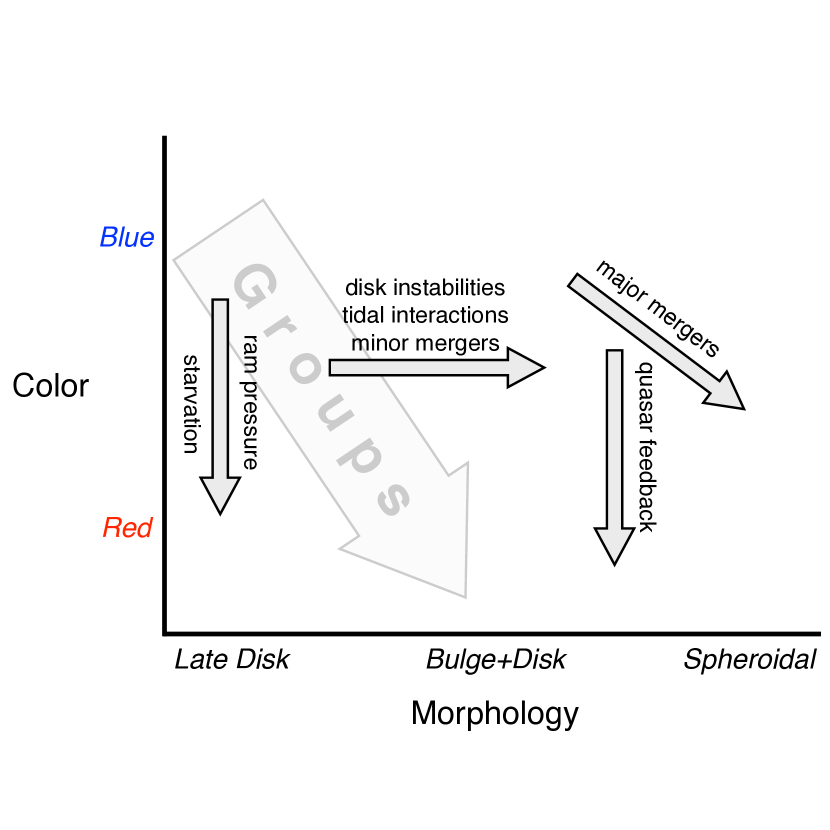
We summarize our main results and interpretation in Figure 7. The left panel shows the positions of satellites for a stacked group and highlights the trend in Figure 2 with blue late disks dominating the outskirts and red bulge+disk galaxies making up most of the inner satellite population. This combination of color and morphology transformations suggests some combination of gas removal and bulge growth, shown in the right panel. While the diagram is a simplification of a wide variety of model predictions, the primary point is that both color and morphology are affected in group satellites, so physical mechanisms that explain environmental correlations should reflect this.
4.3. Future Prospects
While these measurements add insight to the transformation of galaxy properties, much work remains to be done to constrain the variety of physical mechanisms that may be responsible. A cleaner bulge-disk decomposition would be useful to track the growth of bulges and the importance of disk fading (e.g., Lackner & Gunn, 2012, 2013). Incorporating the physical sizes of each component would also help to link these transformations with the significant growth seen in early types since (e.g., Bruce et al., 2012). With deep high-resolution imaging from HST, the CANDELS survey (Grogin et al., 2011; Koekemoer et al., 2011) is pushing these studies to higher redshift and should also allow bulge-disk decomposition to be studied at multiple wavelengths, identifying when and where star formation is happening or stopping. Alternatively, visual classifications from an ongoing Galaxy Zoo project in the CANDELS fields will track the evolution of spiral features and bars which are challenging for automated techniques. Impending wide field imaging surveys will add greatly to the statistics of these analyses.
Different measures of environment may also help disentangle the relevant physical mechanisms. While we have argued in favor of halo-based indicators (see George et al. 2011 for a discussion), the local galaxy density within a halo, in addition to group-centric distance, may shed light on galaxy-galaxy interactions and infalling substructure (e.g., Blanton & Berlind, 2007; Cibinel et al., 2012; Woo et al., 2012). However, this indicator is a noisy quantity affected by shot noise, redshift errors, and peculiar velocities, likely requiring deep and complete spectroscopic data for clean results. Larger surveys will also enable a wider range of halo masses to be probed at higher redshift. Comparison of different halo mass proxies can provide a test of environmental mechanisms, for example if X-ray bright groups are more efficient at ram pressure stripping satellites than groups with less hot gas.
These studies can also be extended to the interplay of environmental mechanisms with non-stellar components of galaxies, namely the gas content and central black holes in galaxies. Current and planned radio arrays will extend the study of neutral and molecular gas beyond the local Universe allowing a clearer picture of how star-formation is fed and quenched. And the growth of bulges seen in this paper should be connected with accretion onto the central black hole in order to explain the tight correlation seen locally between these components.
Finally, while we have simply presented an empirical description of the data here, we can extend this work by modeling the evolution of color and morphology with environment. Peng et al. (2010) and Wetzel et al. (2012b) present simple empirical descriptions of the fraction of quenched galaxies as a function of stellar mass and environment. Incorporating morphologies into this framework will further illuminate the physical processes at work that build up the environmental correlations we observe.
References
- Allevato et al. (2012) Allevato, V., et al. 2012, ApJ, 758, 47
- Balogh et al. (2009) Balogh, M. L., et al. 2009, MNRAS, 398, 754
- Balogh et al. (2011) —. 2011, MNRAS, 412, 2303
- Bamford et al. (2009) Bamford, S. P., et al. 2009, MNRAS, 393, 1324
- Blanton & Berlind (2007) Blanton, M. R., & Berlind, A. A. 2007, ApJ, 664, 791
- Blanton et al. (2005) Blanton, M. R., Eisenstein, D., Hogg, D. W., Schlegel, D. J., & Brinkmann, J. 2005, ApJ, 629, 143
- Blanton & Moustakas (2009) Blanton, M. R., & Moustakas, J. 2009, ARA&A, 47, 159
- Boselli et al. (2006) Boselli, A., Boissier, S., Cortese, L., Gil de Paz, A., Seibert, M., Madore, B. F., Buat, V., & Martin, D. C. 2006, ApJ, 651, 811
- Boselli & Gavazzi (2006) Boselli, A., & Gavazzi, G. 2006, PASP, 118, 517
- Bruce et al. (2012) Bruce, V. A., et al. 2012, ArXiv e-prints
- Bruzual & Charlot (2003) Bruzual, G., & Charlot, S. 2003, MNRAS, 344, 1000
- Bundy et al. (2010) Bundy, K., et al. 2010, ApJ, 719, 1969
- Burstein et al. (2005) Burstein, D., Ho, L. C., Huchra, J. P., & Macri, L. M. 2005, ApJ, 621, 246
- Cassata et al. (2005) Cassata, P., et al. 2005, MNRAS, 357, 903
- Chabrier (2003) Chabrier, G. 2003, PASP, 115, 763
- Christlein & Zabludoff (2004) Christlein, D., & Zabludoff, A. I. 2004, ApJ, 616, 192
- Christlein & Zabludoff (2005) —. 2005, ApJ, 621, 201
- Cibinel et al. (2012) Cibinel, A., et al. 2012, ArXiv e-prints
- Cooper et al. (2010) Cooper, M. C., et al. 2010, MNRAS, 409, 337
- Cross et al. (2004) Cross, N. J. G., et al. 2004, AJ, 128, 1990
- Cucciati et al. (2010) Cucciati, O., et al. 2010, A&A, 524, A2
- Dressler (1980) Dressler, A. 1980, ApJ, 236, 351
- Dressler et al. (1997) Dressler, A., et al. 1997, ApJ, 490, 577
- Elbaz et al. (2011) Elbaz, D., et al. 2011, A&A, 533, A119
- Fakhouri et al. (2010) Fakhouri, O., Ma, C.-P., & Boylan-Kolchin, M. 2010, MNRAS, 406, 2267
- Finoguenov et al. (2007) Finoguenov, A., et al. 2007, ApJS, 172, 182
- Finoguenov et al. (2010) —. 2010, MNRAS, 403, 2063
- Ford et al. (2012) Ford, J., et al. 2012, ApJ, 754, 143
- George et al. (2011) George, M. R., et al. 2011, ApJ, 742, 125
- George et al. (2012) —. 2012, ApJ, 757, 2
- Grogin et al. (2011) Grogin, N. A., et al. 2011, ApJS, 197, 35
- Ilbert et al. (2009) Ilbert, O., et al. 2009, ApJ, 690, 1236
- Ilbert et al. (2010) —. 2010, ApJ, 709, 644
- Iovino et al. (2010) Iovino, A., et al. 2010, A&A, 509, A40
- Kauffmann et al. (2004) Kauffmann, G., White, S. D. M., Heckman, T. M., Ménard, B., Brinchmann, J., Charlot, S., Tremonti, C., & Brinkmann, J. 2004, MNRAS, 353, 713
- Kaviraj et al. (2007) Kaviraj, S., et al. 2007, ApJS, 173, 619
- Kaviraj et al. (2008) —. 2008, MNRAS, 388, 67
- Knobel et al. (2012) Knobel, C., et al. 2012, ArXiv e-prints
- Koekemoer et al. (2007) Koekemoer, A. M., et al. 2007, ApJS, 172, 196
- Koekemoer et al. (2011) —. 2011, ApJS, 197, 36
- Kovač et al. (2010) Kovač, K., et al. 2010, ApJ, 718, 86
- Lackner & Gunn (2012) Lackner, C. N., & Gunn, J. E. 2012, MNRAS, 421, 2277
- Lackner & Gunn (2013) —. 2013, MNRAS, 428, 2141
- Leauthaud et al. (2010) Leauthaud, A., et al. 2010, ApJ, 709, 97
- Leauthaud et al. (2012) —. 2012, ApJ, 744, 159
- Lotz et al. (2004) Lotz, J. M., Primack, J., & Madau, P. 2004, AJ, 128, 163
- Martig et al. (2009) Martig, M., Bournaud, F., Teyssier, R., & Dekel, A. 2009, ApJ, 707, 250
- Masters et al. (2010) Masters, K. L., et al. 2010, MNRAS, 405, 783
- McGee et al. (2011) McGee, S. L., Balogh, M. L., Wilman, D. J., Bower, R. G., Mulchaey, J. S., Parker, L. C., & Oemler, A. 2011, MNRAS, 413, 996
- Moran et al. (2007) Moran, S. M., Ellis, R. S., Treu, T., Smith, G. P., Rich, R. M., & Smail, I. 2007, ApJ, 671, 1503
- Muzzin et al. (2012) Muzzin, A., et al. 2012, ApJ, 746, 188
- Navarro et al. (1996) Navarro, J. F., Frenk, C. S., & White, S. D. M. 1996, ApJ, 462, 563
- Oesch et al. (2010) Oesch, P. A., et al. 2010, ApJ, 714, L47
- Peng et al. (2012) Peng, Y.-j., Lilly, S. J., Renzini, A., & Carollo, M. 2012, ApJ, 757, 4
- Peng et al. (2010) Peng, Y.-j., et al. 2010, ApJ, 721, 193
- Poggianti et al. (2008) Poggianti, B. M., et al. 2008, ApJ, 684, 888
- Postman et al. (2005) Postman, M., et al. 2005, ApJ, 623, 721
- Presotto et al. (2012) Presotto, V., et al. 2012, A&A, 539, A55
- Scarlata et al. (2007) Scarlata, C., et al. 2007, ApJS, 172, 406
- Schawinski et al. (2009) Schawinski, K., et al. 2009, MNRAS, 396, 818
- Schmidt et al. (2012) Schmidt, F., Leauthaud, A., Massey, R., Rhodes, J., George, M. R., Koekemoer, A. M., Finoguenov, A., & Tanaka, M. 2012, ApJ, 744, L22
- Scoville et al. (2007) Scoville, N., et al. 2007, ApJS, 172, 1
- Skibba et al. (2009) Skibba, R. A., et al. 2009, MNRAS, 399, 966
- Skibba et al. (2012) —. 2012, MNRAS, 423, 1485
- Smith et al. (2005) Smith, G. P., Treu, T., Ellis, R. S., Moran, S. M., & Dressler, A. 2005, ApJ, 620, 78
- Smith et al. (2012) Smith, R. J., Lucey, J. R., & Carter, D. 2012, MNRAS, 421, 2982
- Tasca et al. (2009) Tasca, L. A. M., et al. 2009, A&A, 503, 379
- Tinker et al. (2012) Tinker, J. L., George, M. R., Leauthaud, A., Bundy, K., Finoguenov, A., Massey, R., Rhodes, J., & Wechsler, R. H. 2012, ApJ, 755, L5
- van den Bosch et al. (2008) van den Bosch, F. C., Aquino, D., Yang, X., Mo, H. J., Pasquali, A., McIntosh, D. H., Weinmann, S. M., & Kang, X. 2008, MNRAS, 387, 79
- Weinmann et al. (2009) Weinmann, S. M., Kauffmann, G., van den Bosch, F. C., Pasquali, A., McIntosh, D. H., Mo, H., Yang, X., & Guo, Y. 2009, MNRAS, 394, 1213
- Weinmann et al. (2006) Weinmann, S. M., van den Bosch, F. C., Yang, X., & Mo, H. J. 2006, MNRAS, 366, 2
- Wetzel et al. (2012a) Wetzel, A. R., Tinker, J. L., & Conroy, C. 2012a, MNRAS, 424, 232
- Wetzel et al. (2012b) Wetzel, A. R., Tinker, J. L., Conroy, C., & van den Bosch, F. C. 2012b, ArXiv e-prints
- Wilman et al. (2009) Wilman, D. J., Oemler, Jr., A., Mulchaey, J. S., McGee, S. L., Balogh, M. L., & Bower, R. G. 2009, ApJ, 692, 298
- Woo et al. (2012) Woo, J., et al. 2012, ArXiv e-prints