The Snapshot Hubble U-Band Cluster Survey (SHUCS). I. Survey Description and First Application to the Mixed Star Cluster Population of NGC 4041111 Based on observations made with the NASA/ESA Hubble Space Telescope, obtained at the Space Telescope Science Institute, which is operated by the Association of Universities for Research in Astronomy, Inc., under NASA contract NAS 5-26555. These observations are associated with program #SNAP 12229..
Abstract
We present the Snapshot Hubble U-band Cluster Survey (SHUCS), a project aimed at characterizing the star cluster populations of ten nearby galaxies (Mpc, half within Mpc) through new F336W (U band equivalent) imaging from Wide Field Camera 3, and archival BVI-equivalent data with the Hubble Space Telescope. Completing the UBVI baseline reduces the age-extinction degeneracy of optical colours, thus enabling the measurement of reliable ages and masses for the thousands of clusters covered by our survey. The sample consists chiefly of face-on spiral galaxies at low inclination, in various degrees of isolation (isolated, in group, merging), and includes two AGN hosts. This first paper outlines the survey itself, the observational datasets, the analysis methods, and presents a proof-of-concept study of the large-scale properties and star cluster population of NGC 4041, a massive SAbc galaxy at a distance of Mpc, and part of a small grouping of six giant members. We resolve two structural components with distinct stellar populations, a morphology more akin to merging and interacting systems. We also find strong evidence of a truncated, Schechter-type mass function, and a similarly segmented luminosity function. These results indicate that binning must erase much of the substructure present in the mass and luminosity functions, and might account for the conflicting reports on the intrinsic shape of these functions in the literature. We also note a tidal feature in the outskirts of the galaxy in GALEX UV imaging, and follow it up with a comprehensive multi-wavelength study of NGC 4041 and its parent group. We deduce a minor merger as a likely cause of its segmented structure and the observed pattern of a radially decreasing star formation rate. We propose that combining the study of star cluster populations with broad-band metrics is not only advantageous, but often easily achievable thorough archival datasets.
1 Introduction
The launch of the Hubble Space Telescope (HST) over two decades ago started a revolution in the study of extragalactic star clusters. The discovery of large numbers of young compact clusters in star-forming galaxies led to the suggestion that they could be the present-day analogues of globular clusters (see reviews of Whitmore, 2003; Larsen, 2004a). The question of whether these young clusters can survive for a Hubble time has still not been settled but their longevity appears to be critically dependent on environmental conditions within their host galaxies (de Grijs & Parmentier, 2007; Bastian et al., 2011). The installation of Wide Field Camera 3 (WFC3) on HST has vastly upgraded the imaging capabilities of the telescope shortward of Å. It is now much easier to measure the age and mass distributions of large populations of star clusters in galaxies, and address fundamental questions such as their long term survival chances. To obtain ages and extinctions for clusters younger than Gyr, it is essential to obtain photometry across the UBVI baseline (Anders et al., 2004a). Prior to WFC3, HST U band imaging of sufficient depth and spatial coverage was feasible for only a few regions of nearby galaxies (e. g. Smith et al., 2007; Anders et al., 2004b), and only distant systems in their entirety (e. g. Östlin et al., 2003; Adamo et al., 2010a).
All local, late-type giant galaxies host populations of young and intermediate-age star clusters, often with masses and densities that rival globular clusters. It has been proposed that the vast majority of stars are formed in clusters but that most of these clusters () rapidly dissolve (Lada & Lada 2003) due to the expulsion of residual gas from star formation. Clusters that survive this period of “infant mortality” can disrupt through stellar evolution, two-body relaxation and the tidal field of the host galaxy on Gyr timescales (Bastian & Gieles, 2008). There has been much debate in the literature over whether infant mortality exists, whether the later phases are mass-dependent or not (e. g. Lamers et al., 2005; Fall et al., 2005; Whitmore et al., 2007; Chandar et al., 2010; Bastian et al., 2011), and even if most stars do indeed form in clusters (Bressert et al., 2010). By conducting a survey of local star-forming galaxies, it will be possible to obtain large samples of clusters covering a wide range of masses and ages, and thus help answer several open questions.
In addition, the local environment has recently been suggested as a major contributor to cluster disruption (e. g. Elmegreen & Hunter, 2010; Kruijssen et al., 2011). The relationship between the formation of clusters and the properties of the host galaxy is, in fact, far from clear on both global and local scales, and a survey would help to investigate these relationships. So far, detailed studies of large numbers of clusters in small samples of galaxies (e. g. Meurer et al., 1995; Goddard et al., 2010; Adamo et al., 2011; Silva-Villa & Larsen, 2011) or small numbers of clusters in large samples of galaxies (Larsen, 2004b; Bastian, 2008; Mullan et al., 2011) have suggested that environments with a higher star-forming density form a higher fraction of their stars in clusters. This connection is also relevant to the link between galaxy interactions and increased star formation. Since star clusters can trace bursts of star formation, they can then provide a viable chronometer for the interaction history of a galaxy.
Naturally, understanding the physics that govern these clusters is essential to utilizing them as tracers of star formation. After two decades of HST-driven research, several cluster parameters are considered as standard, such as their distributions of luminosity and size. Perhaps most notably, many studies have investigated the star cluster mass distribution, with a common finding that it can be represented by a power law of index near (e. g. Zhang & Fall, 1999; de Grijs et al., 2003; Bik et al., 2003). More recent studies have, however, suggested that the true form is that of a Schechter function, a power-law distribution with an exponential truncation at high masses. This reflects the mass function of Giant Molecular Clouds (e. g. Solomon et al., 1987), out of which star clusters form. The slope also appears to be a function of brightness, that is to say, the brighter the subsample, the steeper the extracted slope (Gieles, 2010). In addition, preliminary indications suggest that the characteristic ‘Schechter mass’, , where the truncation occurs, depends on environment (Larsen, 2009; Gieles, 2009; Bastian et al., 2012). Again, a large survey of clusters in a variety of host galaxies will be able to settle this issue.
Another parameter of interest is the star cluster size distribution and whether this is related to environment and/or age. Observations indicate that effective radii are constrained to a range of 0.5 – 10 pc despite the large dynamic range in cluster mass (Portegies Zwart et al., 2010). The observed radius distribution is well described by a log-normal distribution with a peak at 3–4 pc for both young clusters (Barmby et al., 2006; Bastian et al., 2011) and old globular clusters (e. g. Jordán et al., 2005), with the exception of the “faint-fuzzy” clusters discovered by Larsen & Brodie (2000). There are indications that the cluster core radius increases with age (e. g. Mackey & Gilmore, 2003a, b; Scheepmaker et al., 2007; Bastian et al., 2008; Hurley & Mackey, 2010). A survey of cluster sizes in different environments within galaxies will permit studies of the cluster size distribution as a function of age and environment.
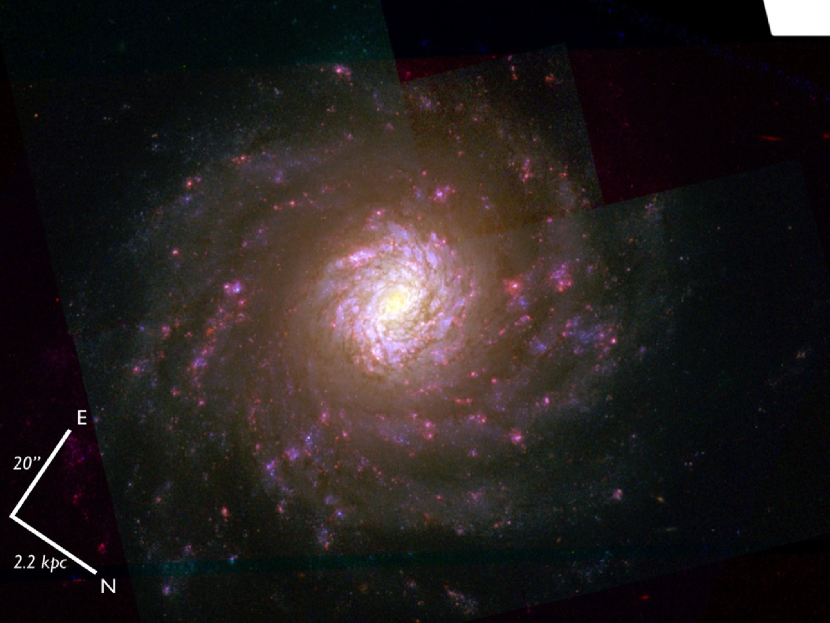
From the above, it is clear that an extensive survey of a large sample of star clusters in a variety of environments, aimed at measuring their age, mass, and size distributions, will address many fundamental questions regarding their properties, survival rates, formation histories, and related environmental dependencies. In this paper, we describe such an endeavor: the Snapshot Hubble U-band cluster survey (SHUCS) combines new WFC3 F336W (U band-equivalent) imaging with archival HST BVI-equivalent imaging, to measure the properties of large samples of young clusters in nearby (mostly Mpc) star-forming galaxies. We present a full description of the survey in terms of sample definition and data reduction (Section 2); the detection and photometry of star clusters, and the derivation of age, mass, and extinction (Section 3). In the second part of this paper, we present a proof-of-concept study for NGC 4041, a bright (mag, de Vaucouleurs et al., 1991) face-on SAbc galaxy with a double component disk (see Figure 1). In Sections 4 and 5, we discuss the large scale properties and the cluster populations of NGC 4041. We summarize this work, as well as our expectations for the full survey in Section 6.
2 The Survey: Target Selection and Data Reduction
To define our galaxy sample for WFC3-F336W imaging, we selected galaxies within 25 Mpc that have BVI images available in the HST archive. We restrict the sample to any galaxy imaged with the Advanced Camera for Surveys (ACS) or the Wide Field and Planetary Camera 2 (WFPC2), but imposed no constraints on image depth. We chose this distance limit and instrument set to ensure that individual star clusters are resolved and that deep WFC3 F336W imaging can be obtained with a 30 min exposure time. The depth is quantified as reaching mag at acceptable error levels, as will be demonstrated in Section 3.1. We excluded dwarf irregular galaxies as they typically host very few clusters (e. g. Seth et al., 2004), but do not impose a strict lower mass limit on the dataset.
| Name | RA | DEC | Morphology | Distance | Ref. | Other HST data | |||
|---|---|---|---|---|---|---|---|---|---|
| (h m s) | ( ) | (Mpc) | (M⊙) | ||||||
| NGC 247 | 00 47 10.49 | 20 46 09.00 | SAB(s)d | 3. | 6 | 9. | 06 | [1] | F110W, F160W (N) |
| NGC 672 | 01 47 54.06 | 27 25 55.80 | SB(s)cd | 8. | 1 | 9. | 43 | [2] | F658N (A) |
| NGC 891 | 02 22 32.90 | 42 20 45.80 | SA(s)b? | 10. | 2 | 10. | 84 | [1] | F250W (A), F656N (W2), F160W (N) |
| NGC 925 | 02 27 05.14 | 33 34 54.50 | SAB(s)d | 9. | 3 | 9. | 65 | [3] | F160W (N) |
| NGC 1003 | 02 39 16.40 | 40 52 20.40 | SA(s)cd | 11. | 1 | 9. | 44 | [3] | |
| IC 356 | 04 07 46.47 | 69 48 45.20 | SA(s)ab pec | 11. | 2 | 11. | 32 | [2] | F658N (A) |
| NGC 2146 | 06 18 37.71 | 78 21 25.30 | SB(s)ab pec | 17. | 2 | 11. | 04 | [4] | F658N (A), F160W (N) |
| NGC 2997 | 09 45 38.70 | 31 11 25.00 | SAB(rs)c | 12. | 2 | 10. | 61 | [2] | F220W, F330W (A) |
| NGC 3756 | 11 36 47.97 | 54 17 37.25 | SAB(rs)bc | 21. | 7 | 10. | 38 | [5] | F658N (A) |
| NGC 4041 | 12 02 12.17 | 62 08 14.20 | SA(rs)bc? | 22. | 7 | 10. | 55 | [2] | F658N (A) |
| NGC 6217 | 16 32 39.22 | 78 11 53.60 | (R)SB(rs)bc | 18. | 3 | 10. | 46 | [2] | F658N (A) |
Note. — Coordinates (J2000) correspond to the UVIS aperture positions. Morphologies are taken from de Vaucouleurs et al. (1991, in the NED homogenized notation), while distances are drawn from: [1] Willick et al. (1997); [2] Tully (1988); [3] Tully et al. (2009); [4] Kennicutt et al. (2011); [5] Springob et al. (2009). Stellar masses are derived through the ‘best’ photometry from 2MASS (Skrutskie et al., 2006). The final column (‘Other HST data’) lists non-proprietary imaging datasets from ACS (A), WFPC2 (W2), and NICMOS (N) in the MAST archive using filters other than BVI-equivalents. NGC 6217 was scheduled and observed with UVIS/F336W, but the observation failed.
The resulting sample of 22 galaxies was drawn from the combined target lists of the 11 Mpc H Ultraviolet Galaxy Survey (11HUGS; Kennicutt et al., 2008); the Local Volume Legacy survey (LVL; Dale et al., 2009); the ACS Nearby Galaxy Survey Treasury (ANGST; Dalcanton et al., 2009); the HST H Snapshot survey (HHsnap; Ho, 2003); and the Larsen (2004b) catalog. The last catalog on that list contained size measurements, photometry and information on morphology for clusters in galaxies with WFPC2 imaging in various filters (typically B, V and I equivalents) and ground-based UBVRI imaging. Like the present work, the Larsen study was also aimed at studying star clusters and their immediate environment.
Our Cycle 18 Snapshot program “HST U band Survey of Star Clusters in Nearby Star-Forming Galaxies” (PI Smith, ID 12229) was awarded 22 snapshot orbits, one for each of 22 proposed targets. Eleven galaxies were observed, as listed in Table 1, as per the nominal completion rate of 50% for SNAP programs (one observation failed). About half of observed galaxies are within Mpc, and four systems lie at Mpc. All exposures were taken with the F336W filter and the duration was 1800 s. A three-point dither line pattern was chosen to cover the chip gap and to aid in the removal of hot pixels, cosmic rays and other artifacts. Either the UVIS-FIX or UVIS2-FIX aperture was used depending on the spatial extent of the galaxy compared to the 162′′ 162′′ UVIS field of view. The precise pointings were chosen to give maximum overlap with the archival BVI observations.
Throughout this series we will use the Johnson filter notation with the specific HST filter subscripted, but will not at any point convert between the two systems. For example, F336W will be denoted as , while F555W and F606W, both roughly corresponding to Johnson band, will be written as and . The through base will be referred to as UBVI.
2.1 NGC 4041: Observations and Data Reduction
Our chosen proof-of-concept object was NGC 4041, a face-on SAbc galaxy near the upper end of our distance limit at 25 Mpc. This choice allows for a demonstration of the methodology of source selection and processing for approximately half the SHUCS galaxies, those at distances beyond Mpc. The processing and analysis of nearby systems will be outlined in a future paper. In addition, it offers an interesting study of environmental effects on star cluster formation and evolution in a structurally segmented system.
| Instrument | Date | Filter | Exposure | Program ID | P.I. Name |
|---|---|---|---|---|---|
| (s) | |||||
| WFC3/UVIS | 2011 Jan 30 | F336W | 1800 | 12229 | Smith |
| WFPC2 | 2001 Jul 04 | F450W | 320 | 9042 | Smartt |
| WFPC2 | 2001 Jul 04 | F606W | 320 | 9042 | Smartt |
| WFPC2 | 2001 Jul 04 | F814W | 320 | 9042 | Smartt |
| ACS/WFC | 2004 May 29 | F814W | 120 | 9788 | Ho |
| ACS/WFC | 2004 May 29 | F658N | 700 | 9788 | Ho |
We discuss the structure and environment of this galaxy in Section 4 and show a composite HST image in Figure 1. The HST observations of NGC 4041 are shown in Table 2. The archival , , , and H (F658N) data were obtained by two separate programs (9042 and 9788). All data were retrieved from the Mikulski Archive for Space Telescopes (MAST) and each dataset was combined, corrected for geometric distortion, and drizzled to the native pixel scale using multidrizzle (Koekemoer, 2005; Fruchter & Sosey, 2009). For each WFPC2 image, two undithered exposures were obtained. These were drizzled separately for each CCD and the final pixel scale was (PC) and (WF2, 3, 4). The ACS F658N data consisted of a pair of images and these were drizzled to a pixel scale of . Only a single F814W ACS image was taken; cosmic rays were removed using the lacosmic task (van Dokkum, 2001) and the resultant image drizzled. For the WFC3/UVIS data, three dithered images were obtained and these were drizzled to a pixel scale of .
We have not corrected the images or photometry for charge transfer efficiency (CTE) degradation. The ACS images were taken two years after the instrument was installed and CTE losses at this epoch are negligible (Ubeda & Anderson, 2012). CTE losses are apparent in the individual WFC3/UVIS images but the background is above the critical level of 5 electrons where CTE losses are severe (see Noeske et al., 2012). Given that there was no correction available when we processed the WFC3 data, and the CTE losses are a small effect, we have not taken CTE losses into account. For WFPC2 data, no CTE trails are apparent in the images because of the fairly high backgrounds and we have therefore not applied any photometric corrections to the WFPC2 data.
3 Selection of Star Cluster Candidates and Data Products
Star clusters are only marginally resolved at the distance to NGC 4041, as the typical diameter of 7 pc subtends an angle of on the sky. This translates to one or two pixels on various HST cameras. A considerable drawback is hence the potential inclusion of stellar associations, which are not discriminated by automatic source detection algorithms (see Silva-Villa & Larsen, 2010; Bastian et al., 2011). Toward that end we employ the concentration index (CI), defined as the difference in brightness between two apertures: one comparable to the size of the point-spread function (PSF), and another representing the typical star cluster (see Whitmore et al., 2007). This technique helps to place clusters between stars, which have very small CI, and associations, at large CI. We will develop the use of this method in and Section 3.2.
With the above in mind, we developed a selection and photometry pipeline, which is run entirely in IRAF222 IRAF is distributed by the National Optical Astronomy Observatories, which are operated by the Association of Universities for Research in Astronomy, Inc., under cooperative agreement with the National Science Foundation. and consists of the following steps:
-
1.
Source selection in . We run DAOfind to select sources brighter than above background, measured on various parts of the image. We do not restrict ‘roundness’ (axial ratio) or ‘sharpness’ (size compared to the stellar full width at half-maximum), in order to include elliptical and marginally resolved clusters (the majority at this distance, as noted above).
-
2.
Coordinate transformation. Our dataset consists of images taken for different projects at various times and with different cameras, which often leads to overlapping, but not identical pointings. Our observations were designed for maximum overlap with the archival imaging, and hence serve as the reference frame for the World Coordinate System (WCS). The coordinate lists from Step 1 are converted from the frame to those of each instrument/pointing used in the study. This step uses the tmatch algorithm with typically some 20 reference sources (stars or compact clusters) that span the entire image as much as possible. The process is refined until the root-mean-squared errors for x and y positions do not exceed 0.1 px, a scale tested to eliminate source confusion. When registering WFPC2 data, the four CCDs are mapped individually, and the number of reference stars is usually ten or lower.
-
3.
Multi-band photometry. Photometric apertures of radius 012 are placed at the coordinates defined in Step 2, with the background measured locally in annuli of 02 to 03, depending on the pixel scale of each camera and the corresponding PSF. These values were derived after testing the typical growth curves of modeled stellar PSFs generated with Tinytim (Krist et al., 2011), coupled with the STScI Focus Model Utility333http://www.stsci.edu/hst/observatory/focus/FocusModel to account for breathing at the time of observation. We note that these values will be revised for each galaxy depending on its distance. We do not allow the DAOphot task to re-center sources as the differing pixel scale between cameras introduces non-negligible positional uncertainties. Given the employed pixel scales of the WFC3/UVIS (0040 px-1), ACS/WFC (0050 px-1), WFPC2/PC (0045 px-1), WFPC2/WF (0100 px-1), the radius of the applied photometric aperture corresponds to image sizes of 3.0, 2.4, 2.7, and 1.2 px respectively. In the test case of NGC 4041, these translate to a physical radius of 13.4 pc, cf. the typical effective cluster radius of pc. The photometric error is computed according to the DAOphot recipe that takes into account the gain and readout noise of each detector. For cases where imaging from more than one HST camera is available in a given filter, we photometer all images and choose the measurement with the lowest associated error. We calibrate the photometry in the Vegamag system.
The photometric process is completed by the measurement of a CI for each source as the difference in brightness between apertures of one and three pixels. Such a technique has been demonstrated in the past to produce viable samples of star clusters at comparable distances (e. g. The Antennæ, Whitmore et al., 2007). More information can be found in Section 3.2.
-
4.
Photometric corrections. At this stage we correct for the size of the aperture. This has to be tailored to each galaxy individually, as the correction is dependent on distance and whether the sources are resolved or not. In addition, we do not always have enough bright, isolated clusters to derive growth curves. The corrections thus combine our own empirical deductions with the encircled energy curves given for each instrument. For the test case of NGC 4041, isolated sources were very rare, so corrections were derived through the growth curves of model PSFs, generated for each detector-filter combination with Tinytim. Finally, we add to our photometric errors a factor of 0.05 mag in quadrature, to account for uncertainties in the photometric zeropoints (for details see Adamo et al., 2010a), and correct for foreground extinction (Schlegel et al., 1998).
3.1 Completeness estimation
At the distance to NGC 4041, the bulk of its cluster population is nearly point-like. Therefore, we follow the traditional method of artificial star counts to estimate completeness. In future works focussed on nearby systems, however, we will use artificial clusters instead, to overcome the uncertainties introduced by stochastic variations of the colors of low-mass clusters (introduced by under-sampled stellar mass functions; see Fouesneau & Lançon, 2010; Popescu & Hanson, 2010; Silva-Villa & Larsen, 2011).
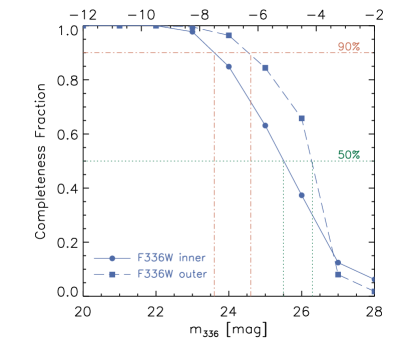
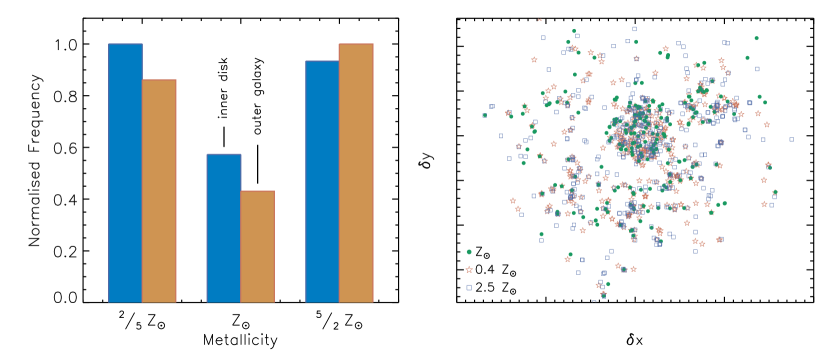
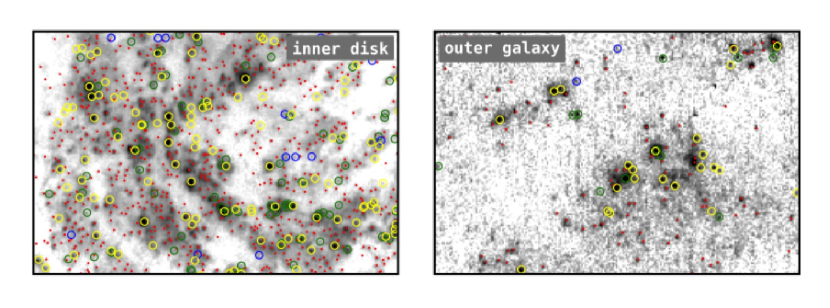
We created sets of artificial stars in a object grid, using the MKSynth algorithm of Larsen (1999). We used TinyTim models of the WFC3 PSF as described in Step (3) of the pipeline (Section 3). The generated objects were assigned magnitudes in the range [20, 30] mag, in steps of one magnitude. Since completeness varies with the local background (e. g. Scheepmaker et al., 2007), as well as crowding and confusion, we use two fields for this process: one covering most of the inner disk, and another, equally-sized field that covers the outer spiral structure. Results are presented in Fig. 2, where we show the 50% and 90% recovery fractions to occur at (25.5, 23.6) mag and (26.3, 24.6) mag for the inner disk and outer galaxy respectively.
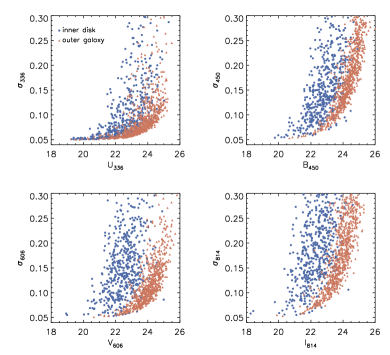
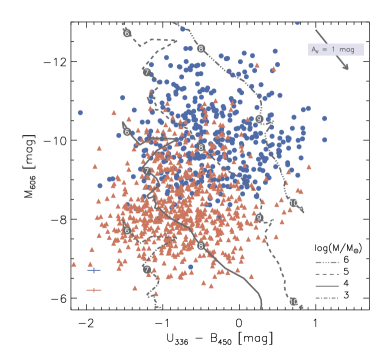
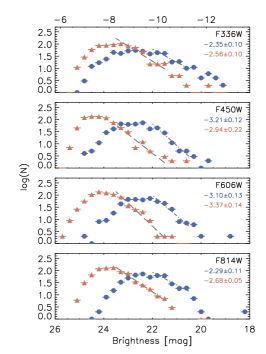
Another photometric property that will impact our star cluster analysis is the limiting filter. We estimate this through the brightness-error plot of Figure 3. Regular statistical measures, such as the standard deviation of the error distribution, provide no distinction between the BVI filters. We therefore look for the most irregular distribution and adopt as the limiting band.
3.2 Concentration Index
In Step 3 of the photometry pipeline (Section 3) we note the measurement of the CI, as the difference in magnitude between apertures of radius 1 and 3 px. We employ this metric in order to distinguish between star clusters and stellar associations, large, short-lived structures (see Portegies Zwart et al., 2010; Bastian et al., 2011, 2012) that can contaminate samples and affect the analysis of star cluster populations.
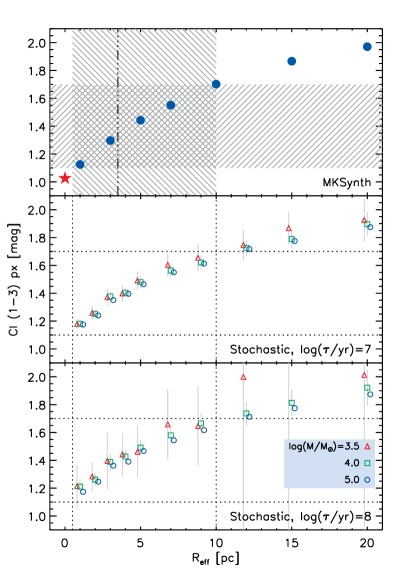
In order to employ a CI cut in our source filtering process, we test the theoretical expectation from modeled clusters of various ages and sizes. First we use MKSynth (see Section 3.1) to convolve an Elson et al. (1987) surface brightness profile with a PSF derived from point sources in our images. Since we could not identify suitable stars on the F336W image of NGC 4041, we employed SHUCS images of NGC 891 and NGC 2146. In addition, while various images are taken at different focus settings, the PSF does not change to a level that will affect our analysis – the effect is smaller than our typical photometric error of 0.1 mag. We assign a range of sizes to these model clusters, incorporate them on the F336W image and measure their CI in the same way as for the detected sources. The top panel of Figure 4 shows a plot of CI versus assigned radius. The first datapoint, at pc, denotes individual stars, which register values of mag. We therefore adopt a lower limit for cluster candidates at mag. We adopt an upper limit from the literature, as the CI of the largest observed clusters of approximately 10 pc (see size distributions of Larsen, 2004b; Barmby et al., 2006; Scheepmaker et al., 2007; Mayya et al., 2008; Bastian et al., 2012). The corresponding CI is 1.8 mag on Figure 4.
To confirm the asymptotic shape of this relation we employ clusters generated as aggregates of individually synthesized stars, following the methodology of Silva-Villa & Larsen (2010). Each star is represented by the empirical PSF described in Section 3.1 and a King profile of index , while the age, mass and effective (half-light) radius assume the following ranges:
The range of CI assigned to clusters is shown as a hashed area in the top panel of Figure 4, while in the center and bottom panels, the CI area is bracketed by dotted lines to aid illustration. The CIs of stochastically modeled clusters are slightly higher (by mag), owing to their King surface brightness profiles, chosen to generate more realistic older clusters.
The measured CI values of actual sources are plotted against brightness in Figure 5. Applying the above CI cut and the 90% completeness limits of Section 3.1, we restrict cluster candidates to a very specific part of photometric parameter space.

3.3 SED-fitting with Yggdrasil models: derivation of age, mass and extinction
The age, mass, and extinction of all candidate star clusters are derived through fits to their spectral energy distribution (SED) with Yggdrasil models (see Zackrisson et al., 2011, for a detailed description). Such a model set is ideal for our work, as it combines single stellar population (SSP) synthesis models with nebular spectra, both emission lines and continuum, and is tuned to the redshift of each galaxy. Analyses using Yggdrasil models have in the past been successful in describing the cluster populations of intensely star forming galaxies (e. g. Adamo et al., 2010b). For the SHUCS sample, we use Starburst99 SSPs (Leitherer et al., 1999; Vázquez & Leitherer, 2005), compiled using a Kroupa (2001) stellar initial mass function throughout the mass range M⊙; Padova stellar evolutionary tracks; and three different metallicities: 0.4, 1, and 2.5 times solar. We note no spatial trends in terms of metallicity, as shown in Figure 6. While this result might seem to oppose the well-established metallicity gradients in local spirals (e. g. in the Local Group; Cioni, 2009), the photometric derivation of metallicity is subject to large uncertainties. No firm conclusions can be drawn about the metallicity distribution. To reproduce the integrated fluxes of the earlier stages of cluster evolution, i. e. luminous H ii regions surrounding the recently formed stars, the models include a self-consistent treatment of the nebular emission performed with the Cloudy photoionization code (Ferland et al., 1998). The metallicities of the gas and the stars are assumed to be the same. Using the gas properties of typical local H ii regions (Kewley & Dopita, 2002) we assume a filling factor , a hydrogen density of cm-3, and a covering factor, i. e. fraction of ionizing photons absorbed by the gas, of . Different values of , , and only impact the SED fits for the very youngest clusters. We therefore never attempt to resolve the Myr age block, and accept a single, ‘young’ age for such sources.
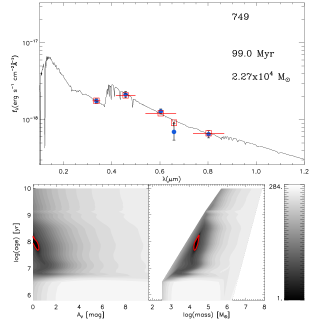
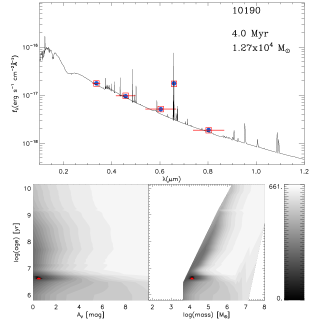
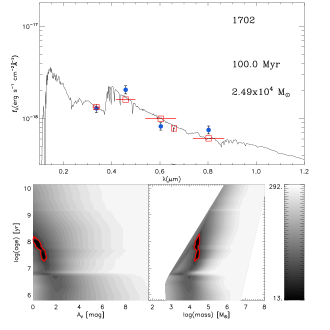
These models, together with the photometric catalogs, comprise the input for a least- fitting algorithm, as detailed in Adamo et al. (2010a). In brief, the program considers sources detected in four or more filters and applies the Cardelli et al. (1989) attenuation law at each age step to constrain the visual extinction in the line of sight. The final age, mass, and extinction are assigned to a cluster given the set of parameters that minimizes the . Uncertainties are carried through the fitting process. The program estimates the best reduced ( divided by the degrees of freedom), and saves, as the range of acceptable values, all the solutions with . The maximum and minimum age, mass, and extinction contained in this pool of likely solutions are assigned as errors. This is a typical method of estimating errors when the statistic is employed, e. g. the photometric fits of Bik et al. (2003) and the spectroscopic fits of Konstantopoulos et al. (2009). Lampton et al. (1976) provide a full reasoning.
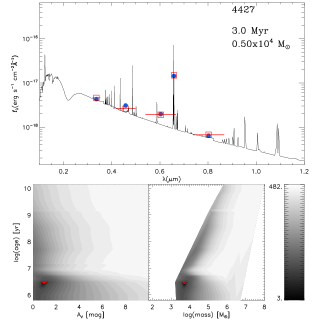
Example SED fits are shown in Figure 7. First we provide an illustration of the best fitting Yggdrasil model, with source photometry marked as filled dots. The red squares mark the best-fit model flux on the y axis, along with the central wavelength and bandpass of each employed HST filter. The plots of the bottom row plot in the age-extinction and age-mass spaces. Red contours mark the range of acceptable solutions to the SED fit, defined as . The top row of figure sets features two cluster candidates that meet the selection criteria (detailed in next section), while the ones in the bottom row do not.
3.4 Cluster candidate selection and data products
The primary data products of each study are a Photometry Table and an SED Table. These data products will be made available to the community in their entirety when the survey has been completed. The Photometry Table collects positional and photometric measurements and applies a photometric flag, , according to the following scheme:
-
1:
Source detected and photometered in UBVI,
-
11:
…plus UBVI errors less than 0.3 mag,
-
111:
…plus a CI in the range [1.1, 1.8] mag,
-
1111:
…plus brighter than the 90% completeness limit.
All analysis is performed on clusters with . The scheme is complemented by a second flag, +, which also considers the photometric quality in bands other than UBVI (in this case H), and is marked with a similar sequence of the number 2 for clarity (2, 22, 222, 2222). The effect of filtering the sample across the UBVI baseline on photometric completeness is negligible, and will be discussed fully in the context of the luminosity functions of Section 5.2.
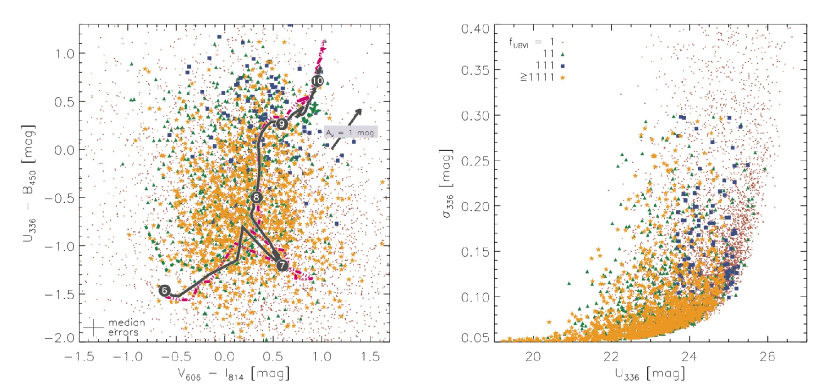
This filtering process, as applies to NGC 4041, is demonstrated in Fig. 8. The top row shows two segments of our F336W image where we mark sources with of 1 through 1111 as red dots and green, blue, and yellow circles. The radius of 3 px matches the photometric aperture in . The bottom row shows a UBVI color diagram, color-coded in the same way, to demonstrate the effect of each filter on the selection process, along with the corresponding brightness-error plot. From these images it is clear that the distance to this galaxy gives rise to a crowded field of clusters and associations. Coupled with the stochastic variations in the light profile (present at all distances), this severely cuts down the number of clusters for which reliable size measurements can be performed. At Mpc one UVIS pixel corresponds to pc, while one WFPC2/WF pixel is pc. PSF deconvolution codes (e. g. IShape; Larsen, 1999) have been demonstrated to resolve features as small as px on HST imaging, which corresponds to just under pc. That way, the smallest effective radius that can be sampled is pc. It is doubtful that such a source would have a sufficiently high signal-to-noise ratio to be detected, however, as a test run of IShape on NGC 4041 fit only large clusters, typically pc. This topic will be revisited in future SHUCS works that treat nearby systems.
In addition to the photometry flags, the Photometry Table also marks each source with an integer between 1 and 4 to denote which WFPC2 CCD covers the source. A value of ‘9’ marks a detector other than WFPC2, while ‘0’ indicates that a source is covered by WFPC2, but it is too close to the edge of the image. This flag is then repeated for each filter in the analysis, standardized as U, B, V, H, I, J (e. g. NICMOS-F110W), H (e. g. NICMOS-F110W). The shorthand filter representations are defined in the table header. Positional information is also included, in the form of coordinates measured on the F336W image.
The results of the SED fits are collected in an SED Table, featuring a minimum, best-fit, and maximum value for age, mass, and extinction; the number of data points (bands) employed by the fit; and the reduced statistic of each fit.
4 The Structure and Environment of NGC 4041
We begin the analysis of the SHUCS dataset with the SA(rs)bc galaxy NGC 4041 (de Vaucouleurs et al., 1991). We adopt a distance of 22.7 Mpc and a corresponding distance modulus of 31.78 from Tully (1988). Given this distance modulus, we derive an absolute magnitude of mag, according to its Sloan Digital Sky Survey Data Release 6 (SDSS; York et al., 2000; Adelman-McCarthy et al., 2008) model or Petrosian radius brightness.
In Figure 1 we showed an HST color-composite image of the galaxy in UBVI and H. The galaxy appears to have a partitioned structure, with tightly wound inner spiral arms giving way to a looser, outer network. The boundary is defined by a smooth, yellow bulge-like feature, suggestive of an old underlying stellar population. The bulge is overlaid with bright, blue star clusters and dust lanes, and it fades quite rapidly toward the outskirts of the galaxy, where blue star clusters can be found in large numbers. Finally, we observe the nuclear source to be split into two components with comparable fluxes, both offset from the center of the outermost isophote by and . The following sections treat the galaxy and its surroundings in more detail.
4.1 A complex isophotal structure
Multi-component spirals have been observed in the past, first the southern supergiant NGC 6902 (Gallagher, 1979), and then in the context of low surface brightness galaxies (Bosma & Freeman, 1993). Matthews & Gallagher (1997) observed such structures in a sub-sample of ‘extreme’ late-type galaxies. They also find offset central peaks in such galaxies, as do Odewahn et al. (1996) in another catalog of late-types, and Karachentsev et al. (1993) in Magellanic spirals. Matthews & Gallagher discuss the possibility of offset central peaks representing the true dynamical centers of their hosts, i. e. centers of gravity offset from the geometric or isophotal center. Marconi et al. (2003) touch on this scenario by suggesting that the dynamical center of NGC 4041 might be decoupled from its geometric center.
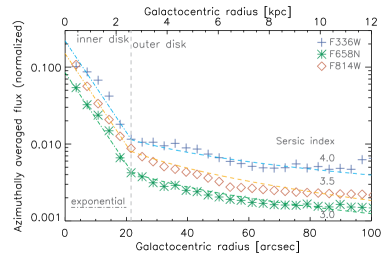
The composite structure of NGC 4041 is investigated further through plotting the surface brightness of the galaxy in azimuthally averaged bins, normalized to the central peak (despite the small central offset, to simplify illustration). This is shown in Figure 9, where the central exponential disk measures at a radius of (2.4 kpc) and we derive a radius of (9 kpc) for the outer galaxy from the optical isophotes. As noted above, the spiral structure is not discontinuous, with some spiral arms stemming from the flocculent inner structure and developing into loose outer arms. Across the disk the inter-arm distance increases from kpc to kpc, as measured on the F336W image, and the arm thickness is kpc. The inner disk follows an exponential profile, as is expected for the disks of spiral galaxies, while the outer disk is better described by Sersic (1968) profiles of high index, typical of early-type galaxies (e. g. Côté et al., 2006). The F336W profile shows a periodic fluctuation. While one might expect the population of young star clusters to contribute to this, Larsen (2004b) show the contrary: star clusters are never found to contribute more than 10% of the overall U band luminosity of a spiral galaxy (and up to 20% in starbursts).
4.2 Neighbors and Potential Companions
The complex structure of NGC 4041 could be the result of a past dynamical event, so we search the NASA Extragalactic Database (NED) for neighbors at accordant redshifts. We limit the search to galaxies in a cone of 1 degree about NGC 4041 and in a velocity space of km s-1. The search yields five neighbors, so the galaxy is by no means isolated. Details are given in Table 3, and a finding chart shown in Figure 10.
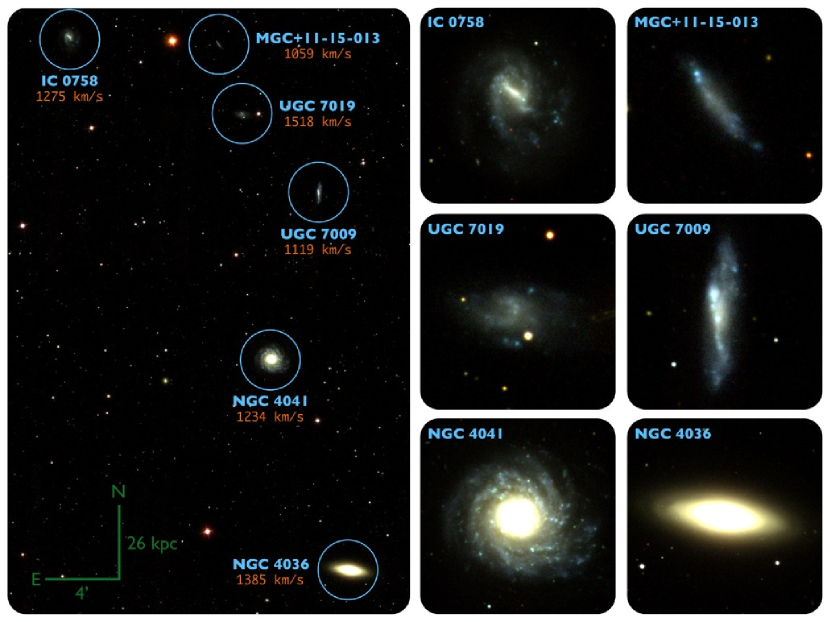
The first five galaxies in this list comprise group LGG 266 in the listing of Garcia (1993). The sixth, MGC+11-15-013, also fits the LGG catalog limiting criteria – a velocity difference of less than 600 km s-1 and a projected separation less than 0.52 Mpc – but was only discovered recently (Liske et al., 2003). Since we find no morphological classification for this galaxy in the literature, we inspect its band SDSS image to find a linear profile with no pronounced central peak. We therefore classify it as Irr. The close-up of Figure 10 shows a clumpy profile, but it is biased by bright star forming regions at the extremes of the disk that are not detectable in the band. The dominant galaxy of this group is NGC 4036, a lenticular. It features an inner equatorial dust lane and registers LINER emission (Véron-Cetty & Véron, 2006).
| ID | RA | DEC | SFR | Morphology | References | ||||
|---|---|---|---|---|---|---|---|---|---|
| (h m s) | ( ) | (mag) | (km s-1) | (M⊙ yr-1) | (M⊙) | ||||
| NGC 4036 | 12 01 26.7 | +61 53 45 | 11.97 | 1385 | 0.02 | 10. | 42 | S0 | [1] [1] [2] |
| NGC 4041 | 12 02 12.2 | +62 08 14 | 12.19 | 1234 | 0.63 | 10. | 58 | SA(rs)bc? | [1] [1] [3] |
| IC 0758 | 12 04 11.9 | +62 30 19 | 14.25 | 1275 | 0.19 | 9. | 26 | SB(rs)cd? | [4] [4] [3] |
| UGC 7009 | 12 01 44.1 | +62 19 33 | 14.33 | 1119 | 0.12 | 8. | 78 | Im | [4] [4] [4] |
| UGC 7019 | 12 02 29.4 | +62 25 02 | 15.05 | 1518 | 0.05 | Im | [5] [6] [7] | ||
| MGC+11-15-013 | 12 02 43.3 | +62 29 52 | 16.07 | 1059 | 0.03 | Irr | [4] [4] [4] | ||
Note. — Morphologies are taken from de Vaucouleurs et al. (1991), apart from MGC+11-15-013, which we classify in Section 4.2. Stellar masses are derived though ‘best’ 2MASS magnitudes (Skrutskie et al., 2006), except NGC 4041, for which we use an aperture of to match the measured aperture of the outer disk. SFRs are derived through GALEX FUV imaging (see Section 4.4). SDSS photometry is model photometry in the band, where applicable. Positions, photometry, and radial velocities are drawn from the following sources, quoted in triplets in column 7: [1] SDSS Data Release 6, Adelman-McCarthy et al. (2008); [2] Cappellari et al. (2011); [3] de Vaucouleurs et al. (1991); [4] SDSS Data Release 2, Abazajian et al. (2004); [5] Cotton et al. (1999); [6] VATT band photometry, Taylor et al. (2005); [7] Springob et al. (2005); The first five galaxies in this list make up group LGG 266 in the listing of Garcia (1993), and the sixth also obeys the inclusion criteria. Given the individual distance moduli, we derive absolute band magnitudes of , , , , , and mag.
4.3 Extended Structure
Upon inspecting GALEX UV imaging of NGC 4041 we find a faint, three-pronged feature to the south of the UV disk. It extends between and , or kpc. This ‘tidal fork’ is shown in the far-ultraviolet plus near-ultraviolet (FUV+NUV) image of Figure 11. We stack the two GALEX channels to boost the flux, and smooth by a three-pixel Gaussian kernel to remove noise. We present this image at high contrast to accentuate low surface brightness features. The contours mark optical brightness, derived by stacking the and SDSS images, and smoothing by a ten-pixel Gaussian kernel.
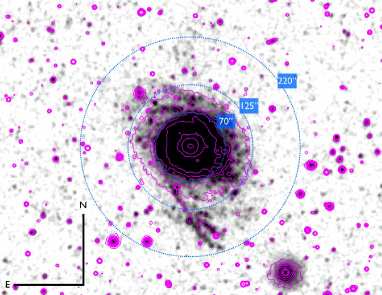
The feature is detectable in the UV image at the 3-5 level, but not quite as bright in the stacked and smoothed optical image ( detection). Assuming this is a tidal feature physically associated with NGC 4041, we can attribute it to a past interaction. The low flux denotes low or no H emission, and therefore no current star formation in the ‘fork’. The UV flux should then mostly originate from activity on the order of 100 Myr ago, rather than current star formation and O-stars.
4.4 Star Formation Rate, Stellar and Gas Mass
Since there are no published values for the star formation rate of NGC 4041, we apply the Kewley et al. (2002) methodology to obtain estimates from the IRAS infrared fluxes at m and m. In brief, we first employ the Helou et al. (1988) prescription to obtain the far-infrared flux, , from the IRAS fluxes, which we then convert to a luminosity through , where is the distance to the galaxy. We then use the Kewley et al. adaptation of the Kennicutt (1998) law to derive a FIR star formation rate (SFR) of 4.10 M⊙ yr-1 for NGC 4041. This compares well with galaxies of similar morphological type and brightness in the SINGS survey (Kennicutt et al., 2003). The flux ratio between 60 and 100 m of 0.44 is also in accord with SINGS.
We also obtained an FUV SFR for NGC 4041 through archival GALEX imaging, which we expect to be lower, due to the absorption of UV photons by dust. To estimate the flux from the target we fit it with the ELLIPSE function in IRAF and added up the counts corresponding to the two segments of the galaxy disk (assuming the above radii of and no ellipticity), while accounting for a flat background level and a foreground extinction of mag (following from Gil de Paz et al., 2007). Note that the low resolution of IRAS images does not allow for a similar treatment. We then convert fluxes to star formation rates of 0.18, 0.65 M⊙ yr-1 through the FUV Kennicutt (1998) relation. Considering the area of each segment, we derive SFR densities of M⊙ yr-1 arcmin-2, or M⊙ yr-1 kpc-2 for the inner disk and outer galaxy respectively. We apply the above methodology to also derive the FUV SFRs of the group around NGC 4041, and list results in Table 3. The observation of a markedly higher SFR density in the central regions of a galaxy is common in post-interaction systems, where gas is funneled inwards (Förster Schreiber et al., 2003; Konstantopoulos et al., 2009) until it is the nucleus alone that is experiencing a starburst, or until it ignites an active nucleus (Ellison et al., 2011).
Stellar masses, were derived by applying the Bell et al. (2003) prescription with a solar brightness of 3.32 mag to catalogued 2MASS photometry (Skrutskie et al., 2006). The faintest two members of the group are below the detection limit, and the obtained values for the four brighter galaxies are listed in Table 3. While we generally use the 2MASS ‘standard’ radius, in the case of NGC 4041 we use a radius of in order to envelop the entirety of the outer galaxy. This gives rise to a larger for NGC 4041 than NGC 4036, despite the brighter tabulated band magnitude of the latter. Additionally, we derive a specific SFR (sSFR) of NGC 4041, through division with the FIR SFR, of , consistent with the morphological type of NGC 4041 – cf. its near morphological counterparts HCG 7C and HCG 59A, that also register values (Konstantopoulos et al., 2010, 2012).
Finally, we look for information on the gaseous component of NGC 4041. The survey of Couto da Silva & de Freitas Pacheco (1989) offers a value of . We also use the CO luminosity published by Elfhag et al. (1996) to estimate the mass of molecular hydrogen in the system. We use the classical Milky Way conversion factor, M⊙ (Solomon et al., 1987), to convert the K km s-1 pc2 to a gas mass of . The combined gas mass, (the factor of accounts for helium, e. g. Hunter et al., 1982), is therefore . Divided by the SFR, we get a gas depletion timescale of Gyr.
4.5 A Possible Dynamical Event in the Recent Past
Many of the traits examined in this section are consistent with a past dynamical event in NGC 4041: a segmented brightness profile; a double central peak, offset from the isophotal center; a UV-bright tidal feature; and a markedly higher central SFR. Of particular interest is the offset central peak, which potentially represents the dynamically decoupled core of NGC 4041 (following Marconi et al., 2003). Such features herald past mergers (e. g. Emsellem et al., 2011), not interactions.
The group environment is thought to be conducive to dynamical events and accelerated galaxy evolution (e. g. Verdes-Montenegro et al., 2001; Johnson et al., 2007; Gallagher et al., 2010; Konstantopoulos et al., 2010, 2012). Furthermore, while a dense environment can enhance star formation during interactions (Martig & Bournaud, 2008), the effects of minor events are often not very pronounced, leaving but the faintest traces of their passing (Konstantopoulos et al., 2010). At the same time, compact galaxy groups have been nominated as the sites of lenticular galaxy formation (Wilman et al., 2009), as minor mergers build up mass and gradually exhaust the gas reservoir of the group, while retaining the structure of individual disks. The high-index Sérsic outer brightness profile for NGC 4041 (Figure 9) is more akin to a lenticular than a spiral.
The overall symmetry of the disk seems to rule out a major merger. We therefore propose an accretion event, perhaps that of a gas-rich dwarf, as the origin of the present star formation activity and the two-component disk of NGC 4041.
5 The Bimodal Star Cluster Population of NGC 4041
In the Introduction of Section 1 we argued that the understanding of a galaxy and its surroundings can be enhanced by a study of the star cluster population. We now present such a study for NGC 4041. We split the sources according to galactocentric radius (), in order to contrast the sub-populations of the inner and outer regions, and derive analysis only from high-confidence detections, i. e. sources flagged in Section 3.4 as .
5.1 Star Cluster Colours
The colors of star clusters are indicative of the age of the stellar population they represent, hence SSP models can be used to interpret the colors of cluster candidates across NGC 4041. The color-magnitude diagram (CMD) of Figure 12 plots the evolution of SSP models of various masses (from to M⊙), and shows dissimilar distributions for clusters in the inner and outer galaxy (blue circles/red triangles). While this hints at different mass functions, incompleteness will eliminate the low-luminosity end of the inner disk distribution. Still, such dramatic contrasts between subpopulations within a single system are not normally observed outside merging and interacting galaxies (e. g. Fedotov et al., 2011). We remind that no spatial trends were discovered in the metallicity distributions of clusters in the inner and outer galaxy (see Section 3.3), and note that the reddening distribution shows no change between inner disk and outer galaxy.
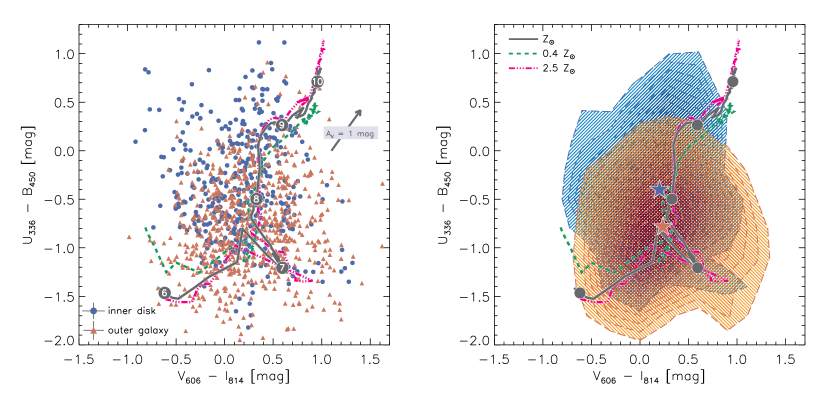
We further investigate this disparity through the color-color plot of Figure 13. As in the CMD of Figure 12, the model track spans the full evolution of an SSP, from 1 Myr to about 10 Gyr. The SSPs account for the transmission of nebular continuum and emission lines in the F606W filter. This extends the purely stellar SSP toward greener values and therefore cover sources that scatter toward the top left of the color distribution. We show color contours on the right panel to aid comparison, where blue and red shades represent the inner/outer galaxy. To avoid over-representing outliers we omit the lowest two contour levels, hence plotting only two-dimensional bins that sample at least 15% of the full population. Sources in the inner disk appear to often diverge toward bluer values. We attribute this to crowding and aperture effects: on the vertical axis, the flux is measured from WFPC2, at lower resolution; and on the horizontal axis, we might expect some contamination by the diffuse, irregularly distributed H emission in the inner disk. In addition, the colors of low-mass clusters might preferentially diverge toward this region of colorspace (Fouesneau & Lançon, 2010; Popescu & Hanson, 2010; Silva-Villa & Larsen, 2011). A third possibility is a variety of filling factors in the gas, which might lead to variations of up to 0.5 mag in the model tracks. Since we adopt a given filling factor and electron density, we might be underestimating the blue emission from these regions.
The loci of the color contours (on the right), indicated by stars, are offset by mag, while the overall distributions extend each other: younger ages are under-represented in the inner disk, and the outer galaxy shows few clusters older than 1 Gyr. This appearance is likely due to selection effects, namely the different detection limits in the inner disk and outer galaxy. On the young end, crowding in the inner disk might be responsible for this apparent lack of sources, especially ones with low mass. Furthermore, the higher SFR of the inner disk (Section 4.4) is expected to correlate with the number of young clusters.
Such a disjointed color distribution might be expected in a merger, cf. the cluster populations of the Antennæ (Whitmore & Schweizer, 1995), NGC 3256 (Trancho et al., 2007a, b), and most notably NGC 7252, which exhibits an inner star forming disk and an outer halo-type distribution (Miller et al., 1997; Schweizer & Seitzer, 1998). Even so, such an orderly inner-versus-outer galaxy distinction has not been noted in past analyses.
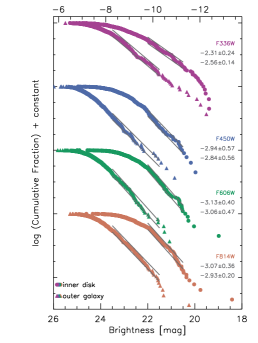
5.2 Luminosity Function
The Luminosity Function (LF) of star cluster populations is routinely observed to have a smooth, power-law shape, as noted in the Introduction. While this shape can be seen in the binned LF of Figure 14 (left), the cumulative functions on the right panel reveal a striking substructure of: (i) an incomplete part with an evolving gradient; (ii) a smooth, power-law segment; and (iii) a truncation at the bright end. This indicates that substructure may have been habitually ignored in the literature by arranging clusters in bins of arbitrary width (see the cautionary note of Maíz Apellániz & Úbeda, 2005).
| Filter | Fit Range (in/out) | Slope, unbinned (in/out) | Slope, binned (in/out) | |||
|---|---|---|---|---|---|---|
| (mag) | ||||||
| F336W (U) | ||||||
| F450W (B) | ||||||
| F606W (V) | ||||||
| F814W (I) | ||||||
| F336W (U) | ||||||
| F450W (B) | ||||||
| F606W (V) | ||||||
| F814W (I) | ||||||
We measure the slope from the cumulative function, in two ways. First we fit only the smooth part of each function, but maintain the fit consistent between the four bands. Then we fit over a large range, in order to emulate the effect of binning. The results, listed in Table 4, show shallower functions for the full range fit (consistent with the literature but slightly steeper than the canonical value of ), while selective fits of the power-law segment return steeper values. Fitting only the power-law part of each function provides the added advantage of not biasing the measurement according to physical parameters such as cluster age or reddening. Since young clusters tend to be much brighter than older ones, the bright end of the LF will largely represent the young part of the population. Our tests indicate that fitting the entire range can lead to very large errors and possible biases that are not present when fitting only the power-law segment.
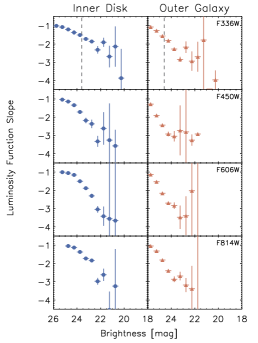
The returns markedly shallower fits than the rest of the bands, an effect noted in the literature review of Gieles (2010), where redder bands were shown to have steeper distributions. We note that the extinction does not change the slope of the LF (Larsen, 2002). The Gieles analysis also showed LF slopes to be a function of the mean luminosity. The mean brightness over which we fit (21 or 22 mag; see Table 4) translates to a luminosity of , corresponding to literature slopes of . We attribute the consistently steeper slopes derived from the binned histograms to sampling uncertainties, especially given the relatively small cluster population being fit. This discrepancy exemplifies the loss of information that occurs when binning LFs, while confirming the Gieles relation: the farther ‘up’ the function we move, the steeper the values become.
To confirm this link to the Gieles we plot the slope of the LF as a function of brightness. We measure in 0.5 mag bins across the range shown in the LFs of Figure 14 and find the slope to become steeper in proportion to the brightness. This evolution of the LF slope is shown in Figure 14. Our results therefore suggest that all LFs might display substructure (also seen in the cumulative LFs of Bastian et al., 2012), which would account for the Gieles relation, especially given its correlation with the range being fit.
The LFs also provide a test of photometric completeness. As outlined in Section 3.4, we select in F336W but apply filters that expect the detection of sources across the UBVI baseline. This implicitly includes the BVI bands in defining the completeness of our sample. In order to estimate this effect, we plotted the LFs by omitting the criteria pertaining to multi-band photometry and found the shape of each function to be unchanged by this process. The measured slopes were consistent within the errors with those listed in Table 4. We also examined the effect of potentially age-dependent reddening, by repeating the above exercise after limiting the age and extinction of the sample being fit. In all cases, the derived slopes were consistent with the fits of Table 4.
5.3 Mass Function
In order to quantify the cluster mass distributions in the inner and outer disk, we plot the Mass Function (MF) in Figure 15 as a set of cumulative distributions (counting from high-to-low mass). This plot will suffer from various incompleteness effects at different star cluster ages. On the young end we need to exclude short-lived, unbound stellar associations that masquerade as star clusters at large distances (Gieles & Portegies Zwart, 2011). Toward older ages, the diagram is affected by the evolutionary fading and reddening of SSPs. This decreases the mass-to-light ratio, therefore increasing the mass required to detect a star cluster with increasing age. These evolving detection limits are represented by the dotted and dashed lines (inner/outer galaxy) on Figure 15, and shape this parameter space.
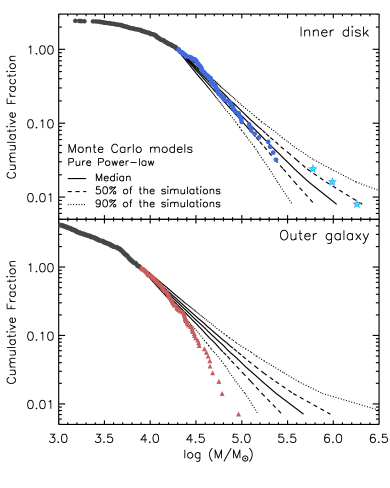
We therefore restrict the MF to cluster candidates aged between [10, 100] Myr. We note an offset of dex between the inner disk and outer galaxy, however the two functions display consistent slopes. Interestingly, the double-break structure reported for the LFs (Figure 14) persists in the MF, which displays an incomplete part, a power-law segment, and an upper truncation.
We investigate the origin of this segmentation by comparing to a set of power-law models, represented by the various markings on Figure 16. The slope is deduced as through this process, consistent with the literature-standard index of . In brief, we follow the methodology of Bastian et al. (2012) and run a series of models of the MF with a sample size equal to the observed sub-populations, and assume a power-law distribution. The slope is derived after few trial-and-error iterations. The median of all models is shown as a solid line, and dashed and dotted lines indicate the range containing 50% and 90% of all modeled outcomes. The observed functions are seen to diverge from the power-law models at the low-mass end, ]bf and also the and high-mass end for the outer galaxy. While incompleteness will affect low-mass clusters, at the high-mass end we expect to detect the vast majority of sources. This divergence is therefore established as a physical effect and the MF of the outer galaxy interpreted as a Schechter-type distribution with a truncation at . This follows on the analyses by Gieles (2009) and Larsen (2009) that favored Schechter MFs, and the truncation mass is in accord with the value derived for M83 by Bastian et al. (2012). As with the LF, the three-part structure of the MF suggests that binning acts to erase the information imprinted in the mass distribution.
5.4 Age Distribution and Cluster Disruption
Combining mass with age we obtain the diagram of Figure 16. The relative shift in mass noted above (Section 5.3) is obvious here as a vertical shift according to different detection limits, while the age distributions appear largely similar and not unlike others studied in the past. The three inner disk outliers at high mass and young age represent the double nuclear peak and another, nearby source. Assuming these are nuclear star clusters, we do not expected them to follow normal scaling laws (Seth et al., 2008; Scott & Graham, 2012); as mixed stellar populations their mass-to-light ratios will be unlike those of SSPs.
From the first age dex, , we can make a rough assessment of the state of star formation in NGC 4041. While the outer galaxy might have recently produced a larger overall number of clusters above the detection limit, the inner disk is consistently producing more massive clusters (the detection limit there is also brighter). The correlation between the mass of the most massive cluster in a system and the SFR (Bastian, 2008) indicates that the rate is higher in the inner disk, in accord with the value derived from the FUV fluxes (as noted in Section 4.4).
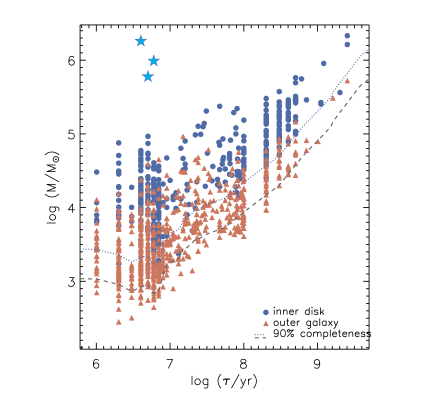
Interpreting the distribution at older ages is more complicated. The formation of a star cluster does not guarantee its perpetual existence, as star clusters face many disrupting processes over their early evolution (see Bastian & Gieles, 2008, for an overview). In that way the presence of a cluster in a certain age bin is modulated not only by the fading lines discussed above, but also its survival as a physical entity. To decouple evolutionary fading from disruption, we can fit the age-mass distribution with a suite of models of mass-dependent cluster disruption. A dependence on mass and environment was favored by the fits of Bastian et al. (2012) and we follow this methodology here. Other flavors of cluster dissolution – e. g. mass-independent (Fall et al., 2005), or purely environment-dependent (Elmegreen & Hunter, 2010) – or combinations thereof, may also be valid.
We perform a maximum likelihood analysis of the age and mass distributions, shown in Figure 17, given the cluster disruption formulations of Lamers et al. (2005) and Gieles (2009). This way we simultaneously compute and , the dissolution time of a M⊙ cluster. We employ a Schechter function and the modeled evolution of an Yggdrasil SSP in , the limiting filter (see Section 3.1, Figure 3). As with the LF analysis, we exclude sources younger than 10 Myr to avoid stellar associations, and take into account incompleteness at older ages (through the Yggdrasil model). This leaves the black dots of Figure 17, which are fit with models based on a range of variations of and .
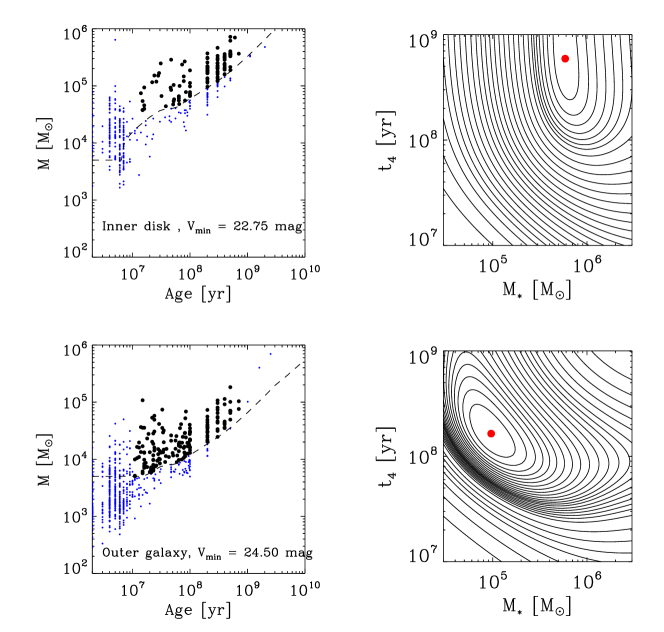
The fits favor a of a few hundred Myr in the outer galaxy and a longer time in the inner disk, contrary to Lamers et al. (2005), who found environment density to correlate inversely with . However, the small number of data-points in the inner disk provides broad confidence contours, expressed as shallow topography, therefore no deductions should be made from this fit. The seems to change significantly with local environment (inner/outer galaxy), in a manner consistent with the M83 study from which this methodology is derived: denser regions display higher .
5.5 Star Formation History
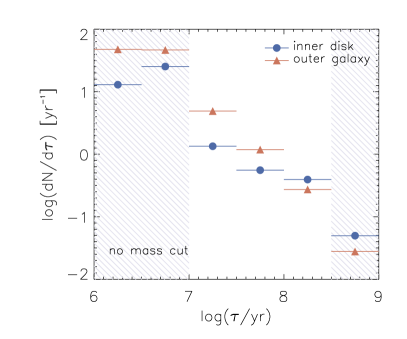
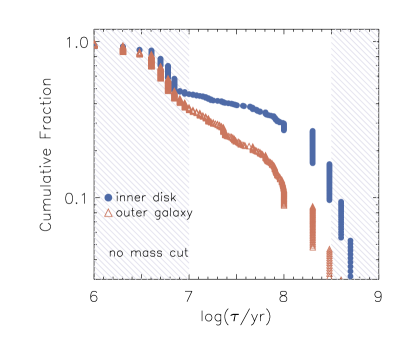
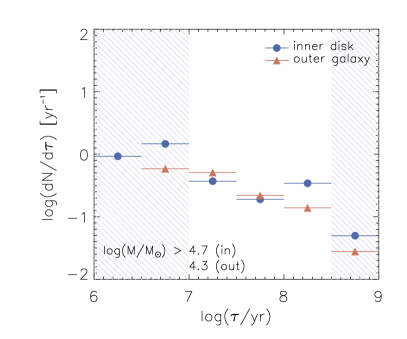
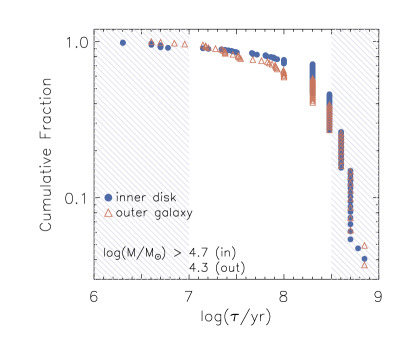
A final test for a physical difference between the inner/outer galaxy populations can be drawn from the cluster age distribution of Figure 18 (left panels, often referred to as a ‘ plot’), which counts the number of clusters surviving from every age-step of cluster formation (see Lamers et al., 2005; Fall et al., 2005; Whitmore et al., 2007; Chandar et al., 2010; Bastian et al., 2011, and references therein). When plotting all sources, as we do on the top panel, this diagnostic is affected by evolutionary fading and displays a power-law decline over time. Given a stable star formation history, setting a lower limit to the mass of a cluster sample will flatten the diagram to a certain age – the higher the mass cut, the farther back in time this diagnostic can reach.
In the bottom panel of Figure 18 we perform this exercise for a mass cut that ensures completeness to (Myr). The precise mass of each cut (different for the inner and outer galaxy) is extracted from the age-mass diagram of Figure 16, as the intersection of the line and the detection limit. The hashed regions are meant to guide the eye away from certain regions: the first two bins contain not only clusters, but also unbound associations; and the last bin is affected by incompleteness. That precaution leaves only three bins from which to make a deduction, hence we refrain from quantitatively characterizing the star formation history of NGC 4041 from this plot. We note, however, that future SHUCS analyses focussed on nearby galaxies will not lack this diagnostic power.
In previous Sections we have argued that binning the typically small data-sets of extra-galactic star cluster populations erases information contained in the individual data-points. In order to investigate this effect in the age distribution, we add two more plots to the right panels of Figure 18. There we modulate the age distribution by the mass of each cluster, to obtain a mass output plot. The full populations show a slight dissimilarity in their outputs over time, which, however, disappears when only plotting the complete sample of high-mass clusters.
5.6 A Possible Dynamical Event, Revisited
In all, the study of star clusters in NGC 4041 is in tune with the derivations of the traditional, broad-band diagnostics of Section 4. The color difference between inner and outer galaxy is mirrored in the differing color, luminosity, mass, and age distributions of the corresponding star cluster populations. Unfortunately, the plot is limited by the number of clusters available above the 90% completeness limit. Therefore, the past dynamical or accretion event deduced through multi-wavelength metrics above cannot be confirmed through the cluster population. In following SHUCS investigations, however, we expect the smaller distances to the galaxies targeted to offer an opportunity to explore their dynamical histories via the age distribution.
6 Summary
We have presented the observational and technical setup of the Snapshot Hubble U-band Cluster Survey (SHUCS), comprising new F336W (U-band equivalent) observations of 10 galaxies with existing BVI coverage. We will use this new imaging to complete the UBVI baseline, as required for the accurate photometric age dating of star clusters. The survey is focussed primarily on star clusters in the first Gyr of their evolution, and is aimed at understanding the formation and early evolution of these objects, as well as their utility as tracers of star formation history. In this paper we have also demonstrated the high scientific yield of combining star cluster statistics with broad-band, multi-wavelength metrics. We propose that, with large-scale information readily available from GALEX, SDSS, 2MASS, IRAS, and other surveys, this two-pronged approach is not only advantageous, but imperative in achieving a well-rounded understanding of each cluster population at hand.
This combined approach was demonstrated through the analysis of the large-scale properties and stellar populations of NGC 4041, a massive galaxy at the upper tier of the SHUCS distance scale (Mpc). This system features a complex physical and dynamical structure, expressed as a discontinuous brightness profile perhaps reminiscent of M64 from a different vantage point. We find a strong distinction in the colors and masses of star clusters when applying a cut in galactocentric distance where this break occurs, reminiscent of the color and age distributions in interacting and merging systems. Most notably, we find the inner disk to have been forming more massive clusters (M⊙) in the past Myr, despite the overall redder appearance of its subpopulation, which indicates an older mean age. This is in tune with our analysis of archival GALEX FUV imaging, which reveals a higher SFR in the inner disk than the outer galaxy, similar to post-starburst systems. This could be linked to the theoretical expectation of a higher star formation efficiency and a higher fraction of stars forming in clusters in regions of higher gas density (Kruijssen, 2012). We also discovered a tidal feature, which, combined with information in the literature, strongly favors an accretion event in the recent past (Myr) as the origin of the segmented morphology of NGC 4041.
Throughout the galaxy we found a truncation in the star cluster mass function, in accord with the recent studies (Larsen, 2009; Gieles, 2009). This truncation occurs at a higher mass in the inner disk, as expected by these recent results (Bastian et al., 2012). Furthermore, we found both the mass and luminosity function to break down into three segments when binning is abandoned in favor of cumulative distributions: one dominated by incompleteness, one following the familiar power-law shape, and one encompassing a truncation at the upper end. Our results strongly advocate for the use of all available information, rather than binning, when characterizing the age, mass, and luminosity distributions of star cluster populations. In this work we have sought that result through the use of cumulative distributions.
The strength of the survey-at-large derives from the availability of deep observations at the highest resolution available (currently HST-WFC3), enabling the precision age dating of hundreds of clusters per galaxy – potentially thousands in nearby galaxies. The full survey will consist of the analysis of the cluster populations of ten late-type galaxies of various morphological and spectroscopic types. In addition to the unprecedented statistical value of this analysis, we expect to focus a few works on individual systems, namely the ongoing merger in NGC 2146 (see the pilot study of Adamo et al., 2012), grand design spiral NGC 2997, and NGC 247, where we will contrast the star formation history derived from field stars to that derived from star clusters. Combined, the individual studies will help:
-
1.
Search for a characteristic value () in the cluster mass function.
-
2.
Empirically constrain star cluster disruption laws.
-
3.
Constrain the fraction of stars that form in clusters.
-
4.
Plot the star/cluster formation histories of SHUCS galaxies over the past Gyr.
-
5.
Determine whether cluster size is affected by local conditions.
-
6.
Search for environmental dependencies in all of the above.
References
- Abazajian et al. (2004) Abazajian, K., Adelman-McCarthy, J. K., Agüeros, M. A., et al. 2004, AJ, 128, 502, 502
- Adamo et al. (2011) Adamo, A., Östlin, G., & Zackrisson, E. 2011, MNRAS, 417, 1904, 1904
- Adamo et al. (2010a) Adamo, A., Östlin, G., Zackrisson, E., et al. 2010a, MNRAS, 407, 870, 870
- Adamo et al. (2010b) Adamo, A., Zackrisson, E., Östlin, G., & Hayes, M. 2010b, ApJ, 725, 1620, 1620
- Adamo et al. (2012) Adamo, A., Smith, L. J., Gallagher, J. S., et al. 2012, MNRAS, 426, 1185, 1185
- Adelman-McCarthy et al. (2008) Adelman-McCarthy, J. K., Agüeros, M. A., Allam, S. S., et al. 2008, ApJS, 175, 297, 297
- Anders et al. (2004a) Anders, P., Bissantz, N., Fritze-v. Alvensleben, U., & de Grijs, R. 2004a, MNRAS, 347, 196, 196
- Anders et al. (2004b) Anders, P., de Grijs, R., Fritze-v. Alvensleben, U., & Bissantz, N. 2004b, MNRAS, 347, 17, 17
- Barmby et al. (2006) Barmby, P., Kuntz, K. D., Huchra, J. P., & Brodie, J. P. 2006, AJ, 132, 883, 883
- Bastian (2008) Bastian, N. 2008, MNRAS, 390, 759, 759
- Bastian & Gieles (2008) Bastian, N., & Gieles, M. 2008, in Astronomical Society of the Pacific Conference Series, Vol. 388, Mass Loss from Stars and the Evolution of Stellar Clusters, ed. A. de Koter, L. J. Smith, & L. B. F. M. Waters, 353–+
- Bastian et al. (2008) Bastian, N., Gieles, M., Goodwin, S. P., et al. 2008, MNRAS, in press, arXiv:0806.1460, 0806.1460
- Bastian et al. (2011) Bastian, N., Adamo, A., Gieles, M., et al. 2011, MNRAS, L298+, L298+
- Bastian et al. (2012) —. 2012, MNRAS, 419, 2606, 2606
- Bell et al. (2003) Bell, E. F., McIntosh, D. H., Katz, N., & Weinberg, M. D. 2003, ApJS, 149, 289, 289
- Bik et al. (2003) Bik, A., Lamers, H. J. G. L. M., Bastian, N., Panagia, N., & Romaniello, M. 2003, A&A, 397, 473, 473
- Bosma & Freeman (1993) Bosma, A., & Freeman, K. C. 1993, AJ, 106, 1394, 1394
- Bressert et al. (2010) Bressert, E., Bastian, N., Gutermuth, R., et al. 2010, MNRAS, 409, L54, L54
- Cappellari et al. (2011) Cappellari, M., Emsellem, E., Krajnović, D., et al. 2011, MNRAS, 413, 813, 813
- Cardelli et al. (1989) Cardelli, J. A., Clayton, G. C., & Mathis, J. S. 1989, ApJ, 345, 245, 245
- Chandar et al. (2010) Chandar, R., Whitmore, B. C., Kim, H., et al. 2010, ApJ, 719, 966, 966
- Cioni (2009) Cioni, M.-R. L. 2009, A&A, 506, 1137, 1137
- Côté et al. (2006) Côté, P., Piatek, S., Ferrarese, L., et al. 2006, ApJS, 165, 57, 57
- Cotton et al. (1999) Cotton, W. D., Condon, J. J., & Arbizzani, E. 1999, ApJS, 125, 409, 409
- Couto da Silva & de Freitas Pacheco (1989) Couto da Silva, T. C., & de Freitas Pacheco, J. A. 1989, Rev. Mexicana Astron. Astrofis., 17, 127, 127
- Dalcanton et al. (2009) Dalcanton, J. J., Williams, B. F., Seth, A. C., et al. 2009, ApJS, 183, 67, 67
- Dale et al. (2009) Dale, D. A., Cohen, S. A., Johnson, L. C., et al. 2009, ApJ, 703, 517, 517
- de Grijs et al. (2003) de Grijs, R., Fritze-v. Alvensleben, U., Anders, P., et al. 2003, MNRAS, 342, 259, 259
- de Grijs & Parmentier (2007) de Grijs, R., & Parmentier, G. 2007, Chinese J. Astron. Astrophys., 7, 155, 155
- de Vaucouleurs (1948) de Vaucouleurs, G. 1948, Annales d’Astrophysique, 11, 247, 247
- de Vaucouleurs et al. (1991) de Vaucouleurs, G., de Vaucouleurs, A., Corwin, Jr., H. G., et al. 1991, Third Reference Catalogue of Bright Galaxies
- Elfhag et al. (1996) Elfhag, T., Booth, R. S., Hoeglund, B., Johansson, L. E. B., & Sandqvist, A. 1996, A&AS, 115, 439, 439
- Ellison et al. (2011) Ellison, S. L., Patton, D. R., Mendel, J. T., & Scudder, J. M. 2011, MNRAS, 418, 2043, 2043
- Elmegreen & Hunter (2010) Elmegreen, B. G., & Hunter, D. A. 2010, ApJ, 712, 604, 604
- Elson et al. (1987) Elson, R. A. W., Fall, S. M., & Freeman, K. C. 1987, ApJ, 323, 54, 54
- Emsellem et al. (2011) Emsellem, E., Cappellari, M., Krajnović, D., et al. 2011, MNRAS, 414, 888, 888
- Fall et al. (2005) Fall, S. M., Chandar, R., & Whitmore, B. C. 2005, ApJL, 631, L133, L133
- Fedotov et al. (2011) Fedotov, K., Gallagher, S. C., Konstantopoulos, I. S., et al. 2011, AJ, 142, 42, 42
- Ferland et al. (1998) Ferland, G. J., Korista, K. T., Verner, D. A., et al. 1998, PASP, 110, 761, 761
- Förster Schreiber et al. (2003) Förster Schreiber, N. M., Genzel, R., Lutz, D., & Sternberg, A. 2003, ApJ, 599, 193, 193
- Fouesneau & Lançon (2010) Fouesneau, M., & Lançon, A. 2010, ArXiv e-prints, arXiv:1003.2334
- Fruchter & Sosey (2009) Fruchter, A., & Sosey, M. 2009,
- Gallagher (1979) Gallagher, J. S. 1979, AJ, 84, 1281, 1281
- Gallagher et al. (2010) Gallagher, S. C., Durrell, P. R., Elmegreen, D. M., et al. 2010, The Astronomical Journal, 139, 545, 545
- Garcia (1993) Garcia, A. M. 1993, A&AS, 100, 47, 47
- Gieles (2009) Gieles, M. 2009, MNRAS, 394, 2113, 2113
- Gieles (2010) —. 2010, ASPC, 423, 123, 123
- Gieles & Portegies Zwart (2011) Gieles, M., & Portegies Zwart, S. F. 2011, MNRAS, 410, L6, L6
- Gil de Paz et al. (2007) Gil de Paz, A., Boissier, S., Madore, B. F., et al. 2007, ApJS, 173, 185, 185
- Goddard et al. (2010) Goddard, Q. E., Bastian, N., & Kennicutt, R. C. 2010, MNRAS, 405, 857, 857
- Helou et al. (1988) Helou, G., Khan, I. R., Malek, L., & Boehmer, L. 1988, ApJS, 68, 151, 151
- Ho (2003) Ho, L. 2003, in HST Proposal, 9788–+
- Hunter et al. (1982) Hunter, D. A., Gallagher, J. S., & Rautenkranz, D. 1982, ApJS, 49, 53, 53
- Hurley & Mackey (2010) Hurley, J. R., & Mackey, A. D. 2010, MNRAS, 408, 2353, 2353
- Johnson et al. (2007) Johnson, K. E., Hibbard, J. E., Gallagher, S. C., et al. 2007, AJ, 134, 1522, 1522
- Jordán et al. (2005) Jordán, A., Côté, P., Blakeslee, J. P., et al. 2005, ApJ, 634, 1002, 1002
- Karachentsev et al. (1993) Karachentsev, I. D., Karachentseva, V. E., & Parnovskij, S. L. 1993, Astronomische Nachrichten, 314, 97, 97
- Kennicutt et al. (2011) Kennicutt, R. C., Calzetti, D., Aniano, G., et al. 2011, PASP, 123, 1347, 1347
- Kennicutt (1998) Kennicutt, Jr., R. C. 1998, in ASPCS, Vol. 142, The Stellar Initial Mass Function (38th Herstmonceux Conference), ed. G. Gilmore & D. Howell, 1–+
- Kennicutt et al. (2008) Kennicutt, Jr., R. C., Lee, J. C., Funes, José G., S. J., Sakai, S., & Akiyama, S. 2008, ApJS, 178, 247, 247
- Kennicutt et al. (2003) Kennicutt, Jr., R. C., Armus, L., Bendo, G., et al. 2003, PASP, 115, 928, 928
- Kewley & Dopita (2002) Kewley, L. J., & Dopita, M. A. 2002, ApJS, 142, 35, 35
- Kewley et al. (2002) Kewley, L. J., Geller, M. J., Jansen, R. A., & Dopita, M. A. 2002, AJ, 124, 3135, 3135
- Koekemoer (2005) Koekemoer, A. 2005, Space Telescope European Coordinating Facility Newsletter, 38, 16, 16
- Konstantopoulos et al. (2009) Konstantopoulos, I. S., Bastian, N., Smith, L. J., et al. 2009, ApJ, 701, 1015, 1015
- Konstantopoulos et al. (2010) Konstantopoulos, I. S., Gallagher, S. C., Fedotov, K., et al. 2010, ApJ, 723, 197, 197
- Konstantopoulos et al. (2012) —. 2012, ApJ, 745, 30, 30
- Krist et al. (2011) Krist, J. E., Hook, R. N., & Stoehr, F. 2011, in Society of Photo-Optical Instrumentation Engineers (SPIE) Conference Series, Vol. 8127, Society of Photo-Optical Instrumentation Engineers (SPIE) Conference Series
- Kroupa (2001) Kroupa, P. 2001, in Astronomical Society of the Pacific Conference Series, Vol. 228, Dynamics of Star Clusters and the Milky Way, ed. S. Deiters, B. Fuchs, A. Just, R. Spurzem, & R. Wielen, 187–+
- Kruijssen (2012) Kruijssen, J. M. D. 2012, MNRAS, 426, 3008, 3008
- Kruijssen et al. (2011) Kruijssen, J. M. D., Inti Pelupessy, F., Lamers, H. J. G. L. M., et al. 2011, ArXiv e-prints, arXiv:1112.1065
- Lamers et al. (2005) Lamers, H. J. G. L. M., Gieles, M., Bastian, N., et al. 2005, A&A, 441, 117, 117
- Lampton et al. (1976) Lampton, M., Margon, B., & Bowyer, S. 1976, ApJ, 208, 177, 177
- Larsen (1999) Larsen, S. S. 1999, A&AS, 139, 393, 393
- Larsen (2002) —. 2002, AJ, 124, 1393, 1393
- Larsen (2004a) Larsen, S. S. 2004a, in Space Telescope Science Institute symposium series, Vol. 18, Planets to Cosmology: Essential Science in the Final Years of the Hubble Space Telescope, ed. M. Livio, & S. Casertano, astro–ph/0408201
- Larsen (2004b) —. 2004b, A&A, 416, 537, 537
- Larsen (2009) —. 2009, A&A, 494, 539, 539
- Larsen & Brodie (2000) Larsen, S. S., & Brodie, J. P. 2000, AJ, 120, 2938, 2938
- Leitherer et al. (1999) Leitherer, C., Schaerer, D., Goldader, J. D., et al. 1999, ApJS, 123, 3, 3
- Liske et al. (2003) Liske, J., Lemon, D. J., Driver, S. P., Cross, N. J. G., & Couch, W. J. 2003, MNRAS, 344, 307, 307
- Mackey & Gilmore (2003a) Mackey, A. D., & Gilmore, G. F. 2003a, MNRAS, 338, 120, 120
- Mackey & Gilmore (2003b) —. 2003b, MNRAS, 338, 85, 85
- Maíz Apellániz & Úbeda (2005) Maíz Apellániz, J., & Úbeda, L. 2005, ApJ, 629, 873, 873
- Marconi et al. (2003) Marconi, A., Axon, D. J., Capetti, A., et al. 2003, ApJ, 586, 868, 868
- Martig & Bournaud (2008) Martig, M., & Bournaud, F. 2008, MNRAS, 385, L38, L38
- Matthews & Gallagher (1997) Matthews, L. D., & Gallagher, III, J. S. 1997, AJ, 114, 1899, 1899
- Mayya et al. (2008) Mayya, Y. D., Romano, R., Rodríguez-Merino, L. H., et al. 2008, ApJ, 679, 404, 404
- Meurer et al. (1995) Meurer, G. R., Heckman, T. M., Leitherer, C., et al. 1995, AJ, 110, 2665, 2665
- Miller et al. (1997) Miller, B. W., Whitmore, B. C., Schweizer, F., & Fall, S. M. 1997, AJ, 114, 2381, 2381
- Mullan et al. (2011) Mullan, B., Konstantopoulos, I. S., Kepley, A. A., et al. 2011, ApJ, 731, 93, 93
- Noeske et al. (2012) Noeske, K., Baggett, S., Bushouse, H., et al. 2012, WFC3 UVIS Charge Transfer Eciency October 2009 to October 2011,
- Odewahn et al. (1996) Odewahn, S. C., Windhorst, R. A., Driver, S. P., & Keel, W. C. 1996, ApJ, 472, L13, L13
- Östlin et al. (2003) Östlin, G., Zackrisson, E., Bergvall, N., & Rönnback, J. 2003, A&A, 408, 887, 887
- Popescu & Hanson (2010) Popescu, B., & Hanson, M. M. 2010, ApJ, 724, 296, 296
- Portegies Zwart et al. (2010) Portegies Zwart, S. F., McMillan, S. L. W., & Gieles, M. 2010, ARA&A, 48, 431, 431
- Scheepmaker et al. (2007) Scheepmaker, R. A., Haas, M. R., Gieles, M., et al. 2007, A&A, 469, 925, 925
- Schlegel et al. (1998) Schlegel, D. J., Finkbeiner, D. P., & Davis, M. 1998, ApJ, 500, 525, 525
- Schweizer & Seitzer (1998) Schweizer, F., & Seitzer, P. 1998, AJ, 116, 2206, 2206
- Scott & Graham (2012) Scott, N., & Graham, A. W. 2012, ArXiv e-prints, arXiv:1205.5338
- Sersic (1968) Sersic, J. L. 1968,
- Seth et al. (2008) Seth, A., Agüeros, M., Lee, D., & Basu-Zych, A. 2008, ApJ, 678, 116, 116
- Seth et al. (2004) Seth, A., Olsen, K., Miller, B., Lotz, J., & Telford, R. 2004, AJ, 127, 798, 798
- Silva-Villa & Larsen (2010) Silva-Villa, E., & Larsen, S. S. 2010, A&A, 516, A10+, A10+
- Silva-Villa & Larsen (2011) —. 2011, A&A, 529, A25, A25
- Skrutskie et al. (2006) Skrutskie, M. F., Cutri, R. M., Stiening, R., et al. 2006, AJ, 131, 1163, 1163
- Smith et al. (2007) Smith, L. J., Bastian, N., Konstantopoulos, I. S., et al. 2007, ApJL, 667, L145, L145
- Solomon et al. (1987) Solomon, P. M., Rivolo, A. R., Barrett, J., & Yahil, A. 1987, ApJ, 319, 730, 730
- Springob et al. (2005) Springob, C. M., Haynes, M. P., Giovanelli, R., & Kent, B. R. 2005, ApJS, 160, 149, 149
- Springob et al. (2009) Springob, C. M., Masters, K. L., Haynes, M. P., Giovanelli, R., & Marinoni, C. 2009, ApJS, 182, 474, 474
- Taylor et al. (2005) Taylor, V. A., Jansen, R. A., Windhorst, R. A., Odewahn, S. C., & Hibbard, J. E. 2005, ApJ, 630, 784, 784
- Trancho et al. (2007a) Trancho, G., Bastian, N., Miller, B. W., & Schweizer, F. 2007a, ApJ, 664, 284, 284
- Trancho et al. (2007b) Trancho, G., Bastian, N., Schweizer, F., & Miller, B. W. 2007b, ApJ, 658, 993, 993
- Tully (1988) Tully, R. B. 1988,
- Tully et al. (2009) Tully, R. B., Rizzi, L., Shaya, E. J., et al. 2009, AJ, 138, 323, 323
- Ubeda & Anderson (2012) Ubeda, L., & Anderson, J. 2012, Study of the evolution of the ACS/WFC charge transfer efficiency,
- van Dokkum (2001) van Dokkum, P. G. 2001, PASP, 113, 1420, 1420
- Vázquez & Leitherer (2005) Vázquez, G. A., & Leitherer, C. 2005, ApJ, 621, 695, 695
- Verdes-Montenegro et al. (2001) Verdes-Montenegro, L., Yun, M. S., Williams, B. A., et al. 2001, A&A, 377, 812, 812
- Véron-Cetty & Véron (2006) Véron-Cetty, M.-P., & Véron, P. 2006, A&A, 455, 773, 773
- Whitmore (2003) Whitmore, B. C. 2003, in Space Telescope Science Institute symposium series, Vol. 14, A Decade of Hubble Space Telescope Science, ed. M. Livio, K. Noll, & M. Stiavelli, 153
- Whitmore et al. (2007) Whitmore, B. C., Chandar, R., & Fall, S. M. 2007, AJ, 133, 1067, 1067
- Whitmore & Schweizer (1995) Whitmore, B. C., & Schweizer, F. 1995, AJ, 109, 960, 960
- Willick et al. (1997) Willick, J. A., Courteau, S., Faber, S. M., et al. 1997, ApJS, 109, 333, 333
- Wilman et al. (2009) Wilman, D. J., Oemler, A., Mulchaey, J. S., et al. 2009, ApJ, 692, 298, 298
- York et al. (2000) York, D. G., Adelman, J., Anderson, Jr., J. E., et al. 2000, AJ, 120, 1579, 1579
- Zackrisson et al. (2011) Zackrisson, E., Rydberg, C.-E., Schaerer, D., Östlin, G., & Tuli, M. 2011, ApJ, 740, 13, 13
- Zhang & Fall (1999) Zhang, Q., & Fall, S. M. 1999, ApJL, 527, L81, L81