Pressure dependence of the charge density wave in 1T-TaS2 and its relation to superconductivity
Abstract
We present a state-of-the-art x-ray diffraction study of the charge density wave order in 1T- as a function of temperature and pressure. Our results prove that the charge density wave, which we characterize in terms of wave vector, amplitude and the coherence length, indeed exists in the superconducting region of the phase diagram. The data further imply that the ordered charge density wave structure as a whole becomes superconducting at low temperatures, i. e, superconductivity and charge density wave coexist on a macroscopic scale in real space. This result is fundamentally different from a previously proposed separation of superconducting and insulating regions in real space and, instead, provides evidence that the superconducting and the charge density wave gap exist in separate regions of reciprocal space.
It is an intriguing fact that in many complex materials superconductivity –a state of matter where charge can move through a lattice without any resistance– often exists in close proximity to what appears to be exactly the opposite: the static spatial ordering of charge. The very recently reported charge density wave (CDW) instability, which competes with superconductivity (SC) in the cuprates is only one example Ghiringhelli et al. (2012); Chang et al. (2012). Similar issues are also discussed for the newly discovered iron pnictide superconductors Zhang et al. (2009), heavy fermion systems Gegenwart et al. (2008) and the dichalcogenides Gabovich et al. (2002); Du et al. (2000). The relation between electronic order and SC therefore receives considerable attention. But despite all research efforts, the question if or under which circumstances electronic order competes, coexists or supports superconductivity remains mostly controversial.
Here we investigate the relation of CDW and SC in the layered binary material 1T-. This compound provides a well suited model system, as its underlying lattice structure is simple and the CDW order at ambient pressure has already been characterized in detail Spijkerman et al. (1997); Wilson et al. (1975). Interestingly, in 1T- a cascade of different CDW transitions occurrs: with decreasing temperature, an incommensurate (IC) CDW develops first at about 550 K, which, upon further cooling, changes into a nearly commensurate (NC) CDW at K. This phase then finally transforms into a commensurate (C) CDW below 190 K, which is commonly described as a Mott-phase due to electron-electron interactions Fazekas and Tosatti (1980, 1979). Indeed, very recent time-resolved measurements revealed ultra-fast charge dynamics in the C-CDW phase Perfetti et al. (2006); Hellmann et al. (2010); Eichberger et al. (2010); Petersen et al. (2011), lending support to the notion that electron-electron interactions are important and implying that the C-CDW is beyond conventional electron-phonon physics.
The occurrence of all these electronic phase transitions and in particular the appearance of a Mott-phase is already very interesting. But not long ago it was found that pristine 1T- also becomes superconducting below 5 K at pressures above 40 kBar Sipos et al. (2008). The rich electronic phase diagram of 1T- as a function of pressure (p) and temperature (T) is shown in Fig. 1, where we reproduce previous results along with data from this study.
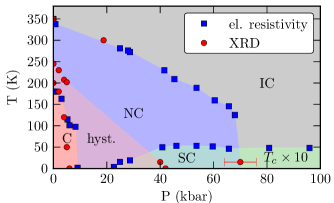
Based on detailed resistivity measurements, Sipos et. al. deduced a microscopic scenario for SC in 1T-, according to which SC develops in metallic region that separate insulating C-CDW domains and grow with increasing pressure Sipos et al. (2008). In other words, the pressure induced SC and its coexistence with CDW order was explained in terms of a microscopic phase separation in real space. It is clear, however, that macroscopic measurements cannot provide information about the microscopic spatial structure of the CDW. Since this information is essential in order to understand the coexistence of SC and CDW in 1T-, we scrutinized the CDW order by means of x-ray diffraction (XRD) experiments as a function of p and T.
The high-quality single crystals used for the present XRD study were grown by the the iodine vapor transport method as described in Ref. Zwick et al., 1998. The majority of the present XRD measurements were conducted at the beamline ID09 of the ESRF. Oriented samples of about 80 m diameter were loaded in a membrane driven diamond anvil pressure cell filled with helium as the pressure transmitting medium. For the low-temperature measurements the pressure cell was then installed in a continuous He-flow cryostat and exposed to a m2 beam with a photon energy of 30 keV. A MAR555 flat panel detector was used to collect the diffraction data in large regions of reciprocal space. At each pressure, we collected a dataset of 120 images over a sample rotation of 60∘ with 0.5∘ scan width per image. We increased the pressure up to 150 kbar and 80 kbar at constant temperatures of 300 K and 15 K, respectively, and monitored the pressure in situ using the ruby fluorescence. During the low-temperature measurements we also cooled the sample to 3.5 K at every pressure point above 40 kbar, in order to reach the superconducting phase. In addition to these measurements, the C-NC transition at lower pressures was investigated at beamline BW5 of DESY. Here we used a clamp-type pressure cell v. Zimmermann et al. (2008) and performed measurements as a function of temperature at constant pressure.
The reflections observed in XRD enable to determine the spatial arrangement of the lattice sites in a solid. In a CDW material one generally observes Bragg reflections, which are related to the underlying average structure. The CDW induces additional modulations of that structure and since the period of the CDW in real space is larger than that of the underlying lattice, additional reflections appear around the Bragg peaks. These are referred to as superlattice or satellite reflections. The position, intensity and width of the satellite reflections provides direct information about the spatial structure, the amplitude and the correlation length of the CDW.
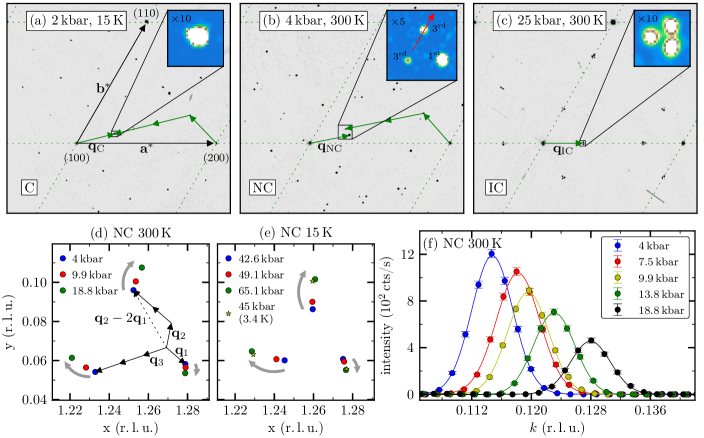
The XRD intensity was recorded as a function of the scattering vector , which is commonly given in terms of the Miller indexes : with , and the reciprocal lattice vectors of the unmodulated structure (cf. Fig. 2(a)). Since the satellite reflections in 1T- occur at different none-zero -values Spijkerman et al. (1997), we integrated the scattered intensity along the -direction, resulting in diffraction pattern that correspond to projections of the x-ray intensity within a slice of thickness onto the -plane in reciprocal space. Typical XRD datasets obtained in this way are presented in Fig. 2, where the additional satellite reflections around every Bragg peak can be clearly observed.
The diffraction pattern taken at 300 K and close to ambient pressure is shown in Fig. 2(b). Under these conditions the NC-CDW exists that is characterized by a wave vector , which deviates slightly from the commensurate wave vector . As illustrated in Fig. 2 (b), the slight incommensurability of results in two third order satellites close to the first order peak. The observation of strong higher order satellite reflections verifies that the NC-phase is characterized by a domain like structure with sharp boundaries Spijkerman et al. (1997). As can be seen in Fig. 2(a), the incommensurability and the resulting splitting of the satellite peaks vanishes in the C-CDW Mott-phase, which is reached when the sample is cooled down while keeping p close to ambient pressure (vertical path close to p=0 kbar in Fig. 1). This phase is characterized by a commensurate wave vector and is stabilized by electron-electron interactions Fazekas and Tosatti (1980); Tanda et al. (1984).
Keeping T constant at RT and increasing p, the IC-phase is reached in agreement with earlier reports (horizontal path close to T=300 K in Fig. 1). However, as shown in the inset of Fig. 2(c), the pressure-induced IC-phase differs from the one at ambient pressure in that it shows an additional splitting of the satellite reflections within the -plane. This observation is in accordance with a previous study Ravy et al. (2012), but the reason for this splitting is still unclear and subject of ongoing investigations.
The effect of increasing p at constant T on the wave vector is presented in Fig. 2(d) and (e). We determined the peak positions by fitting 2D-Gaussian profiles to the measured diffraction pattern, including up to 50 first order and 25 third order satellite reflections. This enabled us to determine the peak positions with high accuracy. As can be observed in Fig. 2(d) and (e), the position of the satellite reflections clearly changes upon increasing p, which corresponds to moving towards . For geometrical reasons the shift in position is more pronounced for the third order satellite reflections, as can be clearly seen in Fig. 2(d) and (f). The shift in position together with the behavior of the peak width and intensity is illustrated in Fig. 2(f), which shows scans along the reciprocal -direction. Not only the peak shifts according to the change of . Also the intensity of the reflection is strongly suppressed, revealing a pronounced reduction of the CDW amplitude. The analysis of the peak profiles, however, does not show any significant broadening of the peaks, i. e, no change in the coherence length of the CDW is observed.
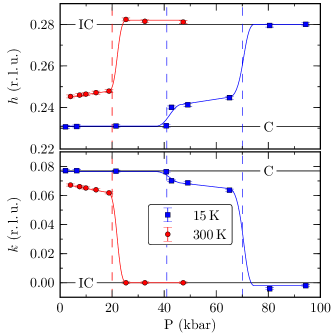
The in-plane components of the modulation wave vector determined by the fitting procedure are also summarized quantitatively for the RT and 15 K measurement in Fig. 3. Starting with the low-temperature data set, the C-NC transition is observed close to 40 kbar with increasing p. Within the NC-phase, the moves clearly towards without reaching it completely. Then at about 70 kbar a sudden jump of the modulation vector to signals a first order transition into the IC-phase (the threefold splitting is neglected and only the midpoint is shown). A corresponding behavior of the NC-IC transition is also observed at room temperature. These data agree very well with the pT-phase diagram deduced from resistivity measurements as illustrated in Fig. 1.
It is remarkable that the CDW at 15 K remains commensurate up to 40 kbar, when the pressure is increased at constant T=15 K, because the C-phase is suppressed already at 6 kbar for temperature sweeps at constant p. This was shown by resistivity measurements Tani et al. (1977); Sipos et al. (2008) and also verified by our XRD. Both experiments also showed a very large difference for the transition temperatures, depending on whether the sample is cooled or heated at constant p. These observations imply that the C-phase is metastable in a large pressure-temperature region (cf. Fig. 1).
In order to search for possible changes of the CDW order in the SC-phase, we also cooled the sample from 15 K down to K at every pressure point within the NC-phase. However, no significant change of the CDW order could be detected upon entering the SC-region of the phase diagram (cf. star marker in Fig. 2(e)). Note, that upon cooling to the lowest T, the pressure decreased as well. Yet no significant changes of the CDW order were observed, which we attribute to hysteresis effects.
We now turn to the discussion of the presented XRD results and their implications for the coexistence of SC and CDW in 1T-. As already mentioned in the introduction, the p-induced superconductivity in this compound was recently explained in terms of a phase separation scenario, which is based on the microscopic structure of the NC-phase Sipos et al. (2008). The NC-CDW at ambient p is characterized by hexagonal shaped C-CDW domains separated by domain boundaries, which are also called discommensurations Spijkerman et al. (1997); Thomson et al. (1994); Ohta et al. (1992); Wu and Lieber (1989); McMillan (1975, 1976); Nakanishi et al. (1977). The latter are commonly regarded as charged and metallic regions in-between C-CDW domains Sipos et al. (2008). However, it is important to realize that this is not a domain structure in the usual sense, because the C-CDW domains have a well-defined shape and size and, importantly, their spatial arrangement is periodically ordered. As a result, the C-CDW domains and the domain boundaries together form a regular kagome lattice with a large coherence length, yielding sharp satellite reflections in reciprocal space.
As it was shown previously Nakanishi et al. (1977), the average distance of neighboring C-CDW domains (see Fig. 4) is directly related to the incommensurability of the CDW via
| (1) |
where is given in lattice units, is the measured modulation vector and is the modulation vector of the commensurate phase. In addition to this, the sharpness of the C-domain boundaries determines the intensity ratio between first and higher order satellite reflections.
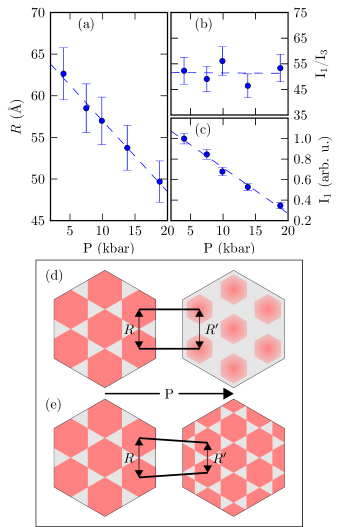
According to the scenario proposed in Ref. Sipos et al., 2008, the insulating C-CDW domains shrink with increasing pressure and, hence, the metallic domain boundaries widen and become interconnected as sketched in Fig. 4(d). At a certain pressure, the superconductivity can eventually occur at low temperature within the connected metallic regions. In this scenario, will remain essentially constant with increasing pressure. Furthermore, the widening of the domain walls corresponds to smooth boundaries between neighboring C-CDW domains, which will result in a substantial change of the intensity ratio between the first and third order satellite reflection . As can be seen in Fig. 4(a) and (b) these two characteristic changes are not observed. Instead, we find a clear reduction of and a constant ratio within the errors of the experiment. Our data therefore does not agree with the scenario illustrated in Fig. 4(d).
The constant shows that the boundaries between neighboring C-CDW domains remain sharp, while and with it the size of the C-CDW domains shrink with increasing p. Our results hence imply that the spatial structure of the CDW changes as illustrated in Fig. 4(e). Further, the data in Fig. 4(c) shows that the intensity of the satellite reflections decreases by a factor of 3, i. e., the overall amplitude of the lattice modulation decreases by with pressure.
The shrinking of the C-CDW domains and the reduction of the CDW-amplitude observed by XRD agrees with the conclusions reported previously in Ref. Sipos et al., 2008. The important new result here is that the domain boundaries in the NC-phase do not form large interconnected metallic regions. We also do not observe a dissociation of the C-CDW domains, which would result in a strong broadening and, eventually, the disappearance of the NC-superlattice reflections. Instead, the sharp XRD peaks in the NC-phase prove that the metallic regions and the C-CDW domains in this phase always form a long-ranged ordered and periodic structure.
The pressure-induced formation of large metallic regions therefore seems not to be crucial for the SC in 1T-. Rather, the behavior illustrated in Fig. 4(e) requires that the ordered structure as a whole becomes superconducting. In other words, not only the metallic regions support SC, but the whole NC-structure illustrated in Fig. 4(e) forms a coherent macroscopic superconducting state. The same conclusion was also reached for the SC-phase that is induced in 1T- by Fe-substition. From a completely different view point, namely that of angle-resolved photoemission spectroscopy, Ang et al. also found that the NC-CDW and SC must coexist in real space Ang et al. (2012). Our results for the p-induced SC together with the study of Fe-induced SC by Ang et al. provide solid experimental evidence for SC occurring in the NC-CDW structure as a whole; a situation which is fundamentally different from the previously proposed phase separation in real space. The essentially p-independent superconducting transition temperature , together with the p-induced changes of the NC-CDW observed here, further implies that NC-CDW and SC are not competing. We therefore argue that instead of a phase separation in real space there is a phase separation in k-space: NC-CDW gap and SC gap occur in separate regions of the Fermi surface.
While, according to the pT-phasediagram, the same should also be true for the IC-CDW, the Mott C-CDW clearly competes with SC. Most likely because it completely gaps the Fermi surface and hence leaves no states for the superconducting condensate. Further dedicated studies of the electronic structure as a function of pressure are however necessary to verify these conjectures. In particular, notwithstanding the obvious competition between the Mott C-CDW and SC, it remains to be clarified whether or not electron-electron interactions are relevant for the SC of 1T-. We believe that the superconducting CDW in 1T- can serve as a viable model, which will help to understand also other complex materials, sharing the same pathology.
This work was financially supported by the German Research Foundation under grant DFG-GRK1621. J.T and J.G gratefully acknowledge the financial support by the German Research Foundation through the Emmy Noether program (grant GE 1647/2-1). We thank A. Bosak for fruitful discussions.
References
- Ghiringhelli et al. (2012) G. Ghiringhelli, M. Le Tacon, M. Minola, S. Blanco-Canosa, C. Mazzoli, N. B. Brookes, G. M. De Luca, A. Frano, D. G. Hawthorn, F. He, T. Loew, M. M. Sala, D. C. Peets, M. Salluzzo, E. Schierle, R. Sutarto, G. A. Sawatzky, E. Weschke, B. Keimer, and L. Braicovich, Science 337, 821 (2012).
- Chang et al. (2012) J. Chang, E. Blackburn, A. T. Holmes, N. B. Christensen, J. Larsen, J. Mesot, R. Liang, D. A. Bonn, W. N. Hardy, A. Watenphul, M. v. Zimmermann, E. M. Forgan, and S. M. Hayden, Nat Phys 8, 871 (2012).
- Zhang et al. (2009) Y. Zhang, J. Wei, H. W. Ou, J. F. Zhao, B. Zhou, F. Chen, M. Xu, C. He, G. Wu, H. Chen, M. Arita, K. Shimada, H. Namatame, M. Taniguchi, X. H. Chen, and D. L. Feng, Phys. Rev. Lett. 102, 127003 (2009).
- Gegenwart et al. (2008) P. Gegenwart, Q. Si, and F. Steglich, Nat Phys 4, 186 (2008).
- Gabovich et al. (2002) A. M. Gabovich, A. I. Voitenko, and M. Ausloos, Phys. Rep. 367, 583 (2002).
- Du et al. (2000) C. Du, W. Lin, Y. Su, B. Tanner, P. Hatton, D. Casa, B. Keimer, J. Hill, C. Oglesby, and H. Hohl, J. Phys.: Condens. Matter 12, 5361 (2000).
- Spijkerman et al. (1997) A. Spijkerman, J. L. de Boer, A. Meetsma, G. A. Wiegers, and S. van Smaalen, Phys. Rev. B 56, 13757 (1997).
- Wilson et al. (1975) J. Wilson, F. Di Salvo, and S. Mahajan, Advances in Physics 24, 117 (1975).
- Fazekas and Tosatti (1980) P. Fazekas and E. Tosatti, Physica B+C 99, 183 (1980).
- Fazekas and Tosatti (1979) P. Fazekas and E. Tosatti, Philos. Mag. B 39, 229 (1979).
- Perfetti et al. (2006) L. Perfetti, P. A. Loukakos, M. Lisowski, U. Bovensiepen, H. Berger, S. Biermann, P. S. Cornaglia, A. Georges, and M. Wolf, Phys. Rev. Lett. 97, 067402 (2006).
- Hellmann et al. (2010) S. Hellmann, M. Beye, C. Sohrt, T. Rohwer, F. Sorgenfrei, H. Redlin, M. Kalläne, M. Marczynski-Bühlow, F. Hennies, M. Bauer, A. Föhlisch, L. Kipp, W. Wurth, and K. Rossnagel, Phys. Rev. Lett. 105, 187401 (2010).
- Eichberger et al. (2010) M. Eichberger, H. Schaefer, M. Krumova, M. Beyer, J. Demsar, H. Berger, G. Moriena, G. Sciaini, and R. D. Miller, Nature 468, 799 (2010).
- Petersen et al. (2011) J. C. Petersen, S. Kaiser, N. Dean, A. Simoncig, H. Y. Liu, A. L. Cavalieri, C. Cacho, I. C. E. Turcu, E. Springate, F. Frassetto, L. Poletto, S. S. Dhesi, H. Berger, and A. Cavalleri, Phys. Rev. Lett. 107, 177402 (2011).
- Sipos et al. (2008) B. Sipos, A. F. Kusmartseva, A. Akrap, H. Berger, L. Forro, and E. Tutis, Nat Mater 7, 960 (2008).
- Zwick et al. (1998) F. Zwick, H. Berger, I. Vobornik, G. Margaritondo, L. Forró, C. Beeli, M. Onellion, G. Panaccione, A. Taleb-Ibrahimi, and M. Grioni, Phys. Rev. Lett. 81, 1058 (1998).
- v. Zimmermann et al. (2008) M. v. Zimmermann, R. Nowak, G. D. Gu, C. Mennerich, H.-H. Klauss, and M. Hucker, Review of Scientific Instruments 79, 033906 (2008).
- Tanda et al. (1984) S. Tanda, T. Sambongi, T. Tani, and S. Tanaka, Journal of the Physical Society of Japan 53, 476 (1984).
- Ravy et al. (2012) S. Ravy, C. Laulhé, J.-P. Itié, P. Fertey, B. Corraze, S. Salmon, and L. Cario, Physica B: Condensed Matter 407, 1704 (2012).
- Tani et al. (1977) T. Tani, T. Osada, and S. Tanaka, Solid State Communications 22, 269 (1977).
- Thomson et al. (1994) R. E. Thomson, B. Burk, A. Zettl, and J. Clarke, Phys. Rev. B 49, 16899 (1994).
- Ohta et al. (1992) H. Ohta, T. Takase, Y. Komiya, H. Miyamoto, S. mishima, T. okada, and K. nomura, physica status solidi b-basic research 169, 313 (1992).
- Wu and Lieber (1989) X. L. Wu and C. M. Lieber, Science 243, 4899 (1989).
- McMillan (1975) W. L. McMillan, Phys. Rev. B 12, 1187 (1975).
- McMillan (1976) W. L. McMillan, Phys. Rev. B 14, 1496 (1976).
- Nakanishi et al. (1977) K. Nakanishi, H. Takatera, Y. Yamada, and H. Shiba, Journal of the Physical Society of Japan 43, 1509 (1977).
- Ang et al. (2012) R. Ang, Y. Tanaka, E. Ieki, K. Nakayama, T. Sato, L. J. Li, W. J. Lu, Y. P. Sun, and T. Takahashi, Phys. Rev. Lett. 109, 176403 (2012).