A redline starburst: CO(2–1) observations of an Eddington-limited galaxy reveal star formation at its most extreme
Abstract
We report observations of the CO(2–1) emission of SDSS J1506+54, a compact ( pc) starburst galaxy at . SDSS J1506+54 appears to be forming stars close to the limit allowed by stellar radiation pressure feedback models: the measured is one of the highest measured for any galaxy. With its compact optical morphology but extended low surface brightness envelope, post-starburst spectral features, high infrared luminosity (), low gas fraction (%), and short gas depletion time (tens of Myr), we speculate that this is a feedback-limited central starburst episode at the conclusion of a major merger. Taken as such, SDSS J1504+54 epitomizes the brief closing stage of a classic model of galaxy growth: we are witnessing a key component of spheroid formation during what we term a ‘redline’ starburst.
Subject headings:
galaxies: starburst, evolution1. Introduction
Theoretical studies suggest that the majority of the stellar mass in the central regions of massive spheroids forms in situ in powerful, compact starbursts (e.g. Narayanan et al. 2010). In these systems, radiative feedback from stars is expected to produce an upper limit on the star formation rate density () by limiting the density of the star-forming gas (, Thompson, Quataert & Murray 2005; Murray, Quataert & Thompson 2005). One explanation for the small range in central stellar surface densities observed in the cores of local spheroids is that they formed in compact starbursts where the bulk of the gas reservoir formed stars at the Eddington limit (Hopkins et al. 2010), however observations have only just begun to probe the most extreme – in distant powerful starbursts that are the antecedents of massive galaxies today.
Diamond-Stanic et al. (2012, DS12) reported the discovery, with the Wide-field Infrared Survey Explorer (WISE), of a population of moderate-redshift () galaxies that appear to be among the highest density starbursts yet observed. Hubble Space Telescope (HST) imaging reveals that these systems are remarkably compact in the optical bands, with 100 pc (DS12, P. H. Sell et al. 2013 in preparation), while the optical spectra and UV–IR spectral energy distributions imply high star formation rates (SFRs) approaching 103 yr-1 (and thus very high ), with little or no contribution from an active galactic nucleus (AGN). The galaxies also exhibit extremely blueshifted (1000 km s-1) Mg ii 2796, 2803 interstellar absorption lines (Tremonti et al. 2007) indicative of powerful feedback.
In order to test if these compact galaxies represent the formation of a massive stellar bulge via a feedback limited starburst, we require a measurement of the cold gas reservoir, since Eddington limited star formation places a theoretical upper limit on for the actively star-forming gas. In this Letter we present new observations at 2 mm of the most extreme galaxy in the DS12 sample with the Institut de Radioastronomie Millimétrique (IRAM) Plateau de Bure Interferometer (PdBI). We measure the CO(2–1) molecular emission line and derive the gas properties of this remarkable system to test the picture of Eddington limited star formation in a compact starburst galaxy.
2. SDSS J150636.30+540220.9
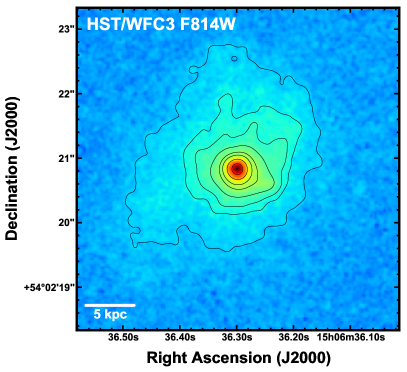
SDSS J150636.30+540220.9 at (hereafter ‘SDSS J1506+54’) was targeted because it is the most extreme system in the DS12 sample, in terms of its star formation rate density. The effective radius measured in HST WFC3 F814W (rest-frame V-band) imaging is pc (Figure 1), and even the most conservative estimates for the SFR result in densities of yr-1 kpc-2. Fitting to the WISE 12 and 22m photometry, the integrated 8–1000m luminosity of SDSS J1506+54 is estimated to be in the range –, assuming a representative range of spectral energy distributions appropriate for star-forming galaxies (Chary & Elbaz 2001, Dale & Helou 2002, Rieke et al. 2009). The dispersion in rest-frame 24m luminosity using this range of templates is just 0.1 dex. A complementary estimate of is therefore made using using the empirical correlation between – found by Rieke et al. (2008); we find , consistent with the estimate above. The SFR of SDSS J1506+54 is estimated to be in the range 340– 1400 yr-1 assuming the calibration of Kennicutt (1998), scaled to a Chabrier initial mass function. This is in good agreement with the SFR estimated from stellar population fits to the UV-optical-IR photometry (DS12).
The stellar mass is estimated from stellar population template fits to the 0.1–3m photometry, with (assuming a 0.1–100 Chabrier initial mass function, see Moustakas et al. 2013). Finally, the outflow velocity of the galactic wind is traced by the interstellar medium Mg ii 2796, 2803 absorption lines, which indicate a maximum km s-1 (Tremonti et al. 2007, DS12).
2.1. Comments on possible AGN contribution
The source does not appear to be dominated by an AGN. Although SDSS J1506+54 has the most luminous [O iii]5007 and [Ne v]3426 emission of the DS12 sample ( and ), only 4 counts were detected with Chandra in the 2–10 keV X-ray band, corresponding to a luminosity of erg s-1. Assuming typical ratios between X-ray, [O iii]5007 and [Ne v]3426 luminosities, and accounting for possible small 30% dust attenuation of the narrow-line region based on the reddening derived from our fit to the SED (DS12), the Chandra limits imply an X-ray absorption factor of 10–20 for a buried AGN (DS12, Heckman et al. 2005, Gilli et al. 2010). However, as DS12 argue, even if the X-ray attenuation factor was as high as 100, the AGN would contribute less than half of the observed 22m luminosity (Diamond-Stanic et al. 2009, Gandhi et al. 2009). Thus, star formation is likely to be the dominant power source of the bolometric emission of SDSS J1506+54.
3. IRAM Plateau de Bure 2 mm Observations
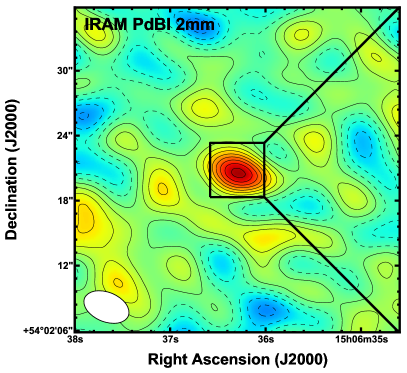
Observations were conducted with IRAM PdBI over June–July 2012 in configuration D, using 5 antennas and the WideX correlator. We targeted the CO(2–1) 230.54 GHz rotational transition at GHz (2 mm band) in the direction of SDSS J1506+5402. The total (on source) integration time was 6.2 hours (after flagging; scans on-source were discarded for which the phases deviated by more than 45 degrees from the solution), during which time the system temperature ranged between – K (– K) for precipitable water vapour in the range – mm. Bandpass calibrators were the sources 3C84, 2200+420 or 3C273, gain calibration was performed with the sources 1418+546 and J1604+572 and the source MWC349 was used for flux calibration. The flux calibration accuracy is 5–10% at 2 mm. Data were calibrated, mapped and analyzed using gildas (Guilloteau & Lucas 2000).
4. Results
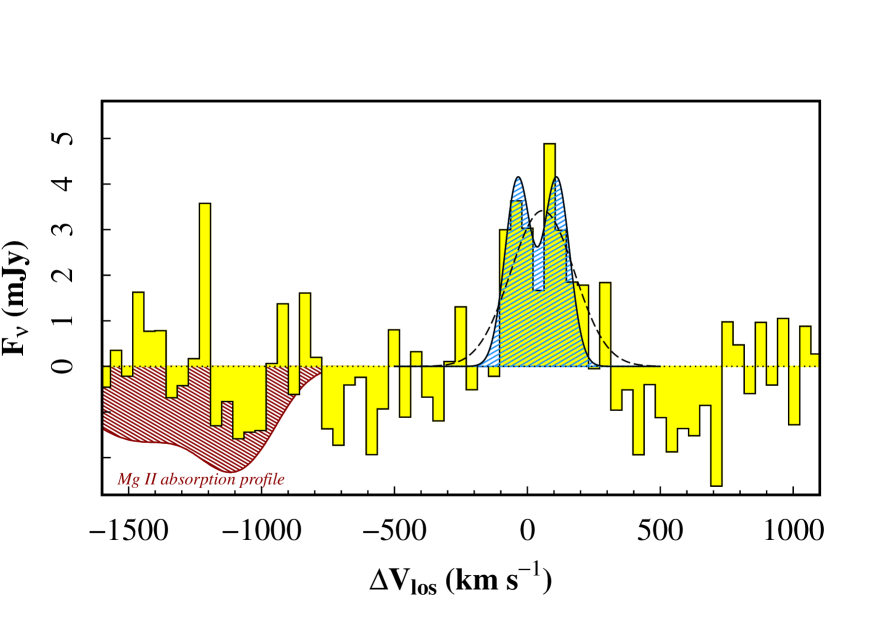
Figure 1 shows the velocity integrated CO(2-1) map of SDSS J1506+54 and Figure 2 presents the 2 mm spectrum around GHz. The CO(2–1) line is detected with high confidence at 8 in the integrated map. The integrated line flux is Jy km s-1, corresponding to a luminosity of K km s-1 pc2. Uncertainties are conservative; they are estimated via a bootstrap analysis, where we generate a series of realizations of the spectrum, adding noise to each 40 km s-1 channel, selected from a Gaussian distribution with mJy. The standard deviation of the ensemble of integrated spectra are taken to be the 1 error of the measured line flux.
The line profile is adequately fit by a single Gaussian profile (), with a velocity width km s-1 (Fig. 2). Assuming the average inclination angle , the true width could be as large as 560 km s-1. Galaxy-integrated CO spectra often exhibit double peaked line profiles, indicative of a rotating disc or ring (e.g. Downes & Solomon 1998). There are some hints of this in the current spectrum, and so we also fit a double-Gaussian profile (fixing the individual line peaks and individual dispersions to be equal). The fit is formally , not significantly improved over the single component fit. The peak-to-peak velocity is km s-1, and the line dispersion, which includes the 1-dimensional turbulent velocity dispersion of the gas, is km s-1.
At first glance, it seems puzzling that the line width is not even larger, if the mass distribution is as compact as suggested by the rest-frame UV morphology. There are two main possibilities: (i) the for the stellar mass is more widely distributed than of light measured in the F814W band (near-infrared observations at the same resolution will be required to test this) such that the environment dominated by star formation is compact (), but molecular gas dominated, or (ii) the CO-emitting gas is more widely distributed than the compact optical emission. The lack of size and orientation constraints for the CO(2–1) emission makes any estimate of uncertain, however it would be unusual if the bulk of the gas reservoir (and presumably the concomitant dust) was beyond and configured in a way that did not completely obscure the UV-bright core.
5. Interpretation and discussion
5.1. Comparison with other galaxies
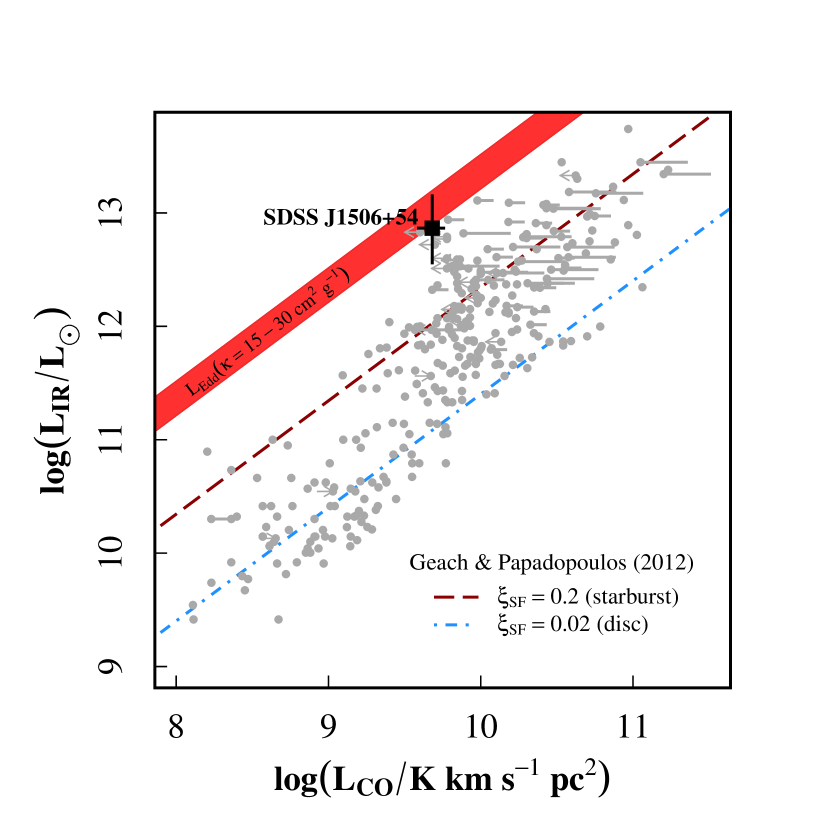
The measured is one of the highest measured for any star-forming galaxy (Fig. 3). Even if we accounted for an AGN contribution of 25% to our lowest estimate of , SDSS J1506+54 is at the extreme tail of the distribution, with in this case. There are a handful of other star-forming galaxies with similar properties; for example, the hyper-LIRG IRAS F00235+1024 (Combes et al. 2011) and the ULIRG IRAS F10398+3247 (Combes et al. 2012) both have CO line luminosities measured in the 2–1 transition, and are also at the extreme end of the distribution (Fig. 3). Several galaxies in the sample of Combes et al. (2012) have upper limits implying extreme and of these, two are obviously hosting AGN, as evident from their optical spectra.
Like SDSS J1506+54, F00235+1024 is not dominated by an AGN, although there is thought to be a non-negligible (30%) AGN contribution to its total infrared emission (Verma et al. 2002, Farrah et al. 2002). F10398+3247 could also contain a deeply buried AGN, as it has a deep silicate absorption feature (, Dartois & Muñoz-Caro 2007), often associated with nuclei blanketed by a dense screen of carbonaceous and silicate grains. The key difference between these galaxies and SDSS J1506+54 is in optical morphology: F00235+1024 and F10398+3247 are interacting systems, where multiple UV/optical clumps can be identified in HST optical and NIR imaging (Stanford et al. 2000, Farrah et al. 2002, Combes et al. 2012), thus it is unclear whether these galaxies support such extreme .
5.2. Eddington-limited star formation
How do we interpret such extreme systems? Can be driven to such high values through star formation alone? In individual galaxies, isolated star-forming cores might be Eddington limited, which is to say is capped by radiation pressure from the recently formed O and B associations (e.g. Scoville 2004, Shirley et al. 2003). However, when taken as a whole, galaxies form stars at sub-Eddington rates due to intermittency – the fact that only a small fraction of the cold gas reservoir is actually forming stars (Downes & Solomon 1998, Murray, Quataert & Thompson 2005, Andrews & Thompson 2011). Under certain conditions however, one could envision a scenario where the majority of the gas reservoir could be driven to form stars at the Eddington limit. SDSS J1506+54 is an excellent candidate for this phenomenon.
In the absence of nuclear heating, and assuming the model of momentum-driven feedback (e.g. Murray, Quataert & Thompson 2005) the upper limit of for star-forming galaxies is set by the Eddington luminosity. For optically thick dust emission ():
| (1) |
(Andrews & Thompson 2011), where here we set (see §5.3) and is the Rosseland-mean dust opacity. In Figure 3 we show the Eddington luminosity predicted for – , where is the Milky Way dust-to-gas mass ratio (see Andrews & Thompson 2011). We assume a dust-to-gas ratio of , appropriate for dusty star-forming galaxies (e.g. Kovács et al. 2006). Increasing either (as might be appropriate in highly obscured galaxies), or , or decreasing , lowers for a fixed .
Our chosen values aim to be conservative in this respect, such that no star-forming galaxies can be described as super-Eddington, but we caution the reader that in this parameter space the Eddington limit is not expected to be a hard edge. A simple framework that explains the intrinsic range in is the model of Geach & Papadopoulos (2012) that predicts the minimal dense gas mass for a given , and a range of gas mass ratios . Typically, for quiescent discs and for ULIRG-like systems (Fig. 3). The Eddington limit in equation (1) is approached as , indicating that the majority of the gas in SDSS J1506+54 is in a dense, active phase and the intermittency is close to unity.
5.3. Estimating the gas mass
Recent studies of the local (U)LIRG population where well-sampled CO and 13CO ladders are available (Papadopoulos et al. 2012a) show that, when high-J CO or heavy rotor (HCN, CS) line transitions are included in radiative transfer models, the factor increases by a factor 3–10 compared to the widely applied conversion111we omit the units of usually adopted for ULIRG-like systems (Papadopoulos et al. 2012b). The explanation is that in the supersonic turbulent discs of ULIRGs, a significant fraction of the gas mass is expected to be in a dense ( cm-3) phase (Padoan & Nordlund 2002, Papadopoulos et al. 2012, Papadopoulos & Geach 2012). This is not well traced by single low-J CO tracers, despite the fact that these were originally used to calibrate the value of in ULIRGs (Downes, Solomon & Radford 1993, Solomon et al. 1997, Downes & Solomon 1998).
Here we assume that the majority of the gas reservoir is indeed in a dense, turbulent phase. Setting and (Papadopoulos et al. 2012a, Geach & Papadopoulos 2012), we estimate . This is in agreement with the minimum dense gas mass expected if is powered by Eddington-limited star formation, since one expects a maximum (Scoville 2004, Thompson et al. 2005, Thompson 2009). The expected in feedback models is indeed close to the value actually measured both for resolved star-forming cores in spiral discs and even entire starbursts (Scoville 2004, Shirley et al. 2003). Similar values of are obtained when one considers the mass-to-light ratio of a deeply dust-enshrouded () zero-age main sequence (ZAMS) population, with (Downes & Solomon 1998). It is important to note that, regardless of the exact gas mass calibration, assuming that the majority of the infrared emission originates from enshrouded star-forming regions, the empirical scalings in Figure 3 clearly indicates that SDSS J1506+54 is close to the Eddington limit.
5.4. Hints of gas entrained in a wind
The compact starburst in SDSS J1506+54 should be effective in the launching of a powerful momentum-driven galactic wind, powered by radiation pressure on dust grains intermingled with the ISM, and the ram-pressure of supernovae detonations (Murray, Quataert & Thompson 2005). The strongly blue-shifted Mg ii lines are excellent evidence that this is the case (Tremonti et al. 2007, DS12).
The 2 mm spectrum of SDSS J1506+54 exhibits a marginally significant (3.2) narrow ( km s-1) spike close to the outflow velocity traced by Mg ii (no RFI or telluric contaminant is expected at this frequency). We can draw no conclusions on such a low-significance feature, but we remark that if cold gas has become swept-up in the outflow traced by Mg ii absorption, and have survived shock-heating, then we might expect to detect entrained cold gas in this way.
6. SDSS J1506+54 as an Eddington-limited starburst induced in a late-stage merger
6.1. Formation
We speculate that SDSS J1506+54 is the remnant of a major merger. In this picture angular momentum losses caused by the dissipation of energy in shocks and gravitational torques cause the collapse of disc-gas to the central regions in each parent, and subsequently into a single merged core. This is a classic picture of galaxy growth that has been supported for many years by both theory, numerical simulations and observation (Toomre & Toomre 1972, Sanders et al. 1988, Hernquist 1989, Barnes & Hernquist 1991, Sanders & Mirabel 1996, Schweizer et al. 1996, Mihos & Hernquist 1996, Wuyts et al. 2010, Hopkins et al. 2012).
Tidal interactions in earlier stages of the merger might well be responsible for the faint extended (over several kpc) optical light (Figure 1, P. H. Sell et al. in prep). Episodes of massive star formation must have occurred in the recent past (0.5–1 Gyr), with the A stars formed in (or moved to) relatively unobscured regions, in order to produce strong H absorption observed in the optical spectrum. Indeed, the presence of post-starburst spectral features is entirely consistent with the typical timescales for equal-mass mergers (Lotz et al. 2008).
6.2. Fate
In the absence of additional cooling of gas, SDSS J1506+54 must be close to the cessation of star formation. At the current rate the gas will be consumed within a few tens of Myr, increasing the stellar mass by just 15%. This will place the galaxy in the exponential tail of the stellar mass function at (Moustakas et al. 2013), but the current starburst contributes only a modest fraction of the total mass. Nevertheless, this small addition can have important consequences for the properties of the descendant (Robaina et al. 2009, Hopkins et al. 2010, 2012, Hopkins & Hernquist 2010).
Signatures of compact Eddington-limited starburst episodes could be found in the ‘fossil record’ of local spheroids. Integral field observations of the cores of local elliptical galaxies reveal examples of compact (100 pc), ‘kinematically decoupled’, relatively young ( 5 Gyr) stellar components in a subset of the population (e.g. McDermid et al. 2006). The origin of these structures could well be found in powerful, compact starbursts such as the one we present. Star formation driven at extremely high could also have a critical impact on the form of the stellar initial mass function, due to the corresponding high cosmic ray densities in such environments (Papadopoulos et al. 2011).
7. Summary
We have presented observational evidence of what we term a ‘redline’ starburst: a galaxy forming stars close to the Eddington limit assuming current models of stellar feedback. The measured is one of the highest measured for any galaxy. Our conclusion is that the SDSS J1504+54 system is a final stage merger, undergoing a high intensity circumnuclear starburst. If we are witnessing the intense – but fleeting – closing stages of the assembly of a massive stellar bulge, SDSS J1506+54 represents a unique opportunity to study the physics associated with this important evolutionary phase, and the mechanics of star formation at its most extreme.
Acknowledgements
We thank the anonymous referee for a constructive report that improved this paper. We are also grateful to Brett Andrews, Padelis Papadopoulos, Nathan Bastian and Aday Robaina for helpful discussions and advice. J.E.G. is supported by a Banting Fellowship. A.M.D. acknowledges support from the Southern California Center for Galaxy Evolution. P.H.S. acknowledges support through the NASA grant HST-GO-12019. This work was also supported by Chandra grant #tGO0-11135.
References
- Author et al. (2012) Andrews B. H., & Thompson T. A. 2011, ApJ, 727, 97
- Author et al. (2012) Barnes, J. E., Hernquist, L., 1991, ApJ, 370 L65
- Author et al. (2012) Chary, R., Elbaz, D., 2001, ApJ, 556, 562
- Author et al. (2012) Combes, F., García-Burillo, S., Braine, J., Schinnerer, E., Walter, F., Colina, L., 2011, A&A, 528, 124
- Author et al. (2012) Combes, F., Garcia-Burillo, S., Braine, J., Schinnerer, E., Walter, F., Colina, L., 2012, A&A, arXiv:1209.3665
- Author et al. (2012) Dartois, E., Muñoz-Caro, G. M., 2007, A&A, 476, 1235
- Author et al. (2012) Dale, D. & Helou, G. 2002, ApJ, 576, 159
- Author et al. (2012) Diamond-Stanic, A. M., Rieke, G. H., Rigby, J. R., 2009, ApJ, 698, 623
- Author et al. (2012) Diamond-Stanic, A. M., Moustakas, J., Tremonti, C. A., Coil, A. L., Hickox, R. C., Robaina, A. R., Rudnick, G. H., Sell, P. H., 2012, ApJ, 755, L26
- Author et al. (2012) Downes D., & Solomon P. M. 1998, ApJ, 507, 615
- Author et al. (2012) Farrah, D., Verma, A., Oliver, S., Rowan-Robinson, M., McMahon, R., 2002, MNRAS, 329, 605
- Author et al. (2012) Gandhi, P., Horst, H., Smette, A., Hönig, S., Comastri, A., Gilli, R., Vignali, C., Duschl, W., 2009, A&A, 502, 457
- Author et al. (2012) Geach, J. E., Papadopoulos, P. P., 2012, ApJ, 757, 156
- Author et al. (2012) Gilli, R., Vignali, C., Mignoli, M., Iwasawa, K., Comastri, A., Zamorani, G., 2010, A&A, 519, 92
- Author et al. (2012) Guilloteau, S., Lucas, R., 2000, Imaging at Radio through Submillimeter Wavelengths, ASP Conference Proceedings, Vol. 217, edited by J. G. Mangum and S. J. E. Radford. Astronomical Society of the Pacific, p.299
- Author et al. (2012) Heckman, T. M., Ptak, A., Hornschemeier, A., Kauffmann, G., 2005, ApJ, 634, 161
- Author et al. (2012) Hernquist, L, 1989, Nature, 340, 687
- Author et al. (2012) Hopkins, P. F., Murray, N., Quataert, E., Thompson, T. A., 2010, MNRAS, 401, L19
- Author et al. (2012) Hopkins, P. F., Hernquist, L., 2010, MNRAS, 402, 985
- Author et al. (2012) Hopkins, P. F., Cox, T. J., Hernquist, L., Narayanan, D., Hayward, C. C., Murray, N., 2012, arXiv:1206.0011
- Author et al. (2012) Irwin, M. J., Ibata, R. A., Lewis, G. F., Totten, E. J., 1998, ApJ, 505, 529
- Author et al. (2012) Kennicutt, R. C. Jr., 1998, ARA&A, 36, 189
- Author et al. (2012) Kovács, A., Chapman, S. C., Dowell, C. D., Blain, A. W., Ivison, R. J., Smail, I., Phillips, T. G., 2006, ApJ, 650, 592
- Author et al. (2012) Lotz, J. M., Jonsson, P., Cox, T. J., Primack, J. R., 2008, MNRAS, 391, 1137
- Author et al. (2012) McDermid, R. M., et al., 2006 MNRAS, 373, 906
- Author et al. (2012) Mihos, J. C., Hernquist, L., 1996, ApJ, 464, 641
- Author et al. (2012) Murray, N., Quataert, E., Thompson, T. A., 2005, ApJ, 618, 569
- Author et al. (2012) Moustakas, J., et al., 2013, arXiv:1301.1688
- Author et al. (2012) Narayanan, D., Hayward, C. C., Cox, T. J., Hernquist, L., Jonsson, P., Younger, J. D., Groves, B., 2010, MNRAS, 401, 1613
- Author et al. (2012) Padoan P. & Nordlund 2002, ApJ, 576, 870
- Author et al. (2012) Papadopoulos, P. P., Thi, W.-F., Miniati, F., Viti, S., 2011, MNRAS, 414, 1705
- Author et al. (2012) Papadopoulos, P. P., van der Werf, P. P., Xilouris, E. M., Isaak, K. G., Gao, Y., Mühle, S., 2012, MNRAS, 426, 2601
- Author et al. (2012) Papadopoulos, P. P., van der Werf, P., Xilouris, E., Isaak, K. G., Gao, Y., 2012, ApJ, 751, 10
- Author et al. (2012) Papadopoulos, P. P., Geach, J. E., 2012, ApJ, 757, 157
- Author et al. (2012) Rieke, G. H., Alonso-Herrero, A., Weiner, B. J., Pérez-González, P. G., Blaylock, M., Donley, J. L., Marcillac, D., 2009, ApJ, 692, 556
- Author et al. (2012) Robaina, A. R., et al., 2009, ApJ, 704, 324
- Author et al. (2012) Sanders, D. B., Soifer, B. T., Scoville, N. Z., 1988, Science, 239, 625
- Author et al. (2012) Sanders, D. B., Mirabel, I. F., 1996, ARA&A, 34, 749
- Author et al. (2012) Schweizer, F., 1996, AJ, 111, 109
- Author et al. (2012) Scoville N. Z. 2004, The Neutral ISM in Starburst Galaxies, Astronomical Society of the Pacific Conference Series, 320, p.253
- Author et al. (2012) Shirley, Y. L., Evans, N. J., II, Young, K. E., Knez, C., Jaffe, D. T., 2003, ApJS, 149, 375
- Author et al. (2012) Solomon P. M., Downes D., Radford S. J. E., & Barrett J. W. 1997, ApJ, 478, 144
- Author et al. (2012) Solomon P. M., Vanden Bout, P. A. 2005, ARA&A, 43, 677
- Author et al. (2012) Stanford, S. A., Stern, D., van Breugel, W., De Breuck, C., 2000, ApJS, 131, 185
- Author et al. (2012) Thompson T. A., Quataert E., & Murray N. 2005, ApJ, 630, 167
- Author et al. (2012) Thompson T. A. 2009, The Starburst-AGN connection, Astronomical Society of the Pacific Conference Series, 408, p.128
- Author et al. (2012) Toomre, A., Toomre, J., 1972, ApJ, 178, 623
- Author et al. (2012) Tremonti, C. A., Moustakas, J., Diamond-Stanic, A. M., 2007, ApJ, 663, L77
- Author et al. (2012) Verma, A., Rowan-Robinson, M., McMahon, R., Efstathiou, A., 2002, MNRAS, 335, 574
- Author et al. (2012) Wuyts, S., Cox, T. J., Hayward, C. C., Franx, M., Hernquist, L., Hopkins, P. F., Jonsson, P., van Dokkum, P. G., 2010, ApJ, 722, 1666