The Connection between Star Formation and Metallicity Evolution in Barred Spiral Galaxies
Abstract
We have performed a series of chemodynamical simulations of barred disc galaxies. Our goal is to determine the physical processes responsible for the increase in the central gas-phase metallicity and of the central star formation rate (SFR) observed in the Sloan Digital Sky Survey (SDSS). All simulations start with an axisymmetric distribution of stars and gas, embedded into a spherical dark matter halo. We define a diameter central aperture to approximate the integrated spectroscopic fibre measurements from the SDSS. The chemical evolution observed within this central region depends critically upon the relative size of the bar and the aperture, which evolves strongly with time. At , a strong bar forms via a disk instability, whose length is considerably longer than the aperture. The stars and gas lose angular momentum and follow elongated orbits that cause an intense mixing of the gas between the central region and its surroundings. During the next , the orbits of the stars inside the bar do not evolve much, but the orbits of the gas contract significantly until the entire gas bar is contained in the aperture, resulting in a net flux of gas into the central region. During this period, the metallicity in the central region increases steadily, and this enrichment is dominated by metal-rich gas that is flowing into the central region. The main result of this work is therefore that the observed enrichment in the centres of barred galaxies is not dominated by in-situ enrichment by stars formed in the centre. Rather, star formation occurs along the full length of the bar, much of which occurs initially outside the aperture. About 50% of the metals that end up in the central region originate from this extended bar-long star formation, but flow into the central region due to loss of angular momentum. The effect is less significant for iron because the delay for the onset of Type-Ia SNe leaves less time for mixing. Still, there is a significant increase in [Fe/H] before the central stars contribute to in-situ enrichment. Eventually, as the orbits of the gas inside the bar contract, they fall completely inside the central region, and only then the central region can be regarded as a closed-box system. However, by that time, most of the metal-enrichment in the central region has already taken place. We conclude that there is no direct connection between central SFR and central metallicity. The central metallicity does not originate exclusively from central stars. Instead, the global SFR (especially along the bar) and the large-scale flow of enriched gas play a major role.
keywords:
galaxies: evolution — galaxies: spirals — ISM: abundances — stars: formation1 Introduction
1.1 Evolution of Barred Galaxies
Bars are a very common feature in spiral galaxies. Observational determinations of the bar fraction in nearby galaxies, and up to redshift , systematically produce values in the range 20% to more than 60% (Eskridge et al., 2000; Elmegreen et al., 2004; Jogee at al., 2004; Nair & Abraham, 2010; Martínez & Muriel, 2011; Giordano et al., 2011; Masters et al., 2011; Lee et al., 2012a). The formation of these bars can be triggered by mergers or tidal interactions with other galaxies (Noguchi, 1987), or can happen in isolated galaxies as a result of dynamical instability (Sellwood, 1981). Analytical studies and numerical simulations have shown that the presence of a bar can greatly affect the evolution of the host galaxy. Analytical calculations (Lynden-Bell, 1979; Athanassoula, 2003) showed that the bar produces a gravitational torque that transports angular momentum outward and matter inward. This was confirmed by the early simulations of Roberts et al. (1979), Sellwood (1981), and van Albada & Roberts (1981). In the more recent simulations of Pfenniger & Friedli (1991), Friedli & Benz (1993, 1995) and Friedli et al. (1994), a bar forms by dynamical instability. That bar channels gas into the center of the galaxy, resulting in a flattening of the initial metallicity gradient. Eventually, the gas flow causes a central starburst, and the resulting metal enrichment steepens the metallicity gradients in the central regions. Several authors studied the dynamics of the gas flowing along the bar (Combes & Gerin, 1985; Athanassoula, 1992b; Combes & Elmegreen, 1993; Fux, 1999; Maciejewski et al., 2002; Regan & Teuben, 2004; Baba et al., 2010). Their simulations showed that the gas retains some angular momentum, preventing it from falling directly into the center of the galaxy. Instead, the gas tends to form elongated orbits inside the stellar bar. This result is in agreement with analytical studies of the properties of orbits in axisymmetric potentials (Athanassoula, 1992a). If gas does fall into the center of the galaxy, it might accrete onto a central black hole and fuel a central AGN (Shlosman et al., 1989; Shlosman & Noguchi, 1993; Heller & Shlosman, 1994; Combes, 2003; Jogee, 2006). Or, it might lead to the formation of a central bulge (Kormendy & Kennicutt, 2004).
All these analytical studies and numerical simulations provide a basic scenario for the evolution of barred galaxies. Once the stellar bar forms, gas starts flowing along the bar, into the central regions. This inflow of metal-poor gas tends to flatten the metallicity gradient. The star formation rate in the central regions increases, either steadily or in the form of a starburst. This will lead eventually to an increase in central metallicity. Finally, the gas that is not converted to stars might end up fueling a central AGN. We would therefore expect barred galaxies to have higher central SFR, higher central metallicities, higher bulge fraction, and more intense AGN activity than unbarred galaxies, and possibly a flatter metallicity gradient, depending at what stage of their evolution they are being observed. This basic scenario is indeed supported by many observations. Some barred galaxies have shallower metallicity gradients than unbarred ones (Pagel et al., 1979; Martin & Roy, 1994), suggesting gas flow along the bar. Several observations reveal enhanced star formation in the central regions of barred galaxies (Heckman, 1980; Hawarden et al., 1986; Devereux, 1987; Arsenault, 1989; Huang et al., 1996; Ho et al., 1997; Martinet & Friedli, 1997; Hunt & Malkan, 1999; Emsellem et al., 2001; Knapen et al., 2002; Laurikainen et al., 2004; Jogee et al., 2005; Hunt et al., 2008; Bang & Ann, 2009). Also, Masters et al. (2012) found an anti-correlation between the presence of a bar and atomic gas content, which could be interpreted as a depletion of gas in barred galaxies, possibly resulting from enhanced star formation. Masters et al. (2011) found that over half of red, bulge-dominated disc galaxies possess a bar, while blue galaxies show no evidence for a bar or a bulge. The issue of AGN fueling is less clear. Several observational studies find either a larger bar fraction in AGN-host galaxies than non-AGN ones (Arsenault, 1989; Knapen et al., 2000; Laine et al., 2002) or a larger AGN fraction in barred galaxies than unbarred ones (Coelho & Gadotti, 2011), other studies do not find any significant difference (Moles et al., 1995; McLoed & Rieke, 1995; Mulchaey & Regan, 1997; Ho et al., 1997; Laurikainen et al., 2004; Hao et al., 2009; Bang & Ann, 2009; Lee et al., 2012b).
1.2 Recent Observations
While many observations support the basic scenario of bar evolution described above, several recent studies of barred galaxies using large samples reveal a more complex picture. A study of 294 galaxies with strong bars from the Sloan Digital Sky Survey (SDSS) by Ellison et al. (2011) showed that barred galaxies of stellar masses have enhanced central SFR and metallicities, which puts them as outliers on the fundamental metallicity relation (Ellison et al., 2008; Mannucci et al., 2010; Lara-López et al., 2010a, b). Galaxies with stellar masses also show an increase in central metallicity, but without a corresponding increase in central SFR. One possible explanation is that star formation in the center of low-mass barred galaxies, which is presumably responsible for the observed higher metallicities, has now ceased, while stars are still forming in the center of high-mass galaxies.
More recently, Wang et al. (2012) performed a detailed study of a sample of 3757 galaxies from SDSS, including 1555 barred galaxies. They found that the presence of a bar does not automatically imply higher SFR. Galaxies with weak bars (ellipticities ) do not show enhanced central star formation, only galaxies with strong bars do. These strong bars are found predominantly in galaxies with high stellar masses, (Nair & Abraham, 2010; Ellison et al., 2011; Wang et al., 2012). This implies a relation between mass and SFR, which could explain the results of Ellison et al. (2011). But interestingly, while only galaxies with strong bars in the Wang et al. (2012) sample have enhanced central SFR, not all of them do. Instead, some of these galaxies have a central SFR that is lower than the mean by a factor of 10. This suggests that bars (or some other process associated with their presence) might, under some circumstances, quench star formation in the central regions.
Oh et al. (2012) studied the effect of bars on central star formation and AGN activity, using a sample of 6658 late-type galaxies from SDSS, including 2442 galaxies with bars. They find that the presence of a bar significantly increases the central SFR in red galaxies, but not in blue ones, where the central SFR is large whether or not a bar is present. This could result from the fact that redder galaxies tend to have longer bars, which according to simulations leads to larger effects. Or, as the authors suggest, central star formation is naturally reduced in redder galaxies because less gas is available, making the effect of infalling gas more important than in bluer galaxies. While bar effects on the central SFR are important for red galaxies but not blue ones, the opposite is true for AGN activity. Bar effects on AGNs are mostly found in blue galaxies, even though most AGNs are hosted by red galaxies. The authors suggest that the presence of a large central mass concentration can weaken the bar, reducing its effects. Another possibility is that red galaxies hosting AGNs are in the post-starburst phase. Then most of the gas has already been consumed by star formation, leaving no gas to feed the AGN (Sheth et al., 2005).
These recent studies reveal that the evolution of barred galaxies is probably more complex than the basic scenario suggests. Galaxies of different masses, or with bars of different strength, can have drastically different star formation histories. As a result, there is no simple correlation between the presence of bars, enhanced central SFR, and enhanced central metallicity. To fully understand the evolution of these galaxies, we need to understand the interplay between the gravitational dynamics responsible for the formation of the bar and the large-scale gas flows in the galaxy, the hydrodynamics responsible for the formation of stars and the chemical enrichment of the ISM, the feedback processes resulting from stellar evolution and AGN activity, and their possible role in dispersing chemical elements in the galaxy, regulating star formation, and possibly quenching it.
1.3 Objectives
To address this complex problem, we first focus, in this paper, on the connection between enhanced central star formation and enhanced central metallicity (Ellison et al., 2011). This is a first step toward understanding the evolution of barred galaxies and building a scenario which is consistent with all recent observations. Previous hydrodynamical simulations of barred galaxies showed that gas flow along the bar usually results in increased star formation and increased metallicity in the central regions (Pfenniger & Friedli, 1991; Friedli & Benz, 1993, 1995; Friedli et al., 1994), but that does not imply that one is the cause, or partial cause, of the other. Metals that end up in the central regions might have been produced elsewhere in the galaxy, while metals produced in the central regions might eventually leave that region. These specific questions were not addressed in previous simulations.
We have performed a series of chemodynamical simulations of isolated barred galaxies. We focus on the evolution of the metal abundance in the central region. We define this central region as the central , because it roughly matches the size of the fibre region in the SDSS. From now on, we will use the term “central,” to refers to the aperture, except in section 3.6 where we consider different aperture sizes. We identify all physical processes responsible for modifying the abundance of individual chemical elements in the central region, and we determine the relative importance of these various processes. Our objective is to determine if enhanced central star formation is the primary cause for the enhanced central metallicity, or if the latter has a different origin. This is an essential first step in assessing the validity or shortcomings of the basic scenario.
The remainder of this paper is organized as follows: In §2, we describe the numerical algorithm used for this study. Results are presented in §3, where we first discuss the global evolution of the galaxy, and then focus on the central region. The implications of the results are discussed in §4. Summary and conclusions are presented in §5.
2 THE SIMULATIONS
2.1 The Numerical Algorithm
We used the chemodynamical numerical algorithm GCD+ (Kawata & Gibson, 2003; Rahimi & Kawata, 2012; Kawata et al., 2013). GCD+ is a three-dimensional tree N-body/SPH code that incorporates self-gravity, hydrodynamics, radiative cooling, star formation, supernova feedback, metal enrichment, and metal diffusion. Gas is converted into stars in regions where the number density exceeds a certain threshold and where the velocity field is convergent, following the Schmidt law described in Kawata & Gibson (2003):
| (1) |
where and are the gas and stellar mass density, respectively, is a dimensionless SFR efficiency, and is the dynamical time.
We assume that the the stellar masses are distributed according to the Salpeter (1955) initial mass function (IMF). Chemical enrichment by both Type II (Woosley & Weaver, 1995) and Type Ia supernovae (Iwamoto et al., 1999) and mass loss from intermediate-mass stars (van den Hoek & Groenewegen, 1997) are taken into account. We adopt the Type Ia supernovae rate suggested by Kobayashi et al. (2000). We assume that each supernova produces an amount of thermal energy , and that stellar winds from massive stars () also produce thermal energy, at a rate . The canonical energy of a supernova is . However, according to the high-resolution one-dimensional simulations of Thornton et al. (1998), 90% of the initial supernova energy is lost in radiation in its early expansion phase, and does not contribute to feedback. Accordingly, we set per supernova for our fiducial model. Notice that an initial supernova energy has not been established quantitatively yet. For this reason, we also explore the effect of a higher supernova energy, , in one of our simulations. We set for our fiducial model, but also consider the effect of a stronger stellar wind with , to cover the range suggested by several authors (Weaver et al., 1977; Shull, 1980; Gibson, 1994; Oey & Massey, 1994). The metal diffusion is modeled with the method described in Greif et al. (2009). We use a star formation density threshold, and a star formation efficiency, .
2.2 Initial Conditions
The technique used for generating initial conditions is described in detail in Grand et al. (2012). We use particles to represent the stellar and gaseous components of the galaxy. The stellar and gas discs are set up using the method described in Springel et al. (2005). The stellar disc follows an exponential surface density profile:
| (2) |
| Disc | [] | [kpc] | [kpc] |
|---|---|---|---|
| stars | 2.50 | 0.35 | |
| gas | 4.00 |
where , , , and , are the radial coordinate (distance from the -axis), vertical coordinate, disc mass, scale length, and scale height, respectively. The gaseous disc has a same radial dependence as the stellar disc, but with a different scale length , and its initial vertical distribution is not given by a profile. Instead, it is adjusted by imposing that the gas is initially in hydrostatic equilibrium. The values of the parameters are given in Table 1. These parameters were chosen in order to produce a galaxy similar to the Milky Way (Olling & Merrifield, 2001; Robin et al., 2003; McMillan, 2011). In this first study, we did not include gas-infall from the surrounding intergalactic medium, in order to focus on the effect of gas accretion in the disc.
We impose initial radial abundance profiles to both stellar and gaseous components. The iron abundance profiles for the stars and gas are given by
| (3) |
The -element abundances are given by
| (4) |
At each radius, we add to the values given by equations (3) and (4) a gaussian scatter with a dispersion of . For the star particles, we use the value of [Fe/H] to randomly assing them an age, following the age-metallicity relation with a 0.02 dex scatter, and assuming a constant SFR in the age range.
We do not use particles to represent the dark matter halo. Instead, we impose a fixed, non-evolving spherical gravitational potential, in order to focus on the baryon dynamics and save computational time The dark matter halo density follows a truncated NFW profile,
| (5) |
(Navarro et al., 1997; Rodionov et al., 2009) where is the distance from the center. The scale length is given by , where is the concentration parameter, and is the virial radius, inside which the mean density of the dark matter is equal to 200 times the the critical . The characteristic density is adjusted such that the mass of the dark matter inside the virial radius is equal to . The truncation factor is introduced in our initial condition generator for a live halo simulation. Although we use a static dark matter halo in this paper, we still use the profile given by equation (5). Note that adding this truncation factor to the standard NFW profile leads to very little change in the central region, which we focus on in this paper.
2.3 Runs and Parameters
| Run | [] | [] | |||
|---|---|---|---|---|---|
| F | 120,000 | 30,000 | 10 | ||
| HR | 360,000 | 90,000 | 10 | ||
| NoBar | 120,000 | 30,000 | 20 | ||
| Feed | 120,000 | 30,000 | 10 |
We performed a total of 4 simulations. The parameters of the simulations are listed in Table 2. We first performed a fiducial run, or Run F, with a medium resolution (120,000 star particles and 30,000 gas particles), concentration parameter , supernova energy input per supernova, and stellar wind energy input . We then performed a series of simulations which all differ from the fiducial run in one particular aspect: Run HR is a high-resolution run, with three times more particles. In Run NoBar, we increased the concentration parameter of the dark matter halo, to prevent the formation of a bar. In Run Feed, we increased amount of stellar wind and SNe feedback by a factor of 10. All simulations end at .
3 RESULTS
3.1 Global Properties
3.1.1 The Formation and Evolution of the Bar and Spiral Pattern
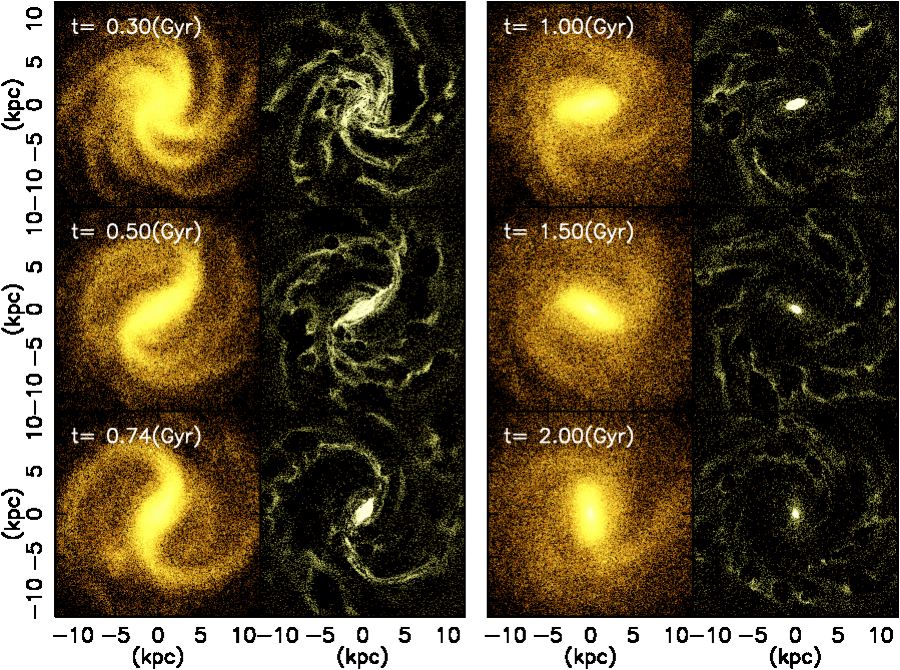
Figure 1 shows the distribution of stars and gas particles at six different times, for Run F. At , we see a spiral pattern with multiple spiral arms, and a central bar is starting to form. At , the central bar is fully developed, and the spiral pattern is reduced to two main spiral arms. The stellar and gaseous components of the bar have a comparable length at that time. By , the bar is still present, but the spiral pattern starts to disappear due to the dynamical heating by the bar and spiral arms themselves (Carlberg & Sellwood, 1985). At , the spiral pattern is hardly visible in the stellar component, while in the gas component we see several weak spiral arms. At the end of the simulation, the spiral pattern is gone but there is still a strong bar in the stellar component. Between and the end of the simulation, the length and shape of the stellar bar remain essentially unchanged, while the gaseous component of the bar steadily contracts. At , the stellar and gaseous components of the bar are and long, respectively.
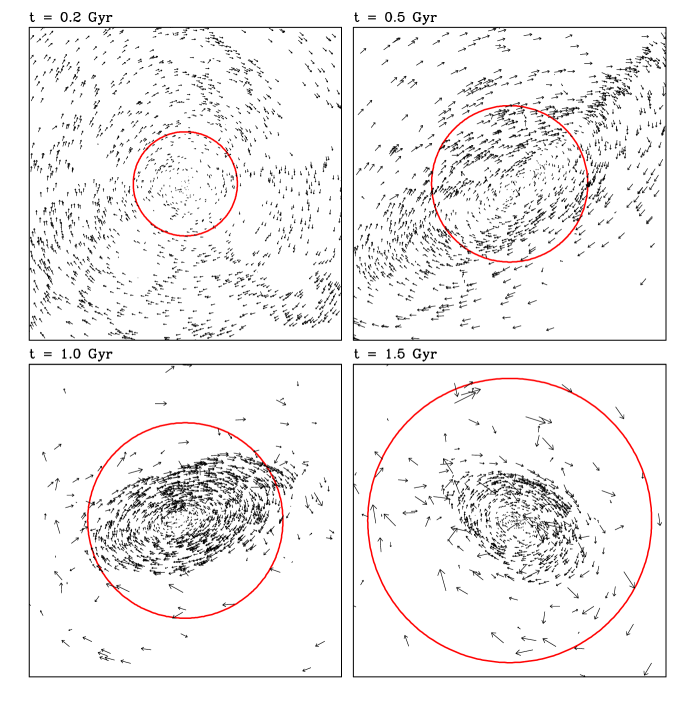
We plot in Figure 2 the velocity field of the gas in the central region. On each panel, the red circle has a diameter of , and shows the central region. At , the gas inside the bar moves along an elongated, elliptical orbit. This is consistent with the simulations of Regan & Teuben (2004). This orbit intersects the edge of the aperture, hence the gas is flowing across the boundary, both moving in and moving out of the simulated fibre. This elongated vortex contracts with time (see Fig. 1). At , the gas bar is barely contained within the aperture, and at , it is entirely contained inside the central region.
3.1.2 Star Formation and Chemical Evolution of the Galaxy

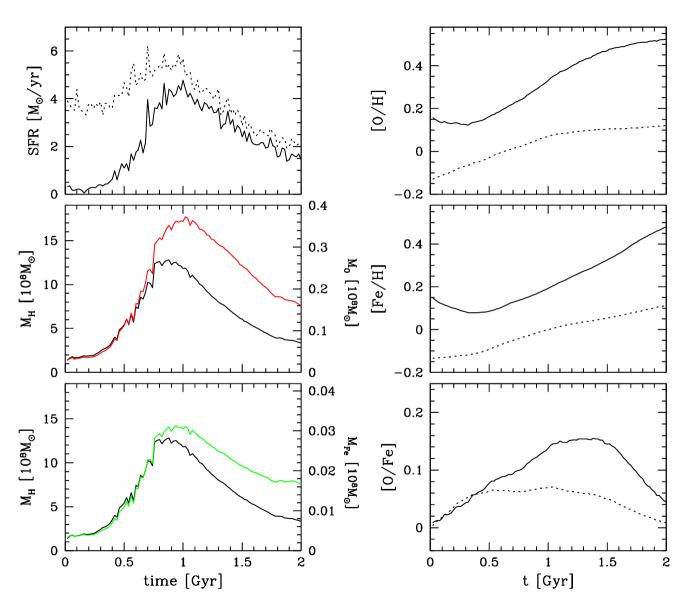
Figure 3 shows the time-evolution of global properties of the galaxy. The top left panel shows the SFR. The total galactic SFR is initially constant at around . Then, at , the bar forms and starts chanelling gas in the central region, resulting in additional star formation. The SFR keeps increasing, reaching at , and then starts decreasing. The decrease in SFR after is not due to bar disruption, since the bar remains strong until the end of the simulation. It is simply due to gas exhaustion: star formation reduces the amount of gas available, and this gas is not replenished since we do not include gas infall from the intergalactic medium in our simulations. The bottom left panel shows the total hydrogen mass in the gas phase111Unless specified otherwise, elemental masses, abundances, and abundances ratios always refer to the elements present in the gas phase, not the stellar phase. Also, we do not distinguish between molecular, atomic, and ion species. Hence, refers to the total mass in the form of , , and .. It decreases almost linearly, with a slight change of slope at . By the end of the simulations, it is down by 50%, and correspondingly, the SFR is also down by about 50%
The right panels show the evolution of [O/H] and [Fe/H]. The evolution of [O/H] is closely related to the evolution of the SFR. The oxygen abundance rapidly increases during the period of high star formation, with [O/H] increasing by during the first . Then, as the SFR starts to decrease, there is a significant change of slope, and [O/H] only increases by during the last of the simulation. The iron abundance increases more steadily, and at the end of the simulation [Fe/H] is increasing faster than [O/H]. This is caused by the different lifetimes of Type II and Type Ia SNe progenitors. Type II SNe have short progenitor lifetimes, between 5 and 10 million years. Since these SNe are the main producer of oxygen, we expect to see a tight correlation between the histories of star formation and oxygen enrichment. Iron is produced mostly by Type Ia SNe, which have long progenitor lifetimes, typically between 1 and . As a result, a significant fraction of iron is produced long after the SFR has reached its peak. These results are consistent with the early results of Kawata & Gibson (2003) (see their Fig. 2).
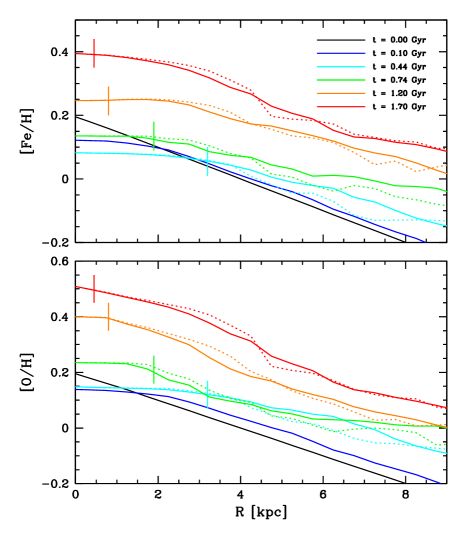
Figure 4 shows the evolution of the radial profiles of [O/H] and [Fe/H], where is the distance measured from the rotation axis of the galaxy. We calculated these profiles first by averaging over all angles, and then by only considering the gas located in a cylinder of radius centered on the bar (solid and dotted lines, respectively). The black lines show the linear gradient present in the initial conditions. Once the bar forms, the flow of gas along the bar tends to flatten the abundance gradient. In particular, [O/H] and [Fe/H] in the central region initially go down, as metal-poor gas is channeled into the central region by the bar. The same phenomenon was seen in the simulations of Friedli & Benz (1993), Friedli et al. (1994), and Friedli & Benz (1995). This is partly compensated by metals produced by Type II SNe. Since these SNe produce more oxygen than iron, we see a larger drop in the central [Fe/H]. The SFR increases with time, resulting in more SNe, and eventually the oxygen and iron abundances increase with time at all radii. The profiles tend to be flatter in the center when we consider only the gas located along the direction of the bar. The length of the plateaux seen at small radii in Figure 4 roughly correspond to the extent of the gaseous component of the bar, which is indicate by the vertical lines (see also Fig. 9 below. Note that at , the bar has not formed yet). Gas flow and strong mixing of gas inside the bar tends to erase any significant abundance gradient. The plateaux get shorter with time simply because the gaseous component of the bar contracts.
3.2 Inside the Central Region
We define the central region as a cylinder of radius , parallel to the rotation axis of the galaxy, but centered on the center of mass of the stellar component. We chose this particular size because it corresponds to the typical fibre values sampled by the SDSS.
3.2.1 Star Formation and Metal Abundances
Figure 5 shows the evolution of the SFR, hydrogen, oxygen, and iron mass, and [O/H], [Fe/H], and [O/Fe] inside the central region. The dotted lines show the global evolution, copied from Figure 3. The chemical evolution of the central region differs significantly from the global evolution of the whole galaxy. Initially, the amount of hydrogen in the central region is small, and correspondingly the SFR is also small. As the bar starts channeling gas toward the center, both and the SFR increase, especially after , when the bar is the strongest. At , the gaseous component of the bar has contracted sufficiently to be entirely contained in the central region. The inflow of hydrogen stops, and both and the SFR steadily decrease afterward. After , star formation takes place almost exclusively in the central region, even though only 1/4 of the available gas in the galaxy is located in the central region at that time. The remainder of the gas is mostly located at large radii, inside the spiral arms, where the gas density is significantly lower than in the central region.
In the middle left and bottom left panels of Figure 5, we also plotted the oxygen mass and iron mass inside the central region, after adjusting the scales to match the evolution of at early time. Before , the masses of hydrogen and oxygen increase roughly at the same specific rate , and as a result the [O/H] remain fairly constant (top right panel). The same is true for iron, up to (see middle right panel). Afterward, and increase faster than , causing the increase in [O/H] and [Fe/H]. reaches a peak at while and peak slightly later. After reaching the peak, all masses decrease, but decreases faster than and , and consequently [O/H] and [Fe/H] keep increasing.
The plots of [O/H] and [Fe/H] show a similar behavior: there is an initial drop in [O/H] and [Fe/H] caused by the inflow of low-metallicity gas into the center. This is partly compensated by enrichment from Type II SNe, which produce some iron and a lot more oxygen. At , the SFR reaches its peak and starts decreasing. This reduces the production of oxygen by Type II SNe, and causes a change of slope in [O/H]. In the bottom right panel of Figure 5, we plot [O/Fe], which gives the relative importance of Type II and Type Ia SNe. There is a clear change of regime at , when enrichment by Type Ia SNe takes over. Note that chemical enrichment is not entirely caused by stars formed during the simulation. The stars present in the initial conditions contribute as well. Therefore, enrichment by both Type II and Type Ia Sne starts at , following the age distribution of the existing stars. Note also that Type Ia SNe have a delay of about 0.4 Gyr from the birth of their progenitors (see Fig. 1 of Kobayashi et al. 2000). As a result, when the SFR increases, the rate of Type Ia SNe also increases but with a 0.4 Gyr delay relative to the rate of Type II SNe. After the SFR reaches its peak and starts decreasing, the iron production, mainly due to Type Ia SNe, can exceed the oxygen production with a delay (depending on how quickly the SFR decreases). Enrichment by Type Ia SNe is more extended in time, and as a result [Fe/H] keeps increasing and [O/Fe] keeps decreasing, at least over the timescale of the simulation. However, note that we see an initial increase of [O/Fe], because we set the initial [O/Fe] to 0. If the initial value of [O/Fe] was significantly higher, which would likely be the case in high-redshift galaxies, we would not expect to see an initial upturn of [O/Fe] due to the increase of SFR.
3.2.2 Metallicity Evolution
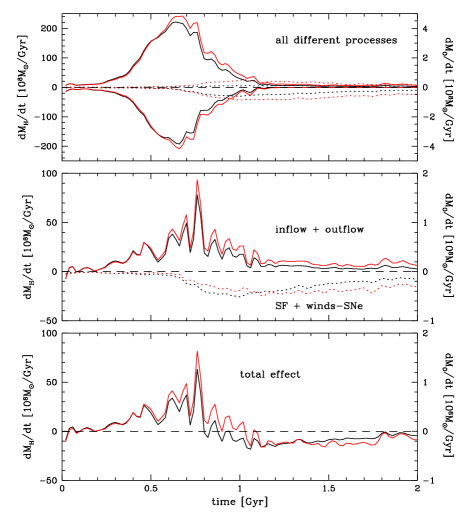
Four processes can modify the mass of a particular element in the gas phase inside the central region: (1) gas flowing into the central region, (2) gas flowing out of the central region, (3) gas being converted into stars, and (4) gas being released by stars in the form of stellar winds and SNe ejecta (we will refer to these two processes together as stellar outflows),. We now investigate the role of these various processes. The top panel of Figure 6 shows the rate of change of hydrogen mass (black lines and left axes) and oxygen mass (red lines and right axes) inside the central region. The middle panel of Figure 6 shows the combined effect of matter flowing across the boundary of the central region (solid lines) and matter exchange between the stellar and gas phase (dotted lines). The bottom panel of Figure 6 shows the combined effect of all processes.
Between and , there are large amounts of gas both moving in and moving out of the central region (solid lines in top panel of Fig. 6). This can be understood by examining the velocity field of the gas inside the bar (Fig. 2). At , the gas inside the bar moves along an elongated, elliptical orbit. This orbit intersects the edge of the central region, hence the gas is flowing across the boundary, both moving in and moving out. This elongated vortex contracts with time, and after , it is entirely contained inside the central region. At this point, the flux of gas through the edge is small, and further enrichment is caused mostly by stars in the central region (bottom dotted lines in top panel of Fig. 6). Because of the overall contraction of the gas along the bar, there is a net inflow of gas into the central region (middle panel of Fig. 6). The rate of net inflow is quite irregular because the gas tends to become clumpy, but overall most of the inflow takes place between and . As the gas get progressively enriched by SNe and stellar winds, the flux of oxygen increases relative to the flux of hydrogen, causing a net increase of [O/H] inside the central region.
The net effect of star formation, SNe, and stellar winds is a decrease in the amount of gas, since some of the matter remains trapped in stellar remnants or in stars whose lifetime exceeds the duration of the simulation. Because gas returned to the ISM by SNe and winds has been enriched, the net effect is again an increase in [O/H]. There is a delay between gas flowing into the central region and gas being removed by star formation, the latter becoming important only after . As a result, the total mass of hydrogen and oxygen in the central region increases with time until , and then decreases afterward (bottom panel of Fig. 6).
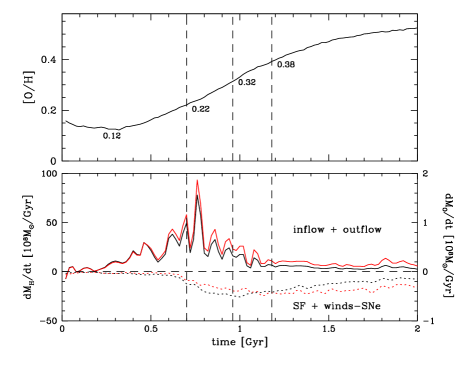
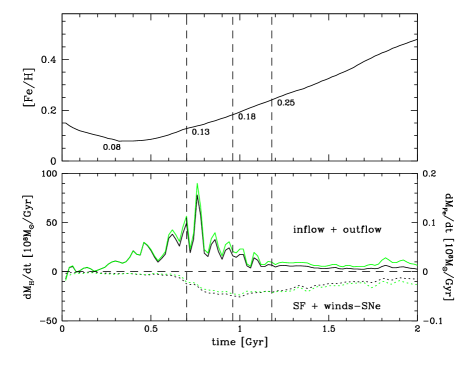
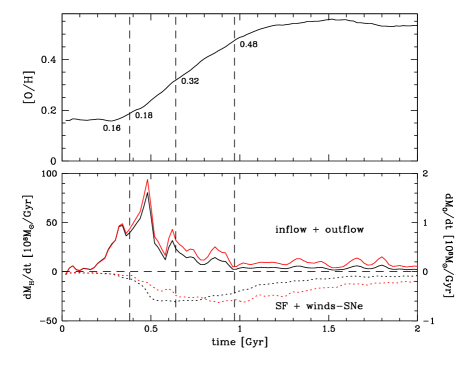
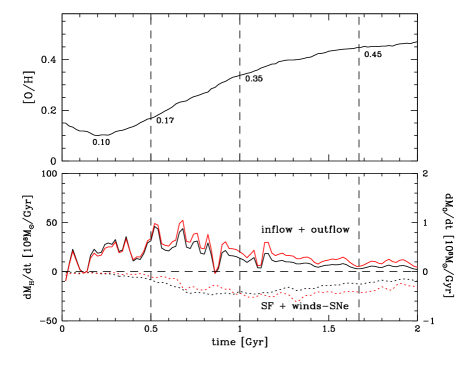
In Figure 7, we combine the top right panel of Figure 5 with the middle panel of Figure 6, to show the effect of these various processes on the central metallicity. Between and , [O/H] increases from 0.12 to 0.22, even though the effect of the central stars is negligible. This early enrichment is entirely caused by metal-rich gas flowing into the central region. This gas was not enriched by central stars, and was therefore enriched in other regions, prior to falling into the central region. After , central star formation becomes important, but until , gas flow across the boundary remains the dominant process. During this period, [O/H] increases from 0.22 to 0.32. Star formation starts to dominate only after , and gas flow across the boundary becomes negligible after . Overall, half of the enrichment (from to ) takes place before , when net inflow of metal-rich gas was either the only process or the dominant process taking place. In Figure 8, we plot the corresponding results for iron. This results are qualitatively similar to the ones shown in Figure 7. Gas inflow dominates until . Afterward, the dominant process is net removal of gas by star formation and stellar outflows.
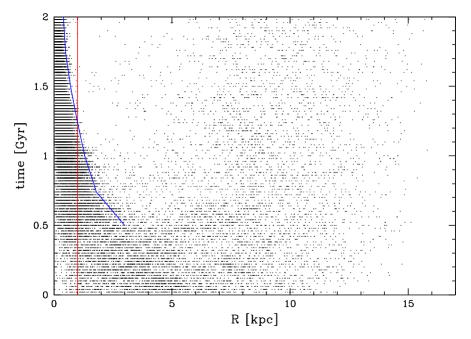
These results imply that the central region does not evolve in isolation. About half of the metals that end up in the central region were formed somewhere else. To understand this, we need to examine the global history of star formation in the galaxy. We identified all star formation events in the simulation (that is, a gas particle turning into a star particle between two output steps). Figure 9 shows the epoch and the distance from the center where each event took place. The red line indicates the radius of the central region. The blue curve shows the extent of the gaseous component of the bar, and was calculated separately by visual inspection of the right-hand-side panels of Figure 1 and similar panels at different times. The blue curve forms a near-perfect envelope that encloses most star formation events. This indicates that star formation is not limited to the central region. Instead, stars are forming everywhere along the bar. At , the gaseous component of the bar is about in length, that is, three times the diameter of the central region. Most of the stars forming inside the bar at that time form outside of the central region. As the gaseous component of the bar contracts, a larger fraction of the stars form inside the central region, and at , the gaseous component of the bar falls entirely inside the central region. This corresponds to the time when the next flux of metal-enriched gas across the boundary of the central region becomes negligible, as seen in Figures 7 and 8.
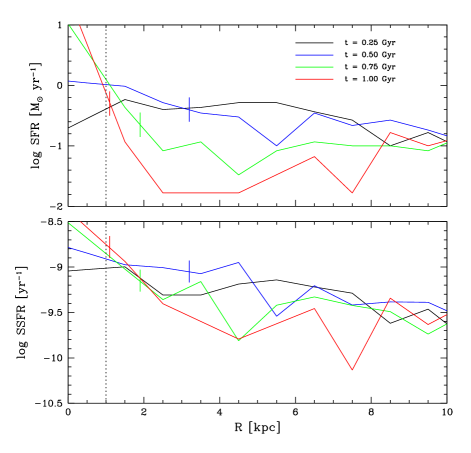
We calculated the SFR profiles and specific SFR (SSFR) profiles at different times. The results are shown in Figure 10. The curves at are rather flat, indicating that star formation is taking place all along the bar, at roughly the same rate.222At , the bar has not formed yet. Afterward, the gaseous component of the bar contracts, and the SFR and SSFR become centrally concentrated. However, the fluctuations in SSFR at late time remain fairly small. The SFR becomes centrally concentrated at late time mostly because the gas available for forming stars becomes itself centrally concentrated.
Notice that star formation is not limited to the bar. All the dots on the right of the blue curve in Figure 9 correspond to stars forming in the disk, mostly inside the spiral arms. The apparent “void” between 1 and , which is also visible in the top red curve in Figure 10, is simply a geometric effect; if stars are forming uniformly over the surface of the disk, we expect the SFR to increase linearly with radius.
3.3 Changing the Resolution
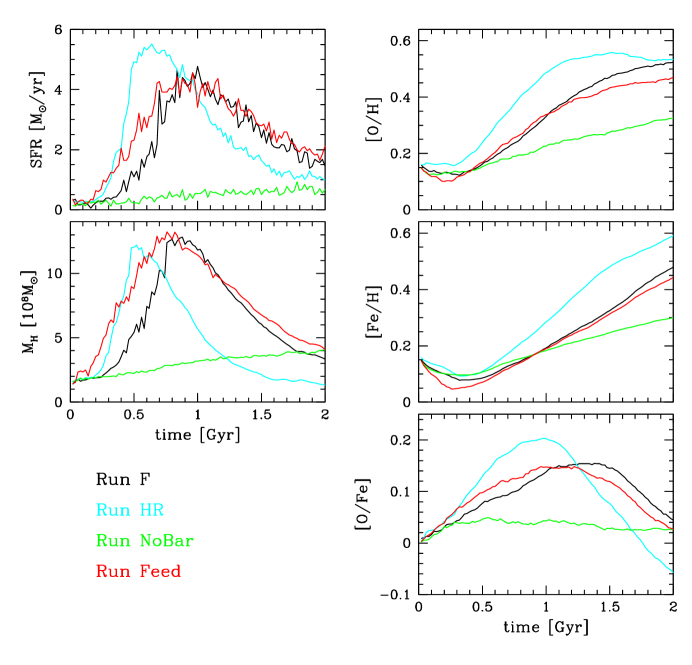
Figure 11 shows the evolution of the SFR, hydrogen mass, [O/H], [Fe/H], and [O/Fe] in the central region, for all runs. The blue and black lines show the results for Runs HR and F, respectively, which only differ in the number of particles used. As we see, increasing the resolution does not lead to convergence. This is likely caused by the use of a fixed density threshold, , for star formation. As the resolution increases, the simulation is capable of resolving finer structures, and more gas particles are eligible to reach the threshold density more quickly. The finer structures and earlier starbursts could help developing more structures in the gas, which could enhance the growth of the non-asymmetric structures of the stars, such as a bar and spiral arms. We should be able to adjust and the other parameters to match the lower-resolution run, but this is not our goal in this paper. This comparison run demonstrates that the timescale of the evolution of chemical and dynamical properties is sensitive to the simulation set-up, but the evolution paths are qualitatively similar. In future work, we will continuously improve our simulations by calibrating these parameters against the various observational constraints (Rahimi & Kawata, 2012), and explore also the initial conditions, such as the mass of the disk and the gas mass fraction.
Still, the results for the Runs F and HR are qualitatively similar. The SFR and the hydrogen mass initially increase, reach a peak, and then decrease. The SFR peak is reached earlier in Run HR, at instead of . Looking at the right panels in Figure 11, we see interesting differences. In Run HR, [O/H] reaches a peak at , and starts to decrease. The plot of [O/Fe] versus time shows that after , Type Ia SNe and mass loss from the intermediate-mass stars start to dominate. The stellar mass ejecta do not produce much oxygen, but they produce a lot of hydrogen. Hence, the decrease in [O/H] is not caused by oxygen depletion, but rather by dilution: [O/H] goes down because the amount of hydrogen goes up relative to the amount of oxygen. In Run F, mass loss from intermediate-mass stars takes over much later, and for that reason [O/H] keeps increasing until the end of the simulation. Figure 12 shows the evolution of [O/H], , and in the central region, for Run HR. The vertical dashed lines indicate the same particular epochs as in Figure 7: star formation becoming significant, equal contribution from inflow and stars, and inflow becoming insignificant. Comparing with Figure 7, we see that the period during which inflow + outflow of gas dominates is much shorter, extending from to . Also, star formation and stellar outflows become important earlier, around . But qualitatively, the results are the same for Runs F and HR: an early period dominated by gas flowing in and out of the central region, during which [O/H] increases from 0.16 to 0.32, followed by a late period dominated by star formation and stellar outflows, during which [O/H] increases to a maximum of 0.56 before falling.
3.4 Barred versus Unbarred Galaxy
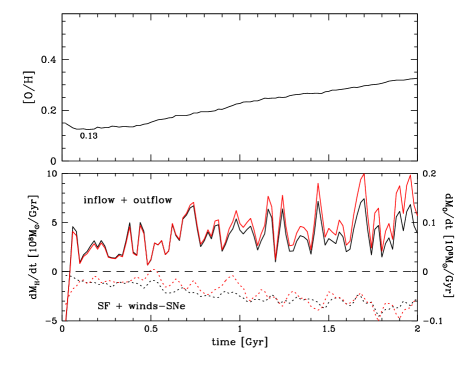
The green lines in Figure 11 show the results for Run NoBar. In the absence of a bar, there is very little gas moving into the central region, and both the SFR and increase very slowly, resulting is smaller changes in [O/H], [Fe/H], and [O/Fe] compared to the fiducial run. Interestingly, at , the mass of hydrogen in the central region is almost the same in Runs F and NoBar, though it gets to that value in totally different ways. In Run F, the bar channels large quantities of gas into the central region, but most of the gas is converted into stars. In Run Nobar, the SFR is much lower. The SFR increases as increases, but never gets high enough to result in a decrease in . Metal enrichment is reduced compared to Runs F and HR, and interestingly [O/Fe] is nearly constant. Figure 13 shows the evolution of [O/H], , and in the central region, for Run NoBar. The results are totally different than the ones for Run F (Fig. 7). The rates are about an order of magnitude smaller, for all processes. We do not find an early period dominated by inflow + outflow and a late period dominated by star formation + stellar outflows. Instead, all processes are taking place simultaneously, and all rates increase roughly linearly with time. Inflow + outflow dominate at all times (bottom panel), indicating that the increase in [O/H] and [Fe/H] seen in the central region is mostly caused by gas being enriched outside of the central region and moving in afterward. In Runs F and HR, the gaseous component of the bar contracts and eventually falls entirely inside the central region, shutting down inflow. This does not happens in the absence of a bar. Gas flows slowly and steadily into the central region all the way to the end of the simulation.
3.5 Stronger Feedback
The red lines in Figure 11 show the results for Run Feed. The results are very similar to Run F. Increasing the stellar wind and SNe feedback by an order of magnitude has virtually no effect on the flow of the gas, indicating that this flow is still dominated by gravitational dynamics. The only real difference is the central SFR and central hydrogen mass, which start to rise earlier, but eventually reach the same peak values at the same time. Having nearly the same SFR in Runs F and Feed likely results from competing effects. A larger feedback results in compression and reheating of the ISM, the former process favoring star formation and the second process inhibiting it. Still, it is somehow surprising that such a large increase in feedback makes so little difference. Figure 14 shows the evolution of [O/H], , and in the central region, for Run Feed. Again, the results are similar to those for Run F. Gas inflow dominates up to , and during that period [O/H] increases from 0.10 to 0.35. Afterward, star formation and stellar outflows dominate, and [O/H] increases up to 0.47.
3.6 The Effect of Inclination and Aperture
So far, we have defined the central region as a cylinder of diameter centered on the rotation axis of the galaxy. Observationally, this corresponds to a disc galaxy seen face-on. In practice, face-on galaxies are fairly rare. In this section, we redefine the central region as a cylinder of diameter , not centered on the rotation axis, but rather on the line-of-sight. We consider galaxies with a inclination. This is large enough to potentially have an effect, while still small enough to allow for a visual identification of the bar.
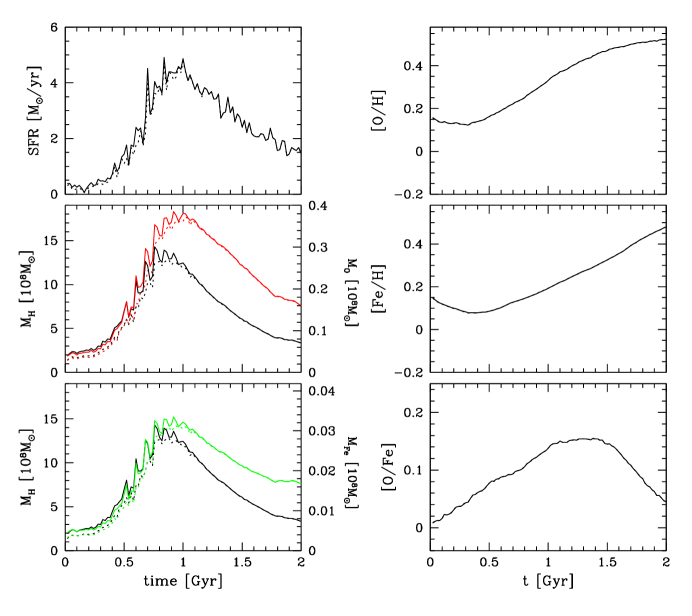
Figure 15 shows the results for Run F. For comparison, we also plot as dotted lines the results with no inclination, copied from Figure 5. They are very similar. In particular, [O/H], [Fe/H], and [O/Fe] differ by less than 2%, making the curves indistinguishable. Most of the gas in the central region is concentrated in the inner , so rotating a region of size only produces a small edge effect. Therefore, our results are essentially insensitive to inclination.
We have considered an aperture of , because it corresponds to the typical size of the fibre in the SDSS. But of course the actual aperture is redshift-dependent. We now go back to Run F with no inclination (face-on galaxy), and consider the effect of varying the aperture. Figure 16 shows the evolution of [O/H], , and in the central region, for an aperture of diameter . Comparing with Figure 7, we find that reducing the aperture does not qualitatively change the results. We still have an early phase when gas inflow dominates, and a later phase when star formation and stellar outflows dominate. However, everything is shifted to later times. The effect of star formation and stellar outflows become important at (compared to for the aperture), the effects of gas inflow and stars are comparable at (compared to for the aperture), and at the end of the simulation, gas inflow is still important. The gaseous component of the bar contracts with time, but it eventually reaches a minimum size which roughly corresponds to the aperture size of (see Fig. 9).
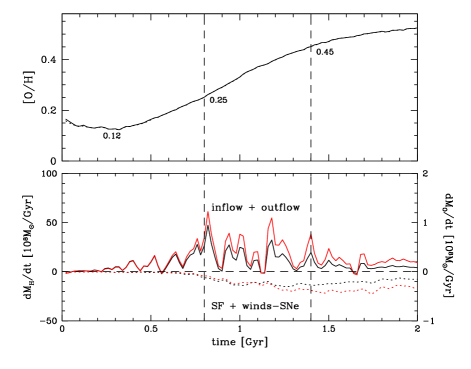
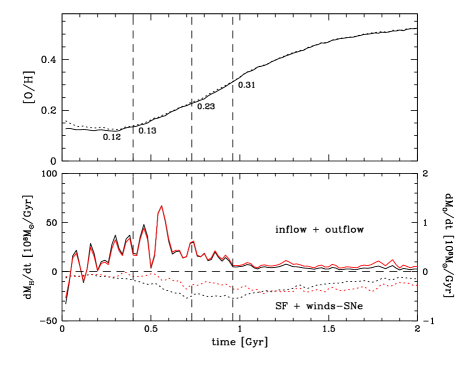
Figure 17 shows the results for an aperture of diameter , which encloses most of the bar for the full duration of the simulation. This time everything is shifted to earlier times. The effects of star formation and stellar outflows become important at , the effects of gas inflow and stars are comparable at , and gas inflow becomes negligible at , when the gaseous component of the bar falls entirely inside the central region. Interestingly, the evolution of [O/H] is very insensitive to the choice of aperture (top panels in Figs. 16 and 17), even though the timing of the physical processes responsible for the evolution of [O/H] strongly depends on the choice of aperture.
4 DISCUSSION
The classic picture of gas flowing along the bar, producing a central starburst, and enriching the gas in the central region, turns out to be too simplistic. Several physical processes complicate this picture. The gas falling toward the central region tends to form an elongated inner orbit inside the stellar bar. Until this orbit contracts sufficiently to be entirely contained inside the central region, this region does not evolve in isolation. The dominant process during this period is not star formation + stellar outflows in the central region, but rather exchange of gas between the central region and the rest of the galaxy. The amount of gas flowing in and out of the central region greatly exceeds the amount of gas involved in star formation and stellar outflows, even when the central SFR reaches its maximum value. This implies, in particular, that metal-enrichment in the central region cannot be viewed as a mere consequence of star formation in the same region. Stars formed in the central region can end up enriching the gas outside of the central region, and vice-versa.
For instance, consider a star particle forming in the central region. This star particle represents collectively an ensemble of stars which have a range of initial masses, and therefore a range of lifetimes. The production of metals by these stars and their deposition into the ISM will therefore be extended in time333Incidently, this explains why the abundance ratios vary much more smoothly than the SFR.. As the star particle moves along the length of the bar on an elongated orbit, it will deposit metals over the entire length of the bar. The same is true for star particles forming in the bar but outside of the central region: they will deposit metals over the entire length of the bar, including in the central region. Furthermore, the gas itself follows elliptical orbits, and this contributes to spreading metals over the length of the bar.

To illustrate this, we calculated the number of times each particle crossed the boundary of the central region, in Run F. Figure 18 shows histograms of the number of crossings, for star and gas particles. We excluded particles that were never inside the central region. Hence, the leftmost bins (zero-crossings) represent particles that were located in the central region in the initial conditions, and remained in the central region throughout the simulation.
Star particles experience lots of crossings. The median value is 15 crossings. When a particle moves along an elongated orbit that intersects the central region, there are 4 crossings per orbit. Hence, about half of the star particles complete between 1 and 4 full orbits. The histogram for gas particles is significantly different. While the length of stellar component of the bar remains roughly constant during the simulation, the gaseous component of the bar contracts with time. As a result, most gas particles that cross the boundary of the central region cross it only once. Most of the gas located in the bar will essentially end up in the central region if we wait long enough. This implies that there is no correlation between central star formation and central metal-enrichment, but, in galaxies that are sufficiently evolved, there is a correlation between global star formation and central metal-enrichment, in the sense that stars forming all over the length of the bar produce and release metals which eventually end up in the central region.
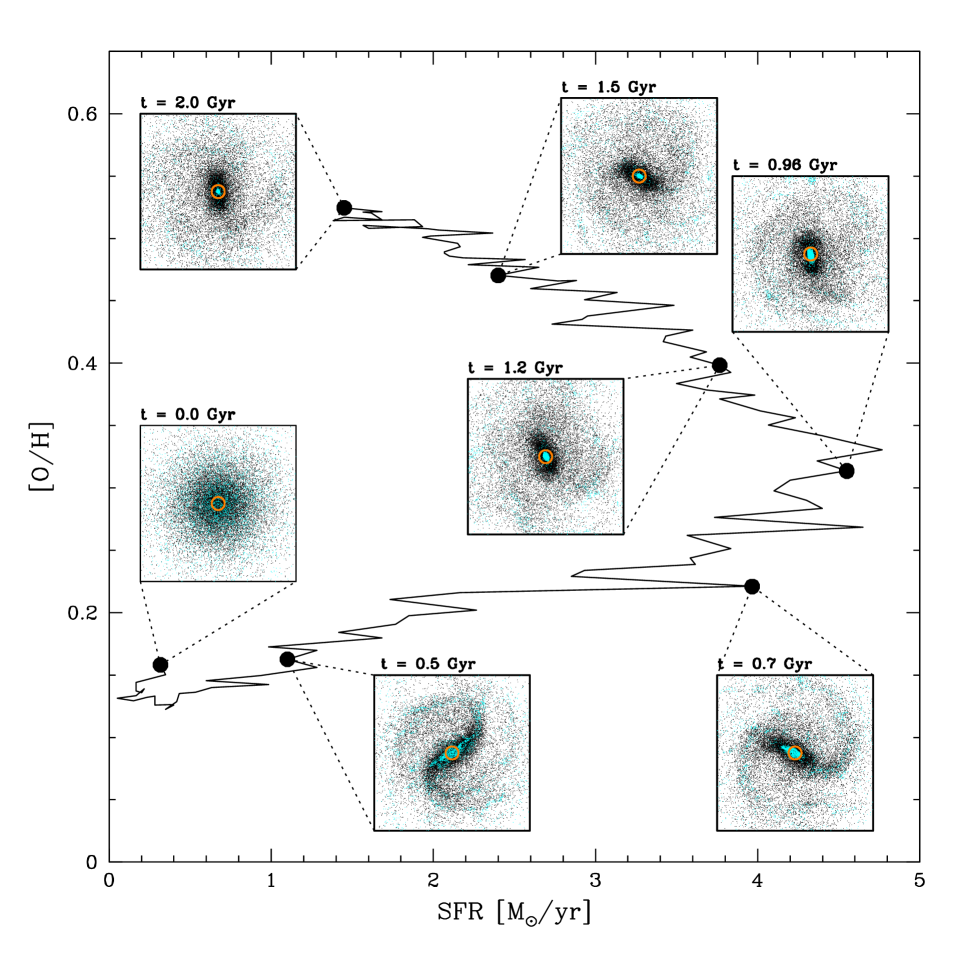
We focused on the central because of its observational relevance. It is interesting to see what an observer could infer about the evolutionary stage of the galaxy, simply by observing the central region. All quantities plotted in Figure 5 (SFR, , , , [O/H], [Fe/H], [O/Fe]) vary non-monotonically with time. Hence, measuring one of these quantities could not determine the current evolutionary stage of the galaxy. Only a combination of measurements could achieve that. To illustrate this, we plot the central value of [O/H] versus the central value of the SFR for Run F in Figure 19. The line does not intersect itself, indicating that each point on the line corresponds to a specific epoch in the evolution of the galaxy. We have identified seven particular epochs, and plotted the stellar and gas distributions for each one.
-
•
. Beginning of the simulation. The stellar and gas distributions are axisymmetric, the SFR is very low, and [O/H] has the initial value.
-
•
. This is the epoch when the bar is the strongest and there is plenty of gas. The central SFR is still very low, and the dominant process responsible for metal-enrichment of the central region is gas exchange between the central region and the rest of the bar (Fig. 6, top and middle panels; Fig. 7, bottom panel).
-
•
. The flux of gas in and out of the central region gets close to its maximum value, and star formation + stellar outflows start to become important (Fig. 7, bottom panel).
-
•
. The SFR and gas mass in the central region reach their maximum values (Fig. 5, left panels). The contribution of gas inflow and star formation + stellar outflows to metal-enrichment of the central region are comparable (Fig. 7, bottom panel). The orbit of the gas in the bar will soon be enclosed by the aperture (Fig. 2, bottom left panel).
-
•
. The orbit of the gas has fallen inside the central region, and the flux of gas across the boundary of the central region becomes insignificant. (Fig. 7, bottom panel). From that point on, the central region evolves like a closed-box system, and star formation + stellar outflows are solely responsible for further metal-enrichment of the central region.
-
•
. [O/Fe] reaches its peak and starts decreasing (Fig. 5, bottom right panel), indicating a transition from enrichment dominated by Type II SNe to enrichment dominated by Type Ia SNe.
- •
5 SUMMARY AND CONCLUSION
Our objective was to investigate the connection between the central SFR and central metallicity in barred disc galaxies. In this initial study, we considered the particular case of a disc galaxy with a baryonic mass of and initial stellar fraction of 80%, in which a bar forms by bar instability. We performed a series of four simulations. We analyzed these simulations, focusing on the evolution of the SFR and metallicity in the central region of the galaxy, defined as the central kiloparsec (or in diameter), the approximate size of the SDSS fibre.
In our first simulation, a strong bar of length composed of stars and gas forms around . The stars and gas inside the bar do not lose all their angular momentum. This prevents them from falling directly into the center. Instead, they form elongated orbits that go through the center of the galaxy. The orbits tend to contract with time, but the effect is much more important for the gas than the stars. By the end of the simulation, at , the stellar components of the bar still has a length of order , while the gaseous component of the bar has contracted down to a length of less than .
Before , when the bar has not yet formed, star formation is taking place mostly inside a radius of , where the gas is the densest. At , when the bar forms, 69% of the star formation takes place inside the bar, the remainder taking place inside the spiral arms. At this point, the gaseous component of the bar has a length of about , much larger than the size of the central region. Hence, most stars forming in the bar do not form in the central region. But as the gaseous component of the bar contracts, a larger fraction of that gas is located in the central region, and the SFR in that region increases. By , that gas is enclosed entirely inside the central region. There is no more gas flowing in, and the central SFR decreases as less gas is available to form new stars.
We tracked the evolution of the metal abundances in the gas phase, in the central region. We start the simulation with an initial metallicity gradient. This gradient is maintained in the early stages of the simulation, when gas moves along circular orbits. Once the bar forms, gas starts moving radially. The central metallicity initially decreases, and then steadily increase until the end of the simulation. Naively one could think that this increase in central metallicity is caused by outflows from central stars. We decided to investigate this issue in more detail, by calculating separately the contribution of the various process that can change the hydrogen mass, oxygen mass, and iron mass located in the central region (Figs. 6, 7, and 8). The surprising result is that the central metallicity increases significantly before the contribution of central stars becomes significant. Star formation and metal enrichment is taking place along the entire length of the bar. Because initially the central region is much smaller than the bar, most of the metals are produced outside the central region. As the gas moves along the bar on elliptical orbits, it moves in and out of the central region. But as these elliptical orbits contract with time, there is a net flux of gas moving into the central region. This gas was predominantly enriched by stars located outside the central region, and early-on, this net influx of metal-enriched gas into the central region dominates over the metals produced by the central stars.
Overall, about half of the increase in [O/H] and [Fe/H] in central region is caused by in-situ stellar enrichment. The other half is caused by stars located outside the central region, which produce metals that are carried into the central region by large-scale gas flows along the bar. The main conclusion is that there is no direct connection between central SFR and central metallicity, but there is a connection between global SFR and late-time, central metallicity: stars forming over the entire length of the bar produce metals that will eventually end up in the central region as the gaseous component of the gas contracts.
Some recent IFU observations of barred galaxies appear to support the conclusions of our simulations that star formation happens along the length of the bar (Cantin et al., 2010; Robert et al., 2011, 2013). Histograms of the mass of the stellar populations versus age for two barred galaxies, NGC4900 and NGC5430, reveal that the stellar metallicity in the central region does not simply increase gradually with time. Although the stellar metallicity may be different than the gas metallicity, it suggests that the gas used to form the stars in the central region may get enriched and diluted by an outside contribution (like gas flowing along the bar). Or the mixing process for the gas (between the time massive stars release enriched elements and low mass stars release less enriched elements) involves a complicated timing with the formation of new generation of stars.
We performed three more simulations. In one case, we increased the resolution by a factor of 3, and in another case, we increased the amount of stellar wind and SNe feedback by a factor of 10. In both cases, we obtained results that are quantitatively different, but qualitatively similar to our initial run. In particular, we still identify an early phase when net gas inflow into the central region is primarily responsible for increasing the central metallicity, and a later phase when metal-enrichment by central stars dominate. We also performed a simulation in which no bar forms. In that simulation, there is very little gas flowing across the boundary of the central region, and very few stars forming in the central region. But interestingly, gas inflow is still the dominant process responsible of enriching the gas in the central region.
In this paper, we focused on a particular set of initial conditions, in order to investigate the relationships between the various physical processes driving the evolution of the galaxy. In future work, we will vary the initial conditions, specifically the mass of the galaxy and the strength of the bar, with the goal of explaining the origin of the various trends revealed by studies of barred galaxies in the SDSS.
acknowledgments
We would like to thank Carmelle Robert for useful discussions. Computations were performed on the Guillimin supercomputer at McGill University, under the auspices of Calcul Québec and Compute Canada. HM and SLE are supported by the Natural Sciences and Engineering Research Council of Canada. HM is also supported by the Canada Research Chair program. DK acknowledges the support of the UK’s Science & Technology Facilities Council (STFC Grant ST/H00260X/1). HM is thankful to the Department of Physics and Astronomy, University of Victoria, for its hospitality
References
- Arsenault (1989) Arsenault, R. 1989, A&A, 217, 66
- Athanassoula (1992a) Athanassoula, E. 1992a, MNRAS, 259, 328
- Athanassoula (1992b) Athanassoula, E. 1992b, MNRAS, 259, 345
- Athanassoula (2003) Athanassoula, E. 2003, MNRAS, 341, 1179
- Baba et al. (2010) Baba, J. Saitoh, T. R., & Wada, K. 2010, PASJ, 62, 1413
- Bang & Ann (2009) Bang, J., & Ann, H. B. 2009, J. Korean Earth Sci. Soc., 30, 1
- Carlberg & Sellwood (1985) Carlberg, R. G., & Sellwood, J. A. 1985, ApJ, 292, 79
- Cantin et al. (2010) Cantin, S., Robert, C., Mollá, M., & Pellerin, A. 2010, MNRAS, 404, 811
- Coelho & Gadotti (2011) Coelho, P., & Gadotti, D. A. 2011, ApJ, 743, L13
- Combes (2003) Combes, F. 2003, in ASP Conf. Ser. 209, Active Galactic Nuclei: From Central Engine to Host Galaxy, eds. S. Collin, F. Combes, & I. Shlosman (San Francisco, CA: ASP), 441
- Combes & Elmegreen (1993) Combes, F., & Elmegreen, B. G. 1993, A&A, 271, 391
- Combes & Gerin (1985) Combes, F., & Gerin, M. 1985, A&A, 150, 327
- Devereux (1987) Devereux, N. 1987, ApJ, 323, 91
- Ellison et al. (2008) Ellison, S. L., Patton, D. R., Simard, L., & McConnachie, A. W. 2008, ApJ, 672, L107
- Ellison et al. (2011) Ellison, S. L., Nair, P., Patton, D. R., Scudder, J. M., Mendel, J. T., & Simard, L. 2011, MNRAS, 416, 2182
- Elmegreen et al. (2004) Elmegreen, B. G., Elmegreen, D. M., & Hirst, A. C. 2004, ApJ, 612, 191
- Emsellem et al. (2001) Emsellem, E., Greusard, D., Combes, F., Friedli, D. Leon, S., Pécontal, E., & Wozniak, H. 2001, A&A, 368, 52
- Eskridge et al. (2000) Eskridge, P. B. et al. 2000, AJ, 119, 536
- Friedli & Benz (1993) Friedli, D., & Benz, W. 1993, A&A, 268, 65
- Friedli & Benz (1995) Friedli, D., & Benz, W. 1995, A&A, 301, 649
- Friedli et al. (1994) Friedli, D., Benz, W., & Kennicutt, R. 1994, ApJ, 430, L105
- Fux (1999) Fux, R. 1999, A&A, 345, 787
- Gibson (1994) Gibson, B. K. 1994, MNRAS, 271, 35
- Giordano et al. (2011) Giordano, L., Tran, K.-V. H., Moore, B., & Saintonge, A. 2011, arXiv:1111.1532
- Grand et al. (2012) Grand, R. J. J., Kawata, D., & Cropper, M. 2012, MNRAS, 426, 167
- Greif et al. (2009) Greif, T. H., Glover, S. C. O., Bromm, V., & Klessen, R. S. 2009, MNRAS, 392, 1381
- Hao et al. (2009) Hao, L., Jogee, S., Barazza, F. D, Marinova, I., & Shen J., 2009, in ASP Conf. Ser. 419, Galaxy Evolution: Emerging Insights and Future Challenges, eds. S. Jogee, I. Marinova, L. Hao., & G. A. Blanc (San Francisco, CA:ASP), 402
- Hawarden et al. (1986) Hawarden, T. G., Mountain, C. M., Leggett, S. K., & Puxley, P. J. 1986, MNRAS, 221, 41P
- Heckman (1980) Heckman, T. M. 1980, A&A, 88, 365
- Heller & Shlosman (1994) Heller, C. H., & Shlosman, I. 1994, ApJ, 424, 84
- Ho et al. (1997) Ho, L. C., Filippenko, A. V., & Sargent, W. L. W. 1997, ApJ, 487, 591
- Huang et al. (1996) Huang, J. H., Gu, Q. S., Su, H. J., Hawarden, T. G., Liao, X. H., & Wu, G. X. 1996, A&A, 313, 13
- Hunt et al. (2008) Hunt, L. K. et al. 2008, A&A, 482, 133
- Hunt & Malkan (1999) Hunt, L. K., & Malkan, M. A. 1999, ApJ, 516, 660
- Iwamoto et al. (1999) Iwamoto, K., Brachwitz, F., Nomoto, K., Kishimoto, N., Umeda, H., Hix, W. R., & Thielemann, F.-K. 1999, ApJS, 125, 439
- Jogee (2006) Jogee, S. 2006, in Physics of Active Galactic Nuclei at all Scales, eds. D. Alloin, R. Johnson, & P. Lira (Lecture Notes in Physics, Vol 693; Berlin:Springer), 143
- Jogee at al. (2004) Jogee, S. et al. 2004, ApJ, 615, L105
- Jogee et al. (2005) Jogee, S., Scoville, N., & Kenney, J. D. P. 2005, ApJ, 630, 837
- Kawata & Gibson (2003) Kawata, D., & Gibson, B. K. 2003, MNRAS, 340, 908
- Kawata et al. (2013) Kawata, D., Okamoto, T., Gibson, B. K., Barnes, D. J. & Cen, R. 2013, MNRAS, 428, 1968
- Kobayashi et al. (2000) Kobayashi, C., Tsujimoto, T., & Nomoto, K. 2000, ApJ, 539, 26
- Knapen et al. (2002) Knapen, J., H., Peréz-Ramírez, D., & Laine, S. 2002, MNRAS, 337, 808
- Knapen et al. (2000) Knapen, J., H., Shlosman, I., & Peletier, R. F. 2000, ApJ, 529, 93
- Kormendy & Kennicutt (2004) Kormendy, J., & Kennicutt, R. C. Jr. 2004, ARA&A, 42, 603
- Laine et al. (2002) Laine, S., Shlosman, I., Knapen, J H., & Peletier, R. F. 2002, ApJ, 567, 97
- Lara-López et al. (2010a) Lara-López, M. A., Bongiovanni, J. C., Pérez García, A. M., Sánchez-Portal, M., Castañeda, H. O., Fernández Lorenzo, M., & Povíc, M. 2010a, A&A, 519, A31
- Lara-López et al. (2010b) Lara-López, M. A. et al. 2010b, A&A, 521, L53
- Laurikainen et al. (2004) Laurikainen, E., Salo, H., & Buta, R. 2004, ApJ, 607, 103
- Lee et al. (2012a) Lee, G.-H., Park, C., Lee, M. G., & Choi, Y.-Y. 2012a, ApJ, 745, 125
- Lee et al. (2012b) Lee, G.-H., Woo, J.-H., Lee, M. G., Hwang, H. S., Lee, J. C., Sohn, J. & Lee, J. H. 2012b, ApJ, 750, 141
- Lynden-Bell (1979) Lynden-Bell, D. 1979, MNRAS, 187, 101
- Maciejewski et al. (2002) Maciejewski, W. Teuben, P. J., Sparke, L. S., & Stone, J. M. 2002, MNRAS, 329, 502
- Mannucci et al. (2010) Mannucci, F., Cresci, G., Maiolino, R., Marconi, A., & Gnerucci, A. 2010, MNRAS, 408, 2115
- Martin & Roy (1994) Martin, P., & Roy, J.-R. 1994, ApJ, 424, 599
- Martinet & Friedli (1997) Martinet, L., & Friedli, D. 1997, A&A, 323, 363
- Martínez & Muriel (2011) Martínez, H. J., & Muriel, H. 2011, MNRAS, 418, L148
- Masters et al. (2011) Masters, K. L. et al. 2011, MNRAS, 411, 2026
- Masters et al. (2012) Masters, K. L. et al. 2012, MNRAS, 424, 2180
- McLoed & Rieke (1995) McLoed, K. K., & Rieke, G. H. 1995, ApJ, 441, 96
- McMillan (2011) McMillan, P. J. 2011, MNRAS, 418, 1565
- Moles et al. (1995) Moles, M., Marquez, I., & Perez, E. 1995, ApJ, 438, 604
- Mulchaey & Regan (1997) Mulchaey, J. S., & Regan, M. W. 1997, ApJ, 482, L135
- Nair & Abraham (2010) Nair, P. B., & Abraham, R. G. 2010, ApJ, 714, L260
- Navarro et al. (1997) Navarro, J. F., Frenk. C. S., & White, S. D. M. 1997, ApJ, 490, 493
- Noguchi (1987) Noguchi, M. 1987, MNRAS, 228, 635
- Oey & Massey (1994) Oey, M. S., & Massey, P. 1994, ApJ, 425, 635
- Oh et al. (2012) Oh, S., Oh, K., & Yi, S. K. 2012, ApJS, 198, 4
- Olling & Merrifield (2001) Olling, R. P., & Merrifield, M. R. 2001, MNRAS, 326, 164
- Pagel et al. (1979) Pagel, B. E. J., Edmunds, M. G., Blackwell, D. E., Chun, M. S., & Smith, G. 1979, MNRAS, 189, 95
- Pfenniger & Friedli (1991) Pfenniger, D., & Friedli, D. 1991, A&A, 252, 75
- Rahimi & Kawata (2012) Rahimi, A., & Kawata, D. 2012, MNRAS, 422, 2609
- Regan & Teuben (2004) Regan, M. W., & Teuben, P. J. 2004, ApJ, 600, 595
- Robert et al. (2011) Robert, C., Cantin, S., Brière, É., Rousseau-Nepton, L., & Drissen, L. 2010, in Tracing the Ancestry of Galaxies (on the land of our ancestors), Proceedings of the International Astronomical Union, IAU Symposium, Volume 277, p. 100
- Robert et al. (2013) Robert, C., Cantin, S., Brière, É., Rousseau-Nepton, L., & Drissen, L. 2013, in press.
- Roberts et al. (1979) Roberts, W. W. Jr., Huntley, J. M., & van Albada, G. D. 1979, ApJ, 233, 67
- Robin et al. (2003) Robin, A. C., Reylé, C., Derrière, S., & Picaud, S. 2003, A&A, 409, 523
- Rodionov et al. (2009) Rodionov, S. A., Athanassoula, E., & Sotnikova, N. Ya 2009, MNRAS, 392, 904
- Salpeter (1955) Salpeter, E. E. 1955, ApJ, 121, 161
- Sellwood (1981) Sellwood, J. A. 1981, A&A, 99, 362
- Sheth et al. (2005) Sheth, K., Vogel, S. N., Regan, M. W., Thornley, M. D. & Teuben, P. J. 2005, ApJ, 632, 217
- Shlosman et al. (1989) Shlosman, I., Frank, J., & Begelman, M. C. 1989, Nature, 338, 45
- Shlosman & Noguchi (1993) Shlosman, I, & Noguchi, M. 1993, ApJ, 414, 474
- Shull (1980) Shull, J. M. 1980, ApJ, 238, 860
- Springel et al. (2005) Springel, V., Di Matteo, T., & Hernquist, L. 2005, MNRAS, 361, 776
- Thornton et al. (1998) Thornton, K., Gaudlitz, M., Janka, H.-Th., & Steinmetz, M. 1998, ApJ, 500, 95
- van Albada & Roberts (1981) van Albada, G. D., & Roberts, W. W. Jr. 1981, ApJ, 246, 740
- van den Hoek & Groenewegen (1997) van den Hoek, L. B., & Groenewegen, M. A. T. 1997, A&AS, 123, 305
- Wang et al. (2012) Wang, J. et al. 2012, MNRAS, 423, 3486
- Weaver et al. (1977) Weaver, R., McCray, R., Castor, J., Shapiro, P., & Moore, R. 1977, ApJ, 218, 377
- Woosley & Weaver (1995) Woosley, S. E., & Weaver, T. A. 1995, ApJS, 101, 181